
 1 Registry Star
Part:BBa_E1010
**highly** engineered mutant of red fluorescent protein from Discosoma striata (coral)
monomeric RFP: Red Fluorescent Protein. Excitation peak: 584 nm Emission peak: 607 nm
Usage and Biology
Robert E. Campbell started with Discosoma RFP (DsRed) and evolved a faster folding, monomeric variant. See paper listed in source. Codon optimized for expression in bacteria (?? DE)


iGEM11_Uppsala-Sweden: Expression of chromoproteins. The images above show E coli No part name specified with partinfo tag. expressing amilCP BBa_K592009 (blue), amilGFP BBa_K592010 (yellow) and RFP BBa_E1010 (red).
Peking iGEM 2016 has fused this part with triple spytag. The fused protein is participate in Peking’s polymer network. By adding this protein, the whole polymer network become visible in most conditions. If you want to learn more about Peking’s polymer network and the role of mRFP in this network, please click here https://parts.igem.org/Part:BBa_K1989004".
Allergen characterization of BBa_E1010: NOT a potential allergen
The Baltimore Biocrew 2017 team discovered that proteins generated through biobrick parts can be evaluated for allergenicity. This information is important to the people using these parts in the lab, as well as when considering using the protein for mass production, or using in the environment. The allergenicity test permits a comparison between the sequences of the biobrick parts and the identified allergen proteins enlisted in a data base.The higher the similarity between the biobricks and the proteins, the more likely the biobrick is allergenic cross-reactive. In the full-length alignments by FASTA, 30% or more amount of similarity signifies that the biobrick has a Precaution Status meaning there is a potential risk with using the part. A 50% or more amount of identity signifies that the biobrick has a Possible Allergen Status. In the sliding window of 80 amino acid segments, greater than 35% signifies similarity to allergens. The percentage of similarity implies the potential of harm biobricks’ potential negative impact to exposed populations. For more information on how to assess your own biobrick part please see the “Allergenicity Testing Protocol” in the following page http://2017.igem.org/Team:Baltimore_Bio-Crew/Experiments
For the biobrick part, BBa_E1010, there was a 27.6% of identity match and 56.9% of similarity match compared to the allergen database. This means that the biobrick part is not of potential allergen status. In the 80 amino acid alignments by FASTA, no matches found that are greater than 35% for this biobrick.
>Internal Priming Screening Characterization of BBa_E1010: Has no possible internal priming sites between this BioBrick part and the VF2 or the VR primer.
The 2018 Hawaii iGEM team evaluated the 40 most frequently used BioBricks and ran them through an internal priming screening process that we developed using the BLAST program tool. Out of the 40 BioBricks we evaluated, 10 of them showed possible internal priming of either the VF2 or VR primers and sometime even both. The data set has a range of sequence lengths from as small as 12 bases to as large as 1,210 bases. We experienced the issue of possible internal priming during the sequence verification process of our own BBa_K2574001 BioBrick and in the cloning process to express the part as a fusion protein. BBa_K2574001 is a composite part containing a VLP forming Gag protein sequence attached to a frequently used RFP part (BBa_E1010). We conducted a PCR amplification of the Gag-RFP insert using the VF2 and VR primers on the ligation product (pSB1C3 ligated to the Gag + RFP). This amplicon would serve as template for another PCR where we would add the NcoI and BamHI restriction enzyme sites through new primers for ligation into pET14b and subsequent induced expression. Despite gel confirming a rather large, approximately 2.1 kb insert band, our sequencing results with the VR primer and BamHI RFP reverse primer gave mixed results. Both should have displayed the end of the RFP, but the VR primer revealed the end of the Gag. Analysis of the VR primer on the Gag-RFP sequence revealed several sites where the VR primer could have annealed with ~9 - 12 bp of complementarity. Internal priming of forward and reverse primers can be detrimental to an iGEM project because you can never be sure if the desired construct was correctly inserted into the BioBrick plasmid without a successful sequence verification.
Contribution
Group:LZU-CHINA iGEM 2022
This year we used and characterized the red fluorescent protein (BBa_E1010). To target tumor cells,we designed several promoters such as pPepT promoter for hypoxia and used the TP901-mediated XOR gate to stabilize and enhance the fluorescent signal of pPepT. Here, red fluorescent protein was used as a reporter. The results showed that the introduction of TP901-XOR gate system could significantly enhance the magnitude of red fluorescent signal and its robustness.
Fig 1 indicates that pPepT induces the expression of the downstream gene mRFP with the decrease of O2. Thus, it can be seen that the hypoxia reporter can work properly.

Contribution
Group: NAU-CHINA iGEM 2020
Summary: In order to better and more comprehensive understand our favorite reporter whose name is BBa_E1010, this year NAU-CHINA uses SWISS MODEL(https://swissmodel.expasy.org) to model and simulates the tertiary structure of protein. We hope that the prediction of the structure will help other teams to better understand the nature and characteristics of this part and be able to use the reporter gene more skillfully.
The following model was built:
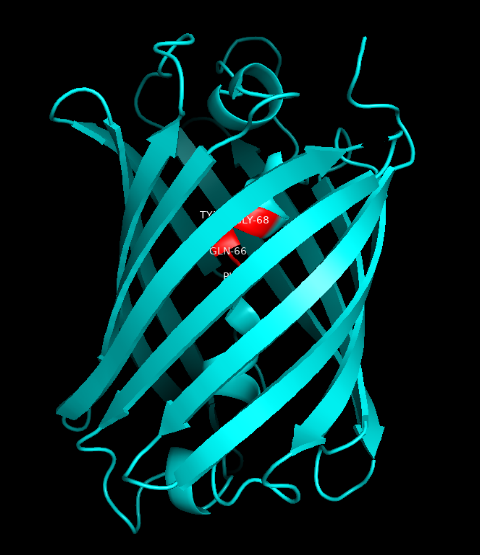
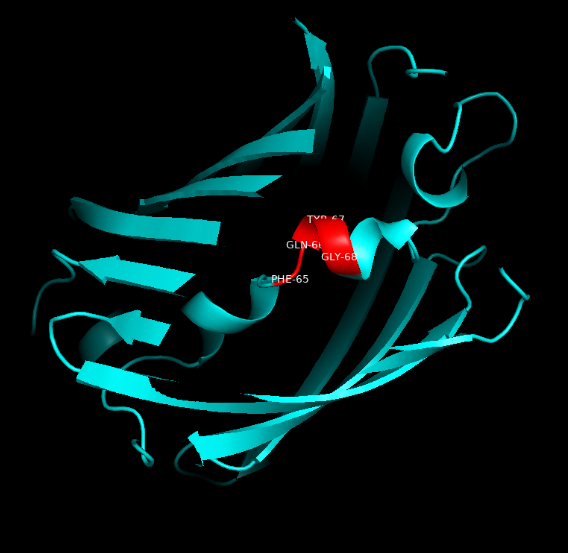
Fig.5. Model #01 Fig.6. the Active center
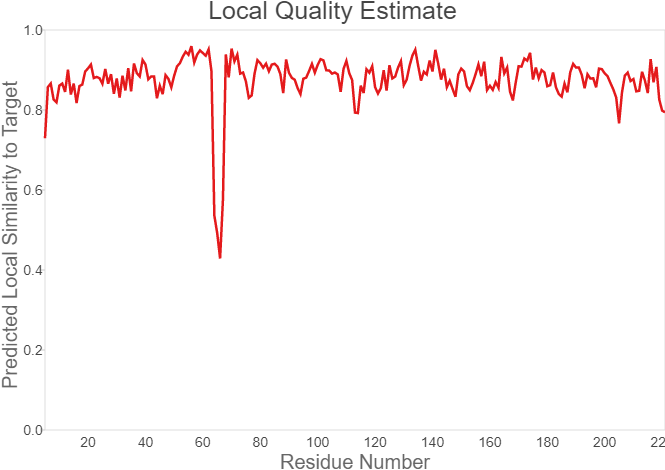
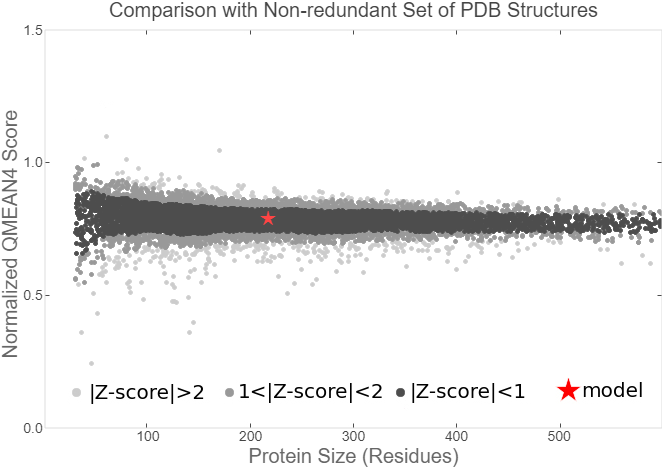
Fig.7. Local Quality Estimat Fig.8. Comparison with Non-redundant Set of PBD Structures
Target
MASSEDVIKEFMRFKVRMEGSVNGHEFEIEGEGEGRPYEGTQTAKLKVTKGGPLPFAWDILSPQFQ- YGSKAYVKHPADIPDYLKLSFPEGFKWERVMNFEDGGVVTVTQDSSLQDGEFIYKVKLRGTNFPSDG- PVMQKKTMGWEASTERMYPEDGALKGEIKMRLKLKDGGHYDAEVKTTYMAKKPVQLPGAYKTDIKLD- ITSHNEDYTIVEQYERAEGRHSTGA
Template 2qli.1.A
VSKGEEVIKEFMRFKQHMEGSVNGHEFEIEGEGEGRPYEGTQTARLKVTKGGPLPFAWDILSPQIX—SKAYVKHPADIPDYLKLSFPEGFKWERVMNFEDGGVVTVTQDSSLQDGEFIYKVKVRGTNFPSDGPV- MQKKTMGWEASSERMYPEDGALKGEMKMRLRLKDGGHYDAEVKTTYMAKKPVQLPGAYKTDIKLDITSH- NEDYTIVEQYERAEGRHSTGA
Materials and Methods
①Template Search
Template search with BLAST and HHBlits has been performed against the SWISS-MODEL template library (SMTL, last update: 2020-09-23, last included PDB release: 2020-09-18).
The target sequence was searched with BLAST against the primary amino acid sequence contained in the SMTL. A total of 670 templates were found.
An initial HHblits profile has been built using the procedure outlined in (Steinegger et al.), followed by 1 iteration of HHblits against Uniclust30 (Mirdita, von den Driesch et al.). The obtained profile has then be searched against all profiles of the SMTL. A total of 720 templates were found
②Template Selection
For each identified template, the template's quality has been predicted from features of the target-template alignment. The templates with the highest quality have then been selected for model building.
③Model Building
Models are built based on the target-template alignment using ProMod3. Coordinates which are conserved between the target and the template are copied from the template to the model. Insertions and deletions are remodelled using a fragment library. Side chains are then rebuilt. Finally, the geometry of the resulting model is regularized by using a force field. In case loop modelling with ProMod3 fails, an alternative model is built with PROMOD-II (Guex et al.).
④Model Quality Estimation
The global and per-residue model quality has been assessed using the QMEAN scoring function (Studer et al.).
⑤igand Modelling
Ligands present in the template structure are transferred by homology to the model when the following criteria are met: (a) The ligands are annotated as biologically relevant in the template library, (b) the ligand is in contact with the model, (c) the ligand is not clashing with the protein, (d) the residues in contact with the ligand are conserved between the target and the template. If any of these four criteria is not satisfied, a certain ligand will not be included in the model. The model summary includes information on why and which ligand has not been included.
⑥Oligomeric State Conservation
The quaternary structure annotation of the template is used to model the target sequence in its oligomeric form. The method (Bertoni et al.) is based on a supervised machine learning algorithm, Support Vector Machines (SVM), which combines interface conservation, structural clustering, and other template features to provide a quaternary structure quality estimate (QSQE). The QSQE score is a number between 0 and 1, reflecting the expected accuracy of the interchain contacts for a model built based a given alignment and template. Higher numbers indicate higher reliability. This complements the GMQE score which estimates the accuracy of the tertiary structure of the resulting model.
References
Andrew W , Martino B , Stefan B , et al. SWISS-MODEL: homology modelling of protein structures and complexes[J]. Nuclc Acids Research, 2018(W1):W296-W303.
Guex N , Peitsch M C , Schwede T . Automated comparative protein structure modeling with SWISS-MODEL and Swiss-PdbViewer: a historical perspective.[J]. Electrophoresis, 2010, 30(S10):S162-S173.
Stefan B , Andrew W , de Beer Tjaart A. P, et al. The SWISS-MODEL Repository-new features and functionality[J]. Nuclc Acids Research, 2016, 45(D1).
Gabriel S , Christine R , Waterhouse A M , et al. QMEANDisCo—distance constraints applied on model quality estimation[J]. Bioinformatics.
Bertoni, M., Kiefer, F., Biasini, M., Bordoli, L., Schwede, T. Modeling protein quaternary structure of homo- and hetero-oligomers beyond binary interactions by homology. Scientific Reports 7 (2017).
BLAST
Camacho, C., Coulouris, G., Avagyan, V., Ma, N., Papadopoulos, J., Bealer, K., Madden, T.L. BLAST+: architecture and applications. BMC Bioinformatics 10, 421-430 (2009).
HHblits
Steinegger, M., Meier, M., Mirdita, M., Vöhringer, H., Haunsberger, S. J., Söding, J. HH-suite3 for fast remote homology detection and deep protein annotation. BMC Bioinformatics 20, 473 (2019).
Uniclust30
Mirdita, M., von den Driesch, L., Galiez, C., Martin, M.J., Söding, J., Steinegger, M. Uniclust databases of clustered and deeply annotated protein sequences and alignments. Nucleic Acids Research 45, D170–D176 (2016).
Contribution
Group: USAFA iGEM 2019
Summary: We have characterized the fluoresence of this part over time and at different temperatures in order to determine optimal incubation conditions and times for best mRFP expression. Our results indicate that 37 degrees C is optimal for both growth and mRFP expression. At 12 hours of incubation at 37C, the RFP was detectable, but after 24 and 48 hours, the expression was much more robust.


Conclusion: BBaE1010 is a strong reporter that has RFP expression that can be detected with a fluorescent plate reader or visualized by the unaided eye. 37C was the optimal growth temperature for E. coli expressing the BBaE1010 mRFP and the expression/detection of the mRFP increased over time with 48 hours showing the most robust red color.
Pre-experiment
E. coli Nissle 1917 strains were grown overnight in Lysogeny Broth (LB) containing ampicilin (100 µg/mL) at 37°C and 200 rpm. Cultures were diluted in fresh LB until achieve 0,1 OD with the corresponding antibiotic and transferred to a 96-well plate (50 µL/well). Samples were always made in triplicates and a blank of LB. During 8h the absorbance at OD600 and fluorescence (excitation 488 nm and emission 530 nm) were measured with intervals of 1 hour.
Contribution
Group: USAFA iGEM 2019
Summary: We have characterized the fluoresence of this part over time and at different temperatures in order to determine optimal incubation conditions and times for best mRFP expression. Our results indicate that 37 degrees C is optimal for both growth and mRFP expression. At 12 hours of incubation at 37C, the RFP was detectable, but after 24 and 48 hours, the expression was much more robust.
Conclusion: BBaE1010 is a strong reporter that has RFP expression that can be detected with a fluorescent plate reader or visualized by the unaided eye. 37C was the optimal growth temperature for E. coli expressing the BBaE1010 mRFP and the expression/detection of the mRFP increased over time with 48 hours showing the most robust red color.
Contribution
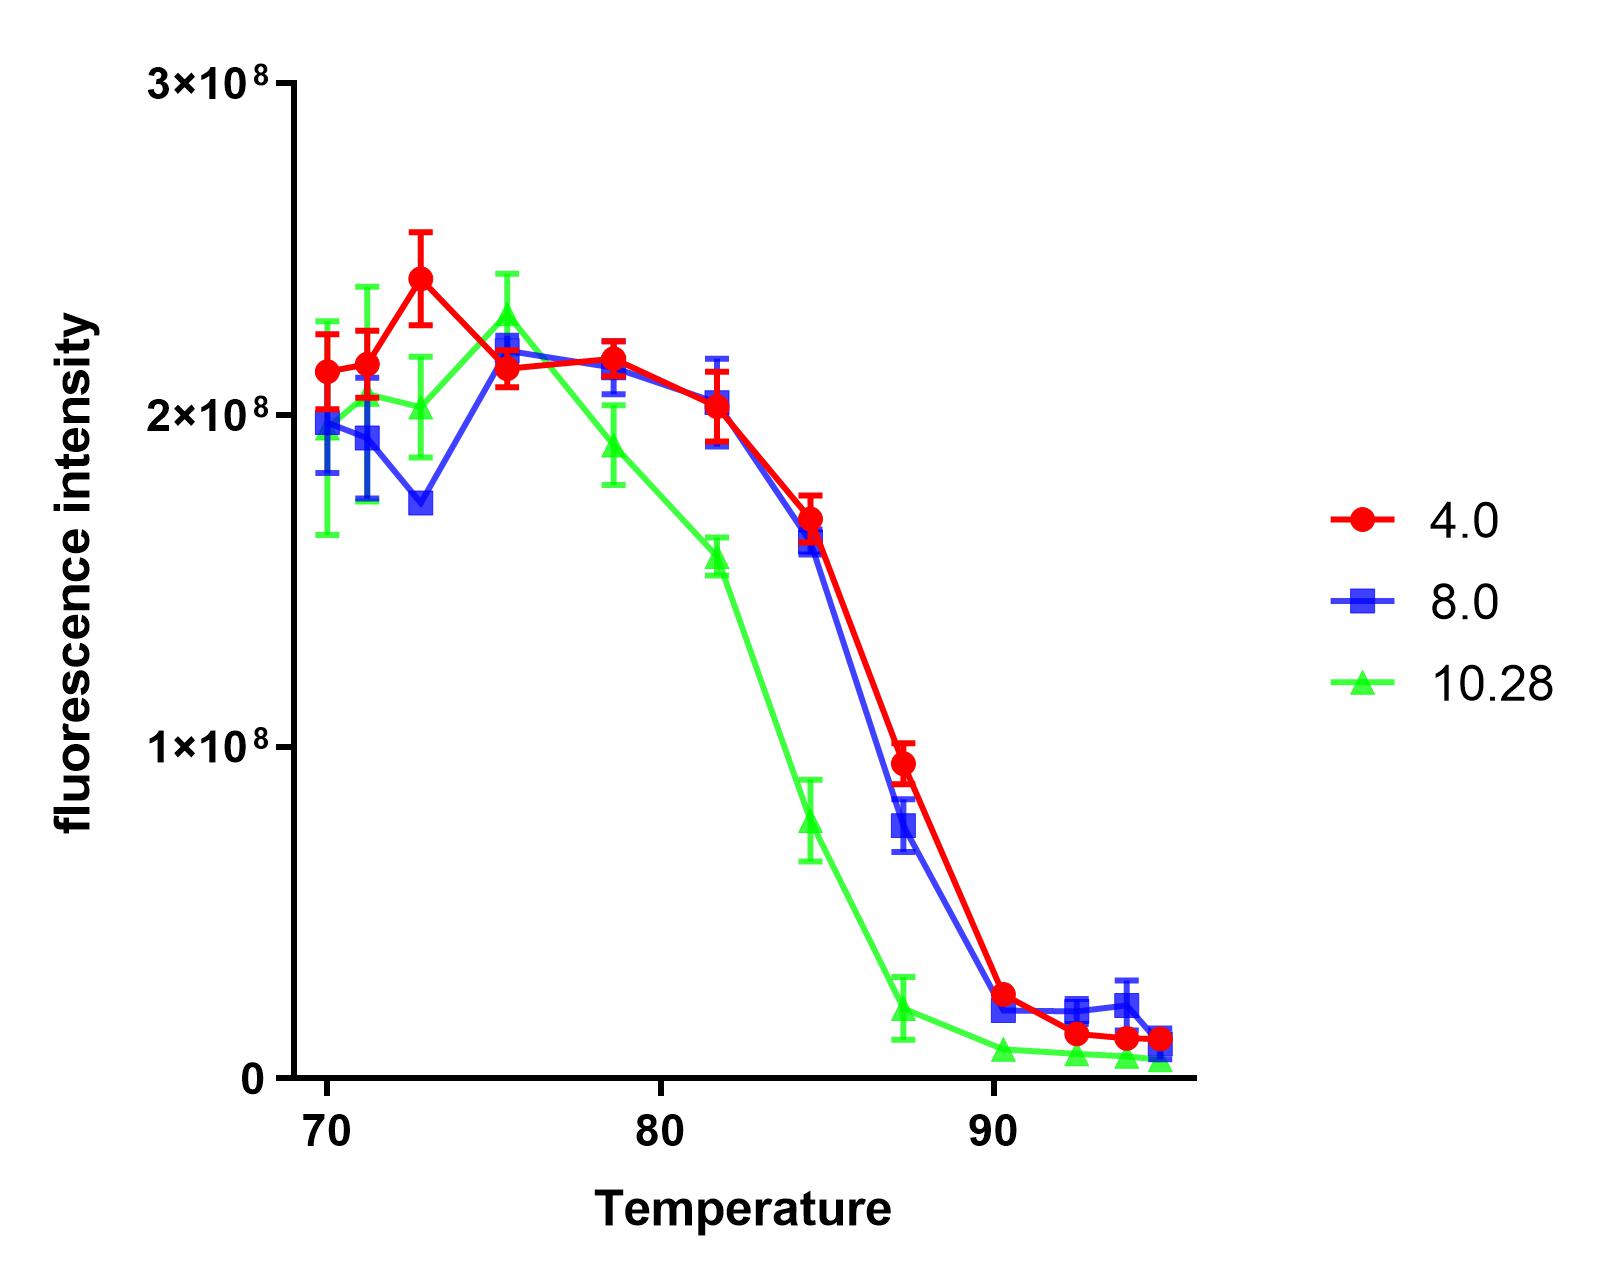
Group:NAU_CHINA 2019
Summary: We measured the fluorescence signal of mRFP in buffer under different pH values and temperatures.
Report genes are essential for every team to construct genetic pathways. We believe that every team has a J04450 complex. After all, it is our favorite report gene!
This year, the NAU iGEM characterized E1010. Based on the work of the previous team work, we explored the tolerance of E1010 expression products at different pH values and temperatures.
Pre-experiment
We dispensed a small amount of the sample into 12 PCR tubes, and a gradient test at 65-95℃ was conducted in a PCR machine for 10 minutes.
We found that the protein samples showed significant denaturation when the temperature was higher than 75℃. So, we set the experimental temperature later at and above 75℃.
The purified sample was dispensed into four PCR tubes and the pH was) adjusted to 4.0, 8.0, 10.28, respectively.
Under each pH value, we dispensed each sample into 12 PCR tubes(50uL sample + 50uL buffer), and a gradient test at 75-95℃ was conducted in a PCR machine for 10 minutes.
We measured the fluorescence intensity of the product under the microplate reader (excitation wavelength was 584 nm, and absorption wavelength was 611 nm).
Analysis
The results show that the product of J04450 begins to show significant denaturation at 84.4℃, and the fluorescence value of the protein no longer changes significantly at the temperature of around 92.5℃, which means E1010 product is completely denatured (shown in our characterization map with a small amount of protein precipitation and the color is pale yellow).
The temperature (from 75.4℃ to 90.3℃) and fluorescence values show a significant linear relationship .
At the same temperature, the pH=4.0 and pH=8.0 curves were basically consistent. The stability of the E1010 expression products at these two pH values was significantly better than that under the condition of pH=10.28.
Discussion
Report genes are required for the construction of most gene pathways. In the future iGEM journey, other teams and we may use some bacteria, like thermophiles, that grow in extreme conditions. We hope we can still use our familiar report gene in these bacteria to detect protein secretion and other related circumstances, so we conducted these tests.
We simulated the extreme environments in which we released the expression products to the extracellular—acid, weak acid, alkaline, and high temperatures—by adjusting the temperature gradients and pH values.
We hope that our experimental results can provide other teams with a reference for the stability of report gene expression products in extreme environments.
Reference
[1] Sudhagar S A , Prasad K P , Makesh M , et al. Characterization and production of polyclonal antisera against pangasius (Pangasianodon hypophthalmus) serum immunoglobulin IgM derived from DEAE cellulose based ion exchange chromatography[J]. Aquaculture Research, 2015, 46(6):1417-1425.
Contribution
Group: Hong_Kong_LFC_PC 2019
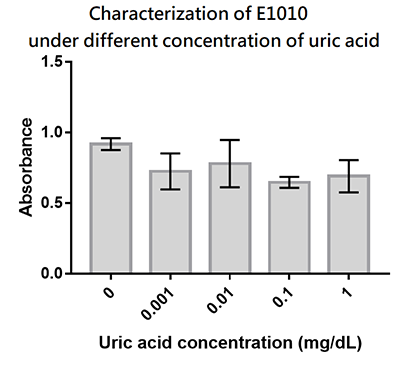
Summary: We designed a uric-acid-sensitive uricase generator for treating the gout disease. Since we will use the fluorescence protein to track the gene expression of the device, we would like to check the effect of uric acid on the signal of this E1010 RFP. Since uric acid can alter the pH value, it may interfere the folding of RFP and lower its fluorescence signal. We treat the extracted RFP with different concentration of uric acid, and found that uric acid has a very little effect on the fluorescence signal. This indicate that our system is possible to track the gene expression.
Contribution
Group: Valencia_UPV iGEM 2018
Author: Adrián Requena Gutiérrez, Carolina Ropero
Summary: We have adapted the part to be able to assemble transcriptional units with the Golden Gate method and we have done the characterization of this protein.
Documentation:
Part BBa_K2656014 is the monomeric Red Fluorescent Protein 1 coding sequence BBa_E1010 adapted into the [http://2018.igem.org/Team:Valencia_UPV/Design Golden Braid assembly method]. Thus, this sequence is both compatible with the BioBrick and GoldenBraid 3.0. grammar.
This coding sequence can be combined with other Golden Braid compatible parts from our [http://2018.igem.org/Team:Valencia_UPV/Part_Collection Valencia UPV IGEM 2018 Printeria Collection] to assemble transcriptional units in a one-step BsaI reaction with the [http://2018.igem.org/Team:Valencia_UPV/Protocols Golden Gate assembly protocol].
The characterization of this protein (and by extension of all the other part that codify for the mRFP1) was performed with our transcriptional unit BBa_K2656109. This transcriptional unit was assembled in a GoldenBraid alpha1 plasmid including the following parts:
- BBa_K2656004: the J23106 promoter in its Golden Braid compatible version from our [http://2018.igem.org/Team:Valencia_UPV/Part_Collection Part Collection]
- BBa_K2656009: the B0030 ribosome biding site in its Golden Braid compatible version from our [http://2018.igem.org/Team:Valencia_UPV/Part_Collection Part Collection]
- BBa_K2656014: coding sequence
- BBa_K2656026: the B0015 transcriptional terminator in its Golden Braid compatible version from our [http://2018.igem.org/Team:Valencia_UPV/Part_Collection Part Collection]
In order to carry out a correct characterization of the protein and to be able to use it to make measurements of the different transcriptional units that we assembled with it, we obtained the emission and excitation spectra in the conditions of our equipment. By using this protocol [http://2018.igem.org/Team:Valencia_UPV/Experiments#spectra] with the parameters of Table 1, Figure 1 was obtained.
| Parameter | Value | ||
| Number of samples | 3 | ||
| Excitation Wavelength measurement range 1 (nm) | [450-620] | ||
| Excitation Wavelength measurement range 2 (nm) | [620-700] | ||
| Emission wavelenght 1 (nm) | 650 | ||
| Emission wavelenght 2 (nm) | 590 | ||
| Emission Wavelength measurement range (nm) | [565-700] | ||
| Excitation wavelenght (nm) | 540 | ||
| Gain (G) | 70 | ||
| Table 1. Parameters used to obtain the spectra | |||

Contribution
Group: Hong Kong-CUHK iGEM 2017
Author: Yuet Ching Lin
Summary: We measured the fluorescent signal of mRFP in buffers with different pH.
Documentation:
Charaterization of mRFP pH stabillity:
We grew C41 bacteria with parts BBa_J61002 in 2XYT for 24 hours. After purifying the mRFP by Ion Exchange Chromatography and Hydrophobic Interaction Chromatography, we measured the fluoresece (ex ,em ) of purified mRFP, which is diluted to 10µg/100µl (total 200µl) in triplicates, into different buffers (ranges from pH2 to pH12; Volume of mRFP:buffer = 1:1.8). To facilitate reproducibility of the experiment, we correlated the relative fluorescent intensity to an absolute fluorophore concentration by referring it to a standard curve of the fluorophores(Rhodamine) using the interlab study protocol. The result shows that the stability drops dramatically in pH condition below 6 and relatively stable in pH 6-10.

| Measurement Type | Fluorescence |
| Microplate name | COSTAR 96 |
| Scan mode | orbital averaging |
| Scan diameter [nm] | 3 |
| Excitation | 550-20 |
| Emission | 605-40 |
| Dichronic filter | auto 572.5 |
| Gain | 500 |
| Focal height [nm] | 9 |
Contribution2
Part name:BBa_K2382013
Group: iGEM17_CSMU_NCHU_Taiwan 2017
Author: SHAO-CHI LO
Summary: We add a His Tag at the end. Therefore, a fusion protein with this part may have red color and the ability to be purified easily.
Documentation:
Sequence and Features
- 10COMPATIBLE WITH RFC[10]
- 12COMPATIBLE WITH RFC[12]
- 21COMPATIBLE WITH RFC[21]
- 23COMPATIBLE WITH RFC[23]
- 25INCOMPATIBLE WITH RFC[25]Illegal AgeI site found at 555
Illegal AgeI site found at 667 - 1000COMPATIBLE WITH RFC[1000]
Parts table
| Protein data table for BioBrick BBa_E1010 automatically created by the BioBrick-AutoAnnotator version 1.0 | ||||||||||||||||||||||||||||||||||||||||||||||
|---|---|---|---|---|---|---|---|---|---|---|---|---|---|---|---|---|---|---|---|---|---|---|---|---|---|---|---|---|---|---|---|---|---|---|---|---|---|---|---|---|---|---|---|---|---|---|
| Nucleotide sequence in RFC 10: (underlined part encodes the protein) ATGGCTTCC ... ACCGGTGCTTAATAACGCTGATAGTGCTAGTGTAGATCGC ORF from nucleotide position 1 to 675 (excluding stop-codon) | ||||||||||||||||||||||||||||||||||||||||||||||
Amino acid sequence: (RFC 25 scars in shown in bold, other sequence features underlined; both given below)
| ||||||||||||||||||||||||||||||||||||||||||||||
Sequence features: (with their position in the amino acid sequence, see the list of supported features)
| ||||||||||||||||||||||||||||||||||||||||||||||
Amino acid composition:
| ||||||||||||||||||||||||||||||||||||||||||||||
Amino acid counting
| Biochemical parameters
| |||||||||||||||||||||||||||||||||||||||||||||
| Plot for hydrophobicity, charge, predicted secondary structure, solvent accessability, transmembrane helices and disulfid bridges | ||||||||||||||||||||||||||||||||||||||||||||||
Codon usage
| ||||||||||||||||||||||||||||||||||||||||||||||
Alignments (obtained from PredictProtein.org)
| ||||||||||||||||||||||||||||||||||||||||||||||
| Predictions (obtained from PredictProtein.org) | ||||||||||||||||||||||||||||||||||||||||||||||
Subcellular Localization (reliability in brackets)
| Gene Ontology (reliability in brackets)
| |||||||||||||||||||||||||||||||||||||||||||||
Predicted features:
| ||||||||||||||||||||||||||||||||||||||||||||||
| The BioBrick-AutoAnnotator was created by TU-Munich 2013 iGEM team. For more information please see the documentation. If you have any questions, comments or suggestions, please leave us a comment. | ||||||||||||||||||||||||||||||||||||||||||||||
Functional Parameters: Austin_UTexas
Burden Imposed by this Part:
Burden is the percent reduction in the growth rate of E. coli cells transformed with a plasmid containing this BioBrick (± values are 95% confidence limits). This BioBrick did not exhibit a burden that was significantly greater than zero (i.e., it appears to have little to no impact on growth). Therefore, users can depend on this part to remain stable for many bacterial cell divisions and in large culture volumes. Refer to any one of the BBa_K3174002 - BBa_K3174007 pages for more information on the methods, an explanation of the sources of burden, and other conclusions from a large-scale measurement project conducted by the 2019 Austin_UTexas team.
This functional parameter was added by the 2020 Austin_UTexas team.
CSMU_Taiwan 2020 Contribution
Group: CSMU iGEM 2020
Author: Huan-Jui Chang, Cheng-Ruei Yang, Hung-Yu Chen
Introduction
This year, our project aims to detect oral cancer. So, we test many reporter proteins at the beginning, one of them is mRFP. To develop an oral cancer detection device, we are curious about how the pH condition in biological samples can affect the expression levels of PURExpress in vitro protein synthesis reactions. We didn't adopt mRFP as our expression protein, but we regard the test about pH effecting on mRFP as helpful information to other teams, so we present it on our wiki.
We use BBa_K199118 1,2 as one of our candidate reporter genes. This part is composed of T7 promoter + RBS + mRFP, which produces red fluorescent protein. We found out that different pH level interferes with the reporter proteins since different pH level could change the folding and structure3,4. Thus, we want to know how pH values affect mRFP. We added mRFP produced in vitro and different pH buffers, including pH 2, pH 5, pH 7, pH8, pH 10, pH12, into a 384-well plate. Then, we measure the excitation and emission spectrum and observe the different characteristics of them.
Method
We expressed mRFP through the addition of T7 terminator on an existing part BBa_K199118 so that the new part (BBa_K3431048) can be expressed through our modified PURExpress in vitro protein synthesis kit (for further inquiries, please refer to our Measurement page). We reproduced the conditions of pH 2, pH 5, pH 7, pH8, pH 10, and pH12 by mixing different chemical compounds in double-distilled water. After expressing mRFP through the kit, we measured its excitation and emission spectra with a Synergy H1 microplate reader. We performed our data analysis and presentation through GraphPad Prism 5. For further interests, the procedures for this experiment can be found at our Protocol page.
Results
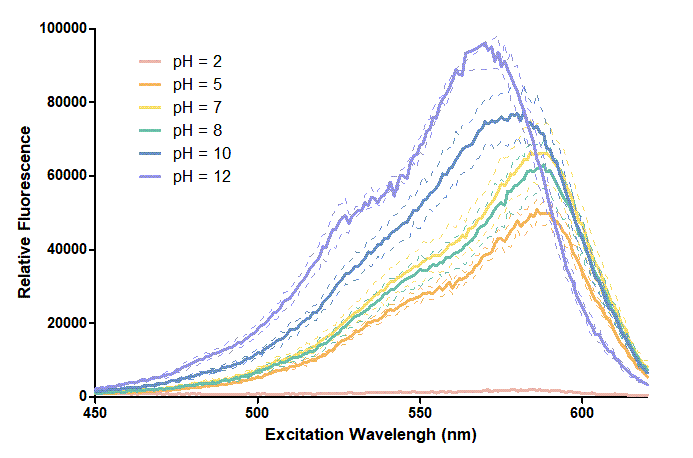
Figure 1. In this graph, we can find that when the pH value drops, the Fluorescent Intensity of mRFP also decreases correspondingly. In pH12, mRFP has the highest Fluorescent Intensity while it approaches zero when pH value becomes value 2. From our result, we could found that mRFP has stronger signals in alkaline environments, and the signal depletes over 50% once the pH value drops below 5.
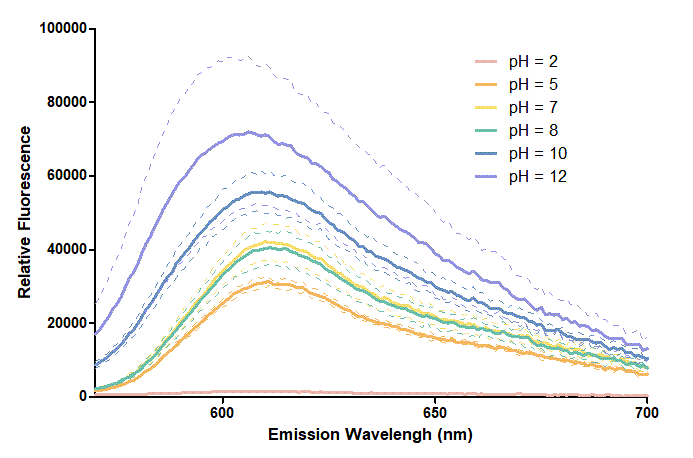
Figure 2. In the emission graph above, we can observe that the trend of fluorescent intensity is similar to the excitation graph. To the peak wavelength, we observe both the excitation graph and emission graph and point out their peak in different pH values. Regardless of pH2 since its intensity is quite weak, there is little difference between each pH value, only the absorbance wavelength of pH12 is lower than other pH values in both graph That is to say, if we want to use mRFP as our final product, we can make an alkaline environment to gain the most obvious results. However, we need to lower our emission and excitation wavelengths when we set up our plate reader.
Reference
1. Battad, J. M., Wilmann, P. G., Olsen, S., Byres, E., Smith, S. C., Dove, S. G., Turcic, K. N., Devenish, R. J., Rossjohn, J., & Prescott, M. (2007). A structural basis for the pH-dependent increase in fluorescence efficiency of chromoproteins. Journal of molecular biology, 368(4), 998–1010. [1](https://doi.org/10.1016/j.jmb.2007.02.007)
2. T7 promoter + RBS + mRFP [2](https://parts.igem.org/Part:BBa_K199118)
3. mRFP[3](https://parts.igem.org/Part:BBa_E1010)
4. Johnson, D. E., Ai, H. W., Wong, P., Young, J. D., Campbell, R. E., & Casey, J. R. (2009). Red fluorescent protein pH biosensor to detect concentrative nucleoside transport. The Journal of biological chemistry, 284(31), 20499–20511. [4](https://doi.org/10.1074/jbc.M109.019042)
Estonia_TUIT 2021 team contribution
Monomeric red fluorescent protein 1 (mRFP1)
mRFP1 is a substantially mutated monomeric form of DsRed, cloned from Discosoma coral (Jach et al., 2006). mRFP1 was derived from the poorly fluorescent dimer T1-I125R of DsRed by applying directed evolution with a combination of targeted and random mutagenesis. mRFP1 is ideal for multicolor imaging in conjunction with GFP as they have minimal spectral overlap. Thus, mRFP1 has almost no emission when excited at wavelengths optimal for GFP, and vice versa. mRFP1 is relatively rapidly maturing, with a maturation time of 60 minutes at 37°C. mRFP1 has low acid sensitivity with its pKa equaling 4.5 (Campbell et al., 2002). Its photostability half-life is 6.2 s and it can be used in both mammalian (HeLa) and bacterial (E. coli) cells (Campbell et al., 2002).

Figure 1. The emission and excitation spectra of mRFP1. (MRFP1 :: Fluorescent Protein Database, 2021). The light orange line corresponds to the absorption spectrum, the dark orange line corresponds to the excitation spectrum, the red line corresponds to the emission spectrum. The excitation maximum of 584 nm, the emission maximum of 607 nm, the extinction coefficient of 50000M-1cm-1 and the quantum yield of 0.25 were recorded.
Confocal microscopy settings for mRFP1 can be found in Table 1 (Imaging Fluorescent Proteins | Nikon’s MicroscopyU).
Table 1. Nikon microscope A1 HD25/A1R HD25 settings for mRFP1 detection.
| Excitation Laser (nm) | Excitation Filter CWL / BW (nm) | Dichromatic Mirror Cut-On (nm) | Barrier Filter CWL / BW (nm) | Relative Brightness (% of EGFP) |
| Diode (594) | 560/55 | 590LP | 630/60 | 37 |
References
- Jach, G., Pesch, M., Richter, K., Frings, S., & Uhrig, J. F. (2006). An improved mRFP1 adds red to bimolecular fluorescence complementation. Nature Methods 2006 3:8, 3(8), 597–600. https://doi.org/10.1038/nmeth901
- Campbell, R. E., Tour, O., Palmer, A. E., Steinbach, P. A., Baird, G. S., Zacharias, D. A., & Tsien, R. Y. (2002). A monomeric red fluorescent protein. Proceedings of the National Academy of Sciences, 99(12), 7877–7882. https://doi.org/10.1073/PNAS.082243699
- mRFP1 :: Fluorescent Protein Database. (n.d.). Retrieved October 15, 2021, from https://www.fpbase.org/protein/mrfp1/
- Imaging Fluorescent Proteins | Nikon’s MicroscopyU. (n.d.). Retrieved October 15, 2021, from https://www.microscopyu.com/techniques/fluorescence/fluorescent-protein-imaging-parameters
//chassis/prokaryote/ecoli
//function/reporter
//function/reporter/fluorescence
//test
| abs | |
| biology | |
| color | Red |
| direction | Forward |
| emission | 607 |
| emit | 607 |
| excitation | 584 |
| excite | 584 |
| kegg | |
| lum | |
| protein | mRFP1 |
| swisspro | |
| tag | None |