
Part:BBa_K199118
T7 promoter + RBS + RFP
T7 Promoter (R0085) + RBS (B0034) + RFP (E1010)
Sequence and Features
- 10COMPATIBLE WITH RFC[10]
- 12COMPATIBLE WITH RFC[12]
- 21COMPATIBLE WITH RFC[21]
- 23COMPATIBLE WITH RFC[23]
- 25INCOMPATIBLE WITH RFC[25]Illegal AgeI site found at 604
Illegal AgeI site found at 716 - 1000COMPATIBLE WITH RFC[1000]
Manchester 2019 Characterisation
Group: Manchester iGEM 2019
Author: Elisa Barrow, Camilo Albornoz
We wanted to add new, normalised RFU data for two promoters from the Anderson family of constitutive promoters BBa_J23102 (Strong constitutive promoter) and BBa_J23106 (weak constitutive promoter) respectively; and a T7 promoter BBa_K199118 all expressing mRFP1. Another interest that we had was to test how OD was affected by RFP production, therefore we performed our measurements twice, at OD600 and OD660 respectively. This was done because it has been shown that OD660 gives a more accurate representation of bacterial growth in RFP-producing bacteria (Hecht et al., 2016).
In order to obtain our results, we grew our cell cultures up to an OD600/660 of ~0.6. After the desired OD had been reached, cultures were induced with IPTG (for BBa_K199118) and anhydrotetracycline (for BBa_K092300). Then they were placed on a microplate reader (CLARIOstar®, BMG Labtech). The specific script conditions can be seen below. The machine was set to measure OD600/660 and RFU overnight every 15 minutes. The data was then analysed and plotted. This experiment was performed both in transformed E. coli DH5a as well as BL21.
OD600:
Discrete wavelengths, 1
Wavelength: 600
Well scan: spiral average, 5mm diameter
OD660:
Discrete wavelengths, 1
Wavelength: 660
Well scan: spiral average, 5mm diameter
RFP Fluorescence:
Focal Height: 7.5
Gain: 1000
Excitation: 574-15
Emission: 618-22
Well scan: Matrix scan 3x3 1mm diameter
RESULTS
Quantitative results:
Below are the results we obtained for the OD and fluorescence measurements of the different promoters with mRFP1. All the values were analysed by blank-correction. For OD, the blank was LB media, and for RFU, the blank was E. coli TOP10 since it does not express any colour. The values were individually normalised by dividing RFU/OD and then averaged to plot the mean against time. An RFU value of 0 corresponds to baseline E. coli TOP10 measurements.
RFU/OD600 values during overnight growth of three different promoters expressing mRFP1 in E. coli DH5⍺:

The plot shows the mean RFU/OD from three replicates of each construct expressed in E. coli DH5⍺. The OD was measured at 600 nm and RFP fluorescence was measured at Ex ƛ 574, Em ƛ 618, every 15 minutes for 13 hours. The RFU values were normalised by the OD and the triplicates averaged. All values have been blank-corrected. A total of 52 recordings were made per well, with three biological/technical replicates per construct.
RFU/OD600 values during overnight growth of three different promoters expressing mRFP1 in E. coli BL21(DE3):

The plot shows the mean RFU/OD from three replicates of each construct expressed in E. coli BL21 (DE3). The OD was measured at 600 nm and RFP fluorescence was measured at Ex ƛ 574, Em ƛ 618, every 15 minutes for 13 hours. The RFU values were normalised by the OD and the triplicates averaged. All values have been blank-corrected. A total of 52 recordings were made per well, with three wells per construct.
RFU/OD660 values during overnight growth of three different promoters expressing mRFP1 in E. coli DH5⍺:

The plot shows the mean RFU/OD from three replicates of each construct expressed in E. coli DH5⍺. The OD was measured at 600 nm and RFP fluorescence was measured at Ex ƛ 574, Em ƛ 618, every 15 minutes for 13 hours. The RFU values were normalised by the OD and the triplicates averaged. All values have been blank-corrected. A total of 52 recordings were made per well, with three wells per construct.
RFU/OD660 values during overnight growth of three different promoters expressing mRFP1 in E. coli BL21(DE3):

The plot shows the mean RFU/OD from three replicates of each construct expressed in E. coli BL21 (DE3). The OD was measured at 600 nm and RFP fluorescence was measured at Ex ƛ 574, Em ƛ 618, every 15 minutes for 13 hours. The RFU values were normalised by the OD and the triplicates averaged. All values have been blank-corrected. A total of 52 recordings were made per well, with three wells per construct.
Qualitative results:
Non-quantitative data of the iGEM-provided coloured constructs were also obtained through pelleting 5 mL of overnight induced culture at 10000 xg for 10 minutes. These pellets were then transferred to 2 mL Eppendorfs and spun at 19, 900 xg in a conventional table-top microcentrifuge and imaged as shown.

5 mL of overnight bacterial culture pellets. In both BBa_J23102 and BBa_J23106 replicates 1 and 2 were transformed into BL21(DE3) (left and centre) while replicate 3 was transformed into DH5⍺ (right). However, for BBa_K199118 all 3 biological replicates are shown in BL21(DE3). All Eppendorfs are shown under normal light (in white) and UV light (blue) for visualisation purposes only. Biological replicates of BL21(DE3) cells for T7 promoter.
These results do not visually show the difference in fluorescence between DH5⍺ and BL21(DE3). However, it is visible particularly for BBa_K199118 the difference in expression between the 3 performed biological replicates.
CONCLUSION
The normalisation of fluorescence measurements to OD showed that the constitutive promoters, as well as the T7 promoter, started with a very high fluorescence-to-OD ratio, which decreased with time and then remained constant. This means that as the bacteria kept growing, the relative fluorescence measurements increased linearly with them. The strong constitutive promoter, BBa_J23102, showed the highest fluorescence-to-OD ratio followed by the weak constitutive promoter J23106 as we would expect and lastly the T7 BBa_K199118 which showed the lowest fluorescence-to-OD values despite possessing the highest plasmid copy number. This was true in both tested E. coli strains DH5⍺ and BL21(DE3). Additionally, this trend remained true in both OD600 as well as OD660 nm.
Data between OD600 and OD660 apparently varies between the two different tested E. coli strains. In DH5⍺, measurements at 600 nm are lower than measurements at 660 nm. Compared to BL21(DE3). Therefore we can conclude that a potential false increase in apparent cell density was only significant for the BL21(DE3) strain and not in the DH5⍺. This means that in our results, measuring optical density at 660 nm was only more appropriate for E. coli BL21(DE3) cells.
In conclusion, new normalised data for mRFP1 fluorescence has been characterised for three existing parts (BBa_J23102, BBa_J23106, and BBa_K199118) and for BBa_K092300 cloned into pBbB2c. This means that the relative fluorescence units can now be compared with higher accuracy and precision across measurements and even between different laboratories.
REFERENCE
Hecht, A., Endy, D., Salit, M. and Munson, M. S. (2016) ‘When Wavelengths Collide: Bias in Cell Abundance Measurements Due to Expressed Fluorescent Proteins’, ACS Synthetic Biology. American Chemical Society, 5(9), pp. 1024–1027. doi: 10.1021/acssynbio.6b00072.
CSMU_Taiwan 2020 Contribution
Group: CSMU iGEM 2020
Author: Huan-Jui Chang, Cheng-Ruei Yang, Hung-Yu Chen
Introduction
This year, our project aims to detect oral cancer. So, we test many reporter proteins at the beginning, one of them is mRFP. To develop an oral cancer detection device, we are curious about how the pH condition in biological samples can affect the expression levels of PURExpress in vitro protein synthesis reactions. We didn't adopt mRFP as our expression protein, but we regard the test about pH effecting on mRFP as helpful information to other teams, so we present it on our wiki.
We use BBa_K199118 1,2 as one of our candidate reporter genes. This part is composed of T7 promoter + RBS + mRFP, which produces red fluorescent protein. We found out that different pH level interferes with the reporter proteins since different pH level could change the folding and structure3,4. Thus, we want to know how pH values affect mRFP. We added mRFP produced in vitro and different pH buffers, including pH 2, pH 5, pH 7, pH8, pH 10, pH12, into a 384-well plate. Then, we measure the excitation and emission spectrum and observe the different characteristics of them.
Method
We expressed mRFP through the addition of T7 terminator on an existing part BBa_K199118 so that the new part (BBa_K3431048) can be expressed through our modified PURExpress in vitro protein synthesis kit (for further inquiries, please refer to our Measurement page). We reproduced the conditions of pH 2, pH 5, pH 7, pH8, pH 10, and pH12 by mixing different chemical compounds in double-distilled water. After expressing mRFP through the kit, we measured its excitation and emission spectra with a Synergy H1 microplate reader. We performed our data analysis and presentation through GraphPad Prism 5. For further interests, the procedures for this experiment can be found at our Protocol page.
Results
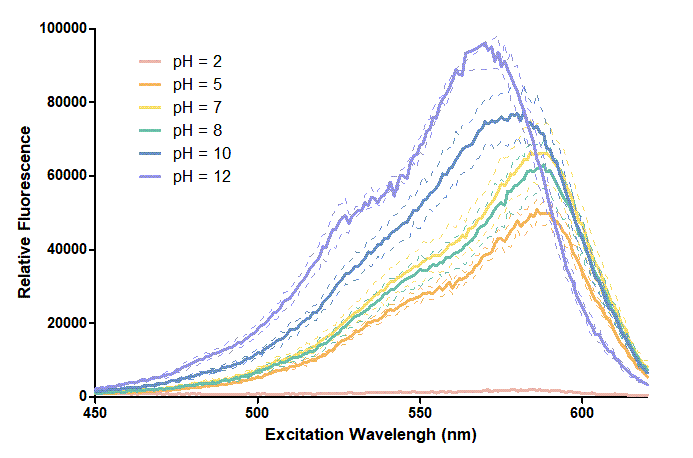
Figure 1. In this graph, we can find that when the pH value drops, the Fluorescent Intensity of mRFP also decreases correspondingly. In pH12, mRFP has the highest Fluorescent Intensity while it approaches zero when pH value becomes value 2. From our result, we could found that mRFP has stronger signals in alkaline environments, and the signal depletes over 50% once the pH value drops below 5.
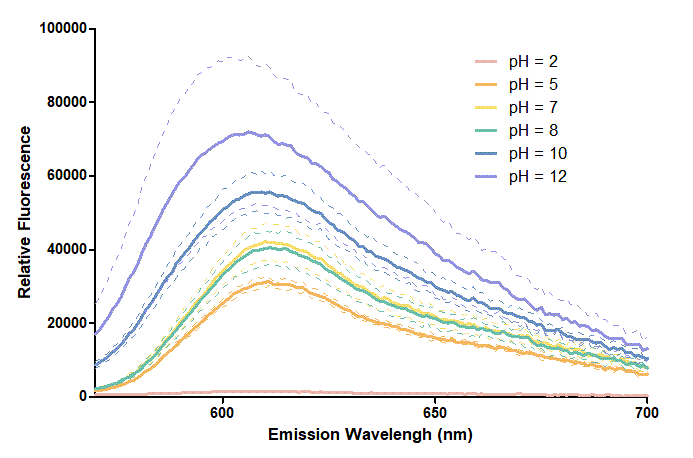
Figure 2. In the emission graph above, we can observe that the trend of fluorescent intensity is similar to the excitation graph. To the peak wavelength, we observe both the excitation graph and emission graph and point out their peak in different pH values. Regardless of pH2 since its intensity is quite weak, there is little difference between each pH value, only the absorbance wavelength of pH12 is lower than other pH values in both graph That is to say, if we want to use mRFP as our final product, we can make an alkaline environment to gain the most obvious results. However, we need to lower our emission and excitation wavelengths when we set up our plate reader.
Reference
1. Battad, J. M., Wilmann, P. G., Olsen, S., Byres, E., Smith, S. C., Dove, S. G., Turcic, K. N., Devenish, R. J., Rossjohn, J., & Prescott, M. (2007). A structural basis for the pH-dependent increase in fluorescence efficiency of chromoproteins. Journal of molecular biology, 368(4), 998–1010. [1](https://doi.org/10.1016/j.jmb.2007.02.007)
2. T7 promoter + RBS + mRFP [2](https://parts.igem.org/Part:BBa_K199118)
3. mRFP[3](https://parts.igem.org/Part:BBa_E1010)
4. Johnson, D. E., Ai, H. W., Wong, P., Young, J. D., Campbell, R. E., & Casey, J. R. (2009). Red fluorescent protein pH biosensor to detect concentrative nucleoside transport. The Journal of biological chemistry, 284(31), 20499–20511. [4](https://doi.org/10.1074/jbc.M109.019042)
| None |