
Part:BBa_K3431048
T7 promoter + RBS + mRFP + T7 terminator
Introduction
To develop an oral cancer detection device, we noticed that the pH conditions in human biological samples are able to affect the expression of reporter protein through influencing folding processes and changing protein structures[1][2]. Consequently, while we were finding a suitable expression protein for our detection device, we tested the effect of different pH conditions on mRFP[3][4] (BBa_E1010), a monomeric red fluorescent protein firstly characterized by Robert E. Campbell et al.. In this experiment, we measured and observed the excitation and emission spectra of mRFP under six pH level, and described the appropriate working and measuring conditions of mRFP.
Method
We expressed mRFP through the addition of T7 terminator on an existing part BBa_K199118 so that this part can be expressed through our modified PURExpress in vitro protein synthesis kit (for further inquiries, please refer to our Measurement page). We reproduced the conditions of pH 2, pH 5, pH 7, pH8, pH 10, and pH12 by mixing different chemical compounds in double-distilled water. After expressing mRFP through the kit, we measured its excitation and emission spectra with a Synergy H1 microplate reader. We performed our data analysis and presentation through GraphPad Prism 5. For further interests, the procedures for this experiment can be found at our Protocol page.
Result
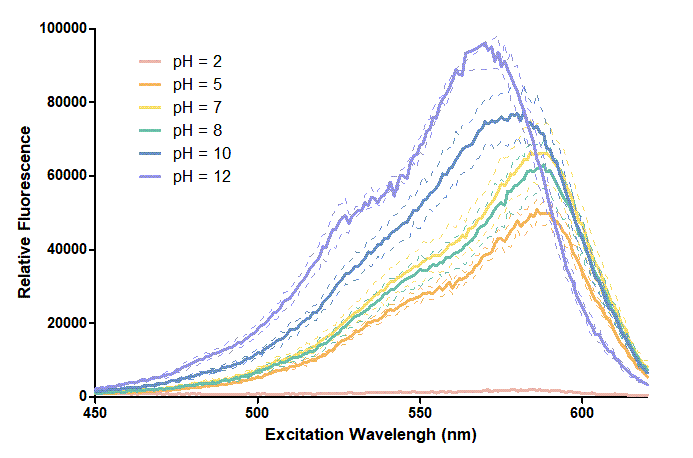
Figure 1. In this graph, we can find that when the pH value drops, the Fluorescent Intensity of mRFP also decreases correspondingly. In pH12, mRFP has the highest Fluorescent Intensity while it approaches zero when pH value becomes value 2. From our result, we could found that mRFP has stronger signals in alkaline environments, and the signal depletes over 50% once the pH value drops below 5.
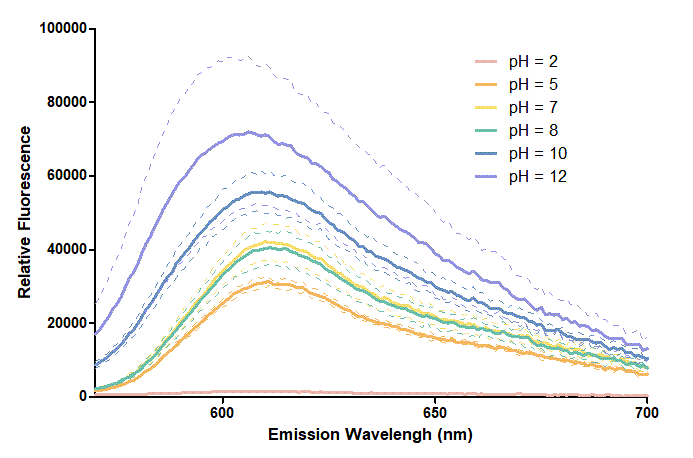
Figure 2. In the emission graph above, we can observe that the trend of fluorescent intensity is similar to the excitation graph. To the peak wavelength, we observe both the excitation graph and emission graph and point out their peak in different pH values. Regardless of pH2 since its intensity is quite weak, there is little difference between each pH value, only the absorbance wavelength of pH12 is lower than other pH values in both graph That is to say, if we want to use mRFP as our final product, we can make an alkaline environment to gain the most obvious results. However, we need to lower our emission and excitation wavelengths when we set up our plate reader.
Conclusion
Through performing excitation and emission spectroscopy on mRFP under different pH levels, we concluded that mRFP performs better while shifting its peak excitation wavelength toward a lower number under alkaline conditions. Since the biological samples for oral cancer detection mainly consist of environments that are not overly alkaline, this characterisation of mRFP is not particularly useful in our project. Nevertheless, the result of our experiment shows that mRFP is more suitable for observation in alkaline conditions with a lower excitation wavelength to reach the best emission result for this fluorescence protein.
Reference
1. Battad, J. M., Wilmann, P. G., Olsen, S., Byres, E., Smith, S. C., Dove, S. G., Turcic, K. N., Devenish, R. J., Rossjohn, J., & Prescott, M. (2007). A structural basis for the pH-dependent increase in fluorescence efficiency of chromoproteins. Journal of molecular biology, 368(4), 998–1010. [1](https://doi.org/10.1016/j.jmb.2007.02.007)
2. Johnson, D. E., Ai, H. W., Wong, P., Young, J. D., Campbell, R. E., & Casey, J. R. (2009). Red fluorescent protein pH biosensor to detect concentrative nucleoside transport. The Journal of biological chemistry, 284(31), 20499–20511. [2](https://doi.org/10.1074/jbc.M109.019042)
3. mRFP[3](https://parts.igem.org/Part:BBa_E1010)
4. T7 promoter + RBS + mRFP [4](https://parts.igem.org/Part:BBa_K199118)
CHARACTERIZATION by MINGDAO IGEM 2022
We retransformed E. coli BL21 with the plasmid of BBa_K3431048. Red colors were clearly seen in LB agar plate and LB liquid culture containing 1mM of IPTG compared to non-IPTG as controls after an overnight culture (Fig. 1A and Fig. 1B).

Figure 1. IPTG induction of RFP expression driven by T7 promoter in E. coli BL21 on LB agar plate (A) or LB broth (B) supplemented with 34 μg/mL of chloramphenicol. IPTG concentration is 1mM.
The transformed E. coli BL21 runs in a kinetic mode for 24 hr in the LB broth with or without IPTG. The RFP levels were read by Synergy H1 Hybrid Multi-Mode Reader - BioTek Instruments (Agilent Technologies, Inc.) at an excitation and emission wavelength of 584 nm and 607 nm, respectively. Regardless of some interfering background values in LB media were detected in the first 3 hours, it’s clear that the T7 promoter activities began to be induced around 2 hours and became significantly strong to a level of 1.5-fold induction compared to the controls without IPTG at 12 hours (Fig. 2). The data were consistent with the results seen by naked eyes (Fig. 1).

Figure 2. The plasmid of T7-RBS-RFP-Tr/pSB1C3 was transferred into E. coli BL21. Two clones were picked up for IPTG induction assay for 18 hr. RFP levels were read every one hour at an ex/em = 584/607.
IMPROVEMENT by MINGDAO IGEM 2022
The new part: Part:BBa_K4150002

From the existing part: Part:BBa_K3431048

In order to increase the expression of protein of interest, we added a canonical strong RBS (Part:BBa_B0034) with a leader sequence with a stem loop from the T7 bacteriophage gene 10 (g10.RBS, Part:BBa_K4150000).

The g10 leader sequence encodes very highly expressed phage proteins, in which 9-base of Epsilon motif exhibits perfect complementary to the 16S RNA of E. coli1. This structure connected with the consensus Shine-Dalgarno sequence (SD) can enhance up to 340-fold heterologous gene expression in E. coli2. The g10 leader sequence is also present in several commercially available pET series vectors.

We replaced the RBS with g10.RBS in BioBrick Part:BBa_K3431048 (T7-RBS-RFP-Tr) to create an improved BioBrick Part:BBa_K4150002 (T7-g10.RBS-RFP-Tr). These two plasmids were transformed into E. coli BL21. In the presence of IPTG, colonies on the LB agar plate and cultures in the LB broth both showed darker red colors for RFP gene expression driven by T7 promoter with g10 leader sequence compared to the original RBS without g10 leader sequence (Fig.1). However, the E. coli BL21 with T7-g10.RBS-RFP-Tr had a higher background level in the absence of IPTG.

Figure 1. The plasmids as indicated were transformed into E. coli BL21. The E. coli were grown on LB agar plate supplemented with 20 μg/mL of chloramphenicol and 1mM of IPTG. One of the colonies was cultured in LB broth with 34 μg/mL of chloramphenicol in the absence or in the presence of 1mM of IPTG. Inset panel: The plates were observed under a blue LED light box.
Furthermore, the transformed E. coli with T7-g10.RBS-RFP-Tr compared to T7-RBS-RFP-Tr expressed RFP at faster and increased (up to 2.5-fold) fluorescence intensity levels in a time-dependent manner (Fig. 2). The above data demonstrated the g10 leader sequence in front of RBS can significantly enhance gene expression.

Figure 2. The plasmids as indicated were transformed into E. coli BL21. The E. coli were grown in LB broth supplemented with 34 μg/mL of chloramphenicol and 1mM of IPTG for 18 hours. The RFP expression levels were read at ex/em = 584/607 nm in a kinetic mode by Synergy H1 Hybrid Multi-Mode Reader - BioTek Instruments (Agilent Technologies, Inc.). The values of fluorescence intensity were presented by the data with IPTG induction minus the data without induction as background levels.
Reference
- Olins PO, Devine CS, Rangwala SH, Kavka KS. The T7 phage gene 10 leader RNA, a ribosome-binding site that dramatically enhances the expression of foreign genes in Escherichia coli. Gene. 1988 Dec 15;73(1):227-35. doi: 10.1016/0378-1119(88)90329-0. PMID: 3072257.
- Asahara H, Magnelli P, Shi X, Tuckey C, Zhou Y, Samuelson JC. Guidelines for nucleic acid template design for optimal cell-free protein synthesis using an Escherichia coli reconstituted system or a lysate-based system. Methods Enzymol. 2021;659:351-369. doi: 10.1016/bs.mie.2021.07.005. Epub 2021 Sep 2. PMID: 34752294.
Sequence and Features
- 10COMPATIBLE WITH RFC[10]
- 12INCOMPATIBLE WITH RFC[12]Illegal NheI site found at 763
- 21COMPATIBLE WITH RFC[21]
- 23COMPATIBLE WITH RFC[23]
- 25INCOMPATIBLE WITH RFC[25]Illegal AgeI site found at 604
Illegal AgeI site found at 716 - 1000COMPATIBLE WITH RFC[1000]
| None |