
Part:BBa_K3174007
Blue Fluorescent Protein with Medium Promoter and Weak RBS
This part has the blue fluorescent protein (mTagBFP) gene inserted downstream of a medium promoter and weak ribosome binding site.
BBa_J23110 is part of the Anderson Series of constitutive promoters designed by iGEM2006_Berkeley.
BBa_B0031 is an RBS based on the Elowitz repressilator and was designed in 2003. Its relative strength was characterized by IIT Madras in 2016 and by Team Warsaw in 2010.
BBa_K592100 is a blue fluorescent protein designed by iGEM11_Uppsala-Sweden in 2011. It has a maximum emission of 456 nm.
In order to visualize the growth rate of these parts, the 5 glycerol stocks were streaked out onto LB + CAM plates and grown in a 37 degree incubator for a period of 24 hours. Fig.1 below shows the results.

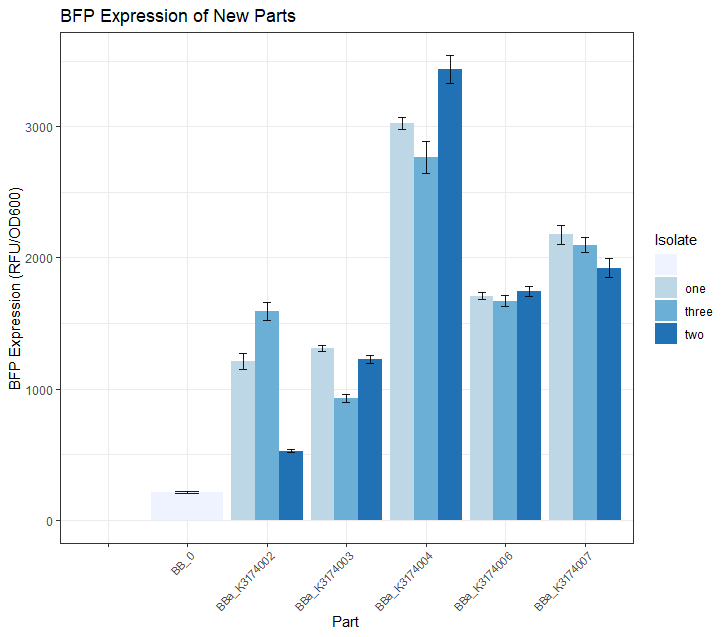
Once we had observed growth rates of each of these 5 parts, we wanted to see if the BFP expression levels matched our expectations based on what we know about the promoter strength of each part. We did this by selecting 3 colonies from each of these 5 plates and growing them in 5mL overnight LB + CAM cultures. We then placed 4 replicates of each isolate into a 96 -well plate (using 200uL of culture for each well) and took a single BFP measurement for each well. The resulting data is depicted in the Fig.2 bar plot below.
We expected BBa_K3174002 and BBa_K3174003 to have the highest BFP expression levels because these parts have the strongest promoter/RBS combinations. Surprisingly, we found that they had the lowest level of BFP expression. We hypothesized that the cells with the intact genetic devices must have been under a high level of metabolic stress, resulting in loss-of-function mutations that contained a 'broken' genetic device (making these cells express lower levels of BFP). The new mutated cells, with their fitness advantage over the highly burdened intact cells, must have then quickly overtaken the population.
We expected BBa_K3174004 to have a BFP expression level that was lower than BBa_K3174002 and BBa_K3174003 but higher than BBa_K3174006 and BBa_K3174007. However, it instead had the highest level of BFP expression out of all 5 parts. This is probably due to the fact that it had a strong enough promoter to cause BFP to be expressed strongly but a weak RBS that prevented considerable stress to the cell. It is important to note that although BBa_K3174004 expressed BFP at the highest level, it lacked consistency between each of the four replicates for each isolate.
BBa_K3174006 and BBa_K3174007 expressed BFP as expected. They had the second and third highest BFP expression levels respectively. Both these parts have relatively weaker promoters that are unlikely to cause burden to the cell. They seemed to have the highest consistency between replicates.
These 5 constructs had their sequences confirmed via Sanger Sequencing.
The major takeaways from this measurement data are:
- BBa_K3174002 and BBa_K3174003 should be used with caution because they break almost immediately due to a high level of metabolic stress to the cell that causes loss of function mutations, leading to a population of cells that no longer express BFP at a high level.
- BBa_K3174004 expresses BFP at the highest level but probably does not have very high stability based on the inconsistency in BFP expression measurements between replicates of each of the three isolates depicted in the bar graph above.
- BBa_K3174006 and BBa_K3174007 express BFP at low levels but appear to be the most stable based on the consistency in BFP expression measurements between replicates of each of the three isolates depicted in the bar graph above. These parts could be useful for experiments that do not require high levels of BFP expression but do rely on evolutionary stability.
Usage and Biology
UT Austin iGEM 2019 Team transformed this part into the E.coli DH10B burden monitor and used it as a standard with which cellular burden could be quantified (by means of a GFP expression vs growth rate model) for other BioBricks that had been similarly transformed into the burden strain. For more information on characterization of these parts through the burden monitor, visit our team’s wiki page: [1]
Sequence and Features
- 10COMPATIBLE WITH RFC[10]
- 12INCOMPATIBLE WITH RFC[12]Illegal NheI site found at 7
Illegal NheI site found at 30 - 21COMPATIBLE WITH RFC[21]
- 23COMPATIBLE WITH RFC[23]
- 25COMPATIBLE WITH RFC[25]
- 1000COMPATIBLE WITH RFC[1000]
Characterization: Austin_UTexas
The 2019 Austin_UTexas team used a standardized method to measure the burden for hundreds of BioBricks in the registry. We transformed 304 iGEM BioBricks into E. coli cells and measured the maximum growth rates of the resulting strains by monitoring OD600 in a microplate reader. We then performed a procedure to normalize measurements between different assays to produce the final burden values that are on the individual BioBrick pages. The burden values are reported as the mean percent reduction in growth rate ± 95% confidence intervals. The statistical significance of whether each BioBrick exhibited burden greater than zero was judged by determining whether p ≤ 0.5 for one-tailed t-tests with the Benjamini-Hochberg correction for mutliple testing at a false discovery rate (FDR) or 5%.
When a part is burdensome, mutations that alleviate this burden, usually by deleting or otherwise inactivating the BioBrick sequence, have a fitness advantage. Cells with these mutations can arise rapidly in bacterial populations and outcompete those that have the original, functional plasmid, leading to a rapid loss of BioBrick function within the cell population. Using a stochastic population genetic model of mutation and competition we can predict the evolutionary stability of a BioBrick from its burden value. For instance, we found that, at a failure mutation rate of 10–5, parts with a burden of 40% will be unstable even in small test-tube cultures of a few mL. Parts with >40% burden are likely to be mostly 'broken' in even these small cultures, essentially rendering them unclonable. Parts with 20-40% burden are likely to become mostly broken during the larger number of cell divisions needed to saturate larger cultures (2L volumes and higher) but are predicted to be stable enough to use reliably in smaller 5 mL lab cultures. We have posted an interactive version of this model online that can be used to explore how burden, mutation rates, and culture scale affect the risk of evolutionary failure.
Of the 299 BioBricks that were measured, 61 of them imposed a significant burden on E. coli. The five BFP BioBricks that we created and used as controls (BBa_K3174002, BBa_K3174003, BBa_K3174004, BBa_K3174006, BBa_K3174007) also significantly reduced E. coli growth rates. The BioBrick pages for every measured part (including the “no burden” parts) have been updated to reflect their burden values.
These functional parameters were added by the 2020 Austin_UTexas team.
Links for methods, data, and resources:
Functional Parameters
Functional Parameters: Austin_UTexas
Burden Imposed by this Part:

Burden is the percent reduction in the growth rate of E. coli cells transformed with a plasmid containing this BioBrick (± values are 95% confidence limits). This part exhibited a significant burden. Users should be aware that BioBricks with a burden of >20-30% may be susceptible to mutating to become less functional or nonfunctional as an evolutionary consequence of this fitness cost. This risk increases as they used for more bacterial cell divisions or in larger cultures. Users should be especially careful when combining multiple burdensome parts, as plasmids with a total burden of >40% are expected to mutate so quickly that they become unclonable. Refer to any one of the BBa_K3174002 - BBa_K3174007 pages for more information on the methods and other conclusions from a large-scale measurement project conducted by the 2019 Austin_UTexas team.
This functional parameter was added by the 2020 Austin_UTexas team.
| None |