
 1 Registry Star
Part:BBa_J23106
constitutive promoter family member
|
|
Variant RFP (au) J23112 1 J23103 17 J23113 21 J23109 106 J23117 162 J23114 256 J23115 387 J23116 396 J23105 623 J23110 844 J23107 908 J23106 1185 J23108 1303 J23118 1429 J23111 1487 J23101 1791 J23104 1831 J23102 2179 J23100 2547 |


Constitutive promoter family
Parts J23100 through J23119 are a family of constitutive promoter parts isolated from a small combinatorial library. J23119 is the "consensus" promoter sequence and the strongest member of the family. All parts except J23119 are present in plasmid J61002. Part J23119 is present in pSB1A2. This places the RFP downstream of the promoter. Reported activities of the promoters are given as the relative fluorescence of these plasmids in strain TG1 grown in LB media to saturation. See part BBa_J61002 for details on their use.
These promoter parts can be used to tune the expression level of constitutively expressed parts. The NheI and AvrII restriction sites present within these promoter parts make them a scaffold for further modification. JCAraw
Jasonk:I suspect that J23102 is in this well rather than J23106, I'd sequence it before using.
Usage and Biology
St Andrews 2018's Characterization
Comparison of the Strength of BBa_J23106 against BBa_J23100
The promoter we assessed was cloned via Gibson Assembly into the pSB1C3 backbone alongside an mNeongreen fluorophore as a reporter. This plasmid was then transformed into DH5alpha super-competent E. coli cells, and the fluorescence and absorbance recorded over the course of 142 hours. The data points were then fitted to a hyperbolic trend line to demonstrate the increase in fluorescence over time. This correlates to the increasing quantity of protein generated, which is directly tied to the strength of the promoter attached.
These studies were done in both LB and M9 media to compare the rate of fluorescence in translucent vs. a transparent medium. As predicted, the M9 medium gave much more reliable results. Below are graphs demonstrating the level of fluorescence generated by the proteins attached to this promoter. It was also compared to the fluorescence generated by a Red Fluorescent Protein (RFP), for some idea of context. A more useful comparison can be made from the graph of concentration, which was derived from the absorbance of each sample. The Red Fluorescent Protein was synthesized using the promoter BBa_J23100, and so the difference in the concentration between the two indicates the relative strengths of the BBa_J23100 and BBa_J23106 promoters. It’s evident that the BBa_J23100 promoter is much stronger than the BBa_J23106 part, producing roughly 13x more RFP than the BBa_J23100 made of the mNeonGreen.
 This graph depicts the difference in fluorescence between the mNeonGreen generated by the BBa_J23106 promoter and the RFP generated by the BBa_J23100 at a wavelength of 650 nm. This study was carried out in transparent M9 media.
 This graph depicts the difference in fluorescence between the mNeonGreen generated by the BBa_J23106 promoter and the RFP generated by the BBa_J23100 at a wavelength of 515 nm. This study was carried out in transparent M9 media.
 This graph depicts the difference in fluorescence between the mNeonGreen generated by the BBa_J23106 promoter and the RFP generated by the BBa_J23100 at a wavelength of 650 nm. This study was carried out in brown LB media.
 This graph depicts the difference in fluorescence between the mNeonGreen generated by the BBa_J23106 promoter and the RFP generated by the BBa_J23100 at a wavelength of 515 nm. This study was carried out in brown LB media.
 This graph shows the concentration of protein derived from the absorbance and the extinction coefficient of each respective fluorophore.
Sheffield 2016's Characterisation
Measured strength
Sheffield 2016 has improved the characterisation of both BBa_J23100 and BBa_J23106. These parts are a strong and medium promoter respectively, that we have used to design our iron detecting device. We have experimentally validated through fluorimetry that there is indeed a significant difference between expression levels of GFP coupled to the strong and medium promoters. Comparative analysis of promoter strengths can be directly interpreted from the data we obtained. This data can be found both on the original part experience pages of BBa_J23100 and BBa_J23106, as well as on our website.

Fluorescence of JC28 mutants or W3110 wild types transformed with RyhB-GFP constructs under the control of medium (MedGFP) or strong promoters (StrGFP).
Determination of Noise Levels in Constitutive Promoter Family Members
(characterized by SDU-Denmark 2017)
Fluorescence microscopy and flow cytometry revealed decrease in fluorescence over time for members of the constitutive promoter family.
The expression levels and the noise of four different members of the Anderson promoter collection and their RFP reporter systems, were studied by fluorescence microscopy. These were, in increasing promoter strength, BBa_J23114, BBa_J23110, BBa_J23106, and BBa_J23102
Additionally, the change in RFP expression levels and noise during growth were tested for the promoters with the highest and lowest relative promoter strength by flow cytometry and qualitative analysis by fluorescence microscopy. Combining these two techniques, the expression and noise levels for the promoters were determined as follows:
- The weak promoter, BBa_J23114, exhibited a relatively low expression of RFP, indicating low gene expression and an increasing high level of noise throughout growth.
- Both medium strength promoters, BBa_J23110 and BBa_J23106, displayed a moderate level of both noise and protein expression of the RFP reporter.
- The strong promoter, BBa_J23102, exhibited a comparatively high expression of the reporter RFP and an increasing high level of noise throughout growth.

Sequence and Features
- 10COMPATIBLE WITH RFC[10]
- 12INCOMPATIBLE WITH RFC[12]Illegal NheI site found at 7
Illegal NheI site found at 30 - 21COMPATIBLE WITH RFC[21]
- 23COMPATIBLE WITH RFC[23]
- 25COMPATIBLE WITH RFC[25]
- 1000COMPATIBLE WITH RFC[1000]
Functional Parameters
Relative promoter strength estimates (see [http://2009.igem.org/Team:Groningen/Promoters this page] from Groningen 2009):
| Reference | Strength |
|---|---|
| BBa_J23100 | 0.49 |
| BBa_J23109 | 33 |
Contribution
Group: Valencia_UPV iGEM 2018
Author: Adrián Requena Gutiérrez, Carolina Ropero
Summary: We adapted the part to be able to assemble transcriptional units with the Golden Gate assembly method
Documentation:
In order to create our complete [http://2018.igem.org/Team:Valencia_UPV/Part_Collection part collection] of parts compatible with the Golden Gate assembly method, we made the part BBa_K2656004 which is this part adapted to the Golden Gate technology.
>Internal Priming Screening Characterization of BBa_J23106: Has no possible internal priming sites between this BioBrick part and the VF2 or the VR primer.
The 2018 Hawaii iGEM team evaluated the 40 most frequently used BioBricks and ran them through an internal priming screening process that we developed using the BLAST program tool. Out of the 40 BioBricks we evaluated, 10 of them showed possible internal priming of either the VF2 or VR primers and sometime even both. The data set has a range of sequence lengths from as small as 12 bases to as large as 1,210 bases. We experienced the issue of possible internal priming during the sequence verification process of our own BBa_K2574001 BioBrick and in the cloning process to express the part as a fusion protein. BBa_K2574001 is a composite part containing a VLP forming Gag protein sequence attached to a frequently used RFP part (BBa_E1010). We conducted a PCR amplification of the Gag-RFP insert using the VF2 and VR primers on the ligation product (pSB1C3 ligated to the Gag + RFP). This amplicon would serve as template for another PCR where we would add the NcoI and BamHI restriction enzyme sites through new primers for ligation into pET14b and subsequent induced expression. Despite gel confirming a rather large, approximately 2.1 kb insert band, our sequencing results with the VR primer and BamHI RFP reverse primer gave mixed results. Both should have displayed the end of the RFP, but the VR primer revealed the end of the Gag. Analysis of the VR primer on the Gag-RFP sequence revealed several sites where the VR primer could have annealed with ~9 - 12 bp of complementarity. Internal priming of forward and reverse primers can be detrimental to an iGEM project because you can never be sure if the desired construct was correctly inserted into the BioBrick plasmid without a successful sequence verification.
Thessaly 2019 Characterization
Thessaly 2019 sought to characterize the coding sequence of TEM-optimized β-lactamase (BBa_I757010) under the regulation of the constituve Anderson Family promoters BBa_J23100, BBa_J23105, BBa_J23106, BBa_J23119. β-lactamase is an enzyme that hydrolyses β-lactams (e.g. ampicillin) and is naturally found in prokaryotic cells. A colorimetric assay has been developed using nitrocefin as a substrate which after hydrolysis from β-lactamase changes the reaction color, from yellow (380nm) to red (490nm).
To achieve that, the coding sequence was assembled with each promoter, a universal RBS (BBa_B0034) and a double terminator(BBa_B0015). The parts were cloned in pSB1C3 and pSB1K3 and transformed into E. coli DH5a competent cells.
In the photo below you can see the results of the primer addition using overhang PCR:
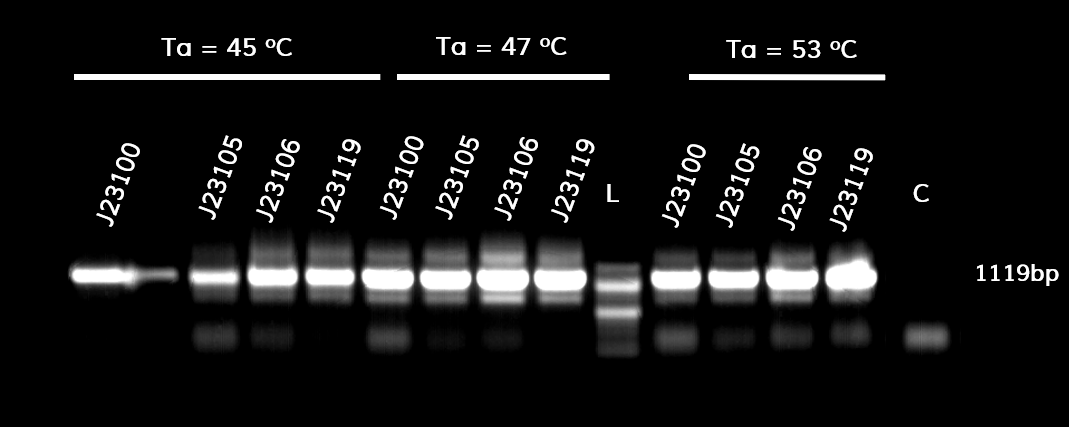
Figure 1. The results obtained after the PCR with the overhang primers for the different promoters of the Anderson family. We tested different annealing temperatures (45, 47 & 53℃) aiming for clear results. The expected band is at 1119bp and the ladder used was the 100bp DNA ladder by NEB.
For protein expression, the plasmids were transformed into E. coli BL21 (DE3) competent cells.
For the beta-lactamase assay, we set up the following experimental design:
1. Grow BL21 (DE3) pre-culture overnight in 5ml LB (~16h) at a shaking incubator, 37 degrees C / 210rpm
2. The following morning, measure the OD600 of overnight cultures
3. Dilute all cultures to OD600¬ = 0.05 in M9 minimal medium
4. Grow cells 37 degrees C /210 RPM until OD600=0.4-0.6 (~2h)
5. Dilute all cells to the same OD600 (e.g. 0.4)
6. Load 160 of culture in a 96-well plate (do triplicates). Add 40 ul 0.5 uM nitrocefin for a final concentration of 100nM
7. Measure the absorbance at 490nm (for nitrocefin hydrolysis) and 600nm (for cell growth) every 30 seconds for 2 hours in a microplate reader. Shake between readings. Because plateau was reached within the first 30 minutes of the reaction, only those are depicted in the graph.
To ensure that the absorbance shown corresponds only to enzymatic activity by β-lactamase, we included 3 controls in the experiment. The first control has M9 medium only (no cells) and nitrocefin, the second has empty BL21 (DE3) cells (no plasmid) and nitrocefin, while the third has BL21 (DE3) cells containing the plasmid but not the part (empty plasmid). To obtain comparable results, we normalized all values by dividing OD490 by OD600.
The results are shown in the graph below

Figure 2. The hydrolysis of nitrocefin enabled by the expression of the β-lactamase gene, under the control of different promoters (J23100, J23105, J23106 & J23119) of the Anderson family. The substrate (nitrocefin) hydrolysis (490nm) is divided by cell growth (600nm), in order to normalize all values.
The maximum expression of β-lactamase was observed under control of the J23119 (brown line) which is the wild type promoter of the Anderson family. The expression is reduced with the J23100 and J23106 (yellow and purple line respectively), while the lowest expression levels were observed with the J23105 promoter (blue line). These results are in accordance with those from previous teams that measured fluorescence and the same pattern is observed. The controls conditions (pSB1C3 and BL21, or light purple and light blue respectively) confirm that the absorbance measured derives from β-lactamase activity only, both quantitatively and visually.
Below you can see the 96-well plate of the assay:

Figure 3.The observed color change due to the hydrolyzation of nitrocefin due to the production of β-lactamase, after a 2-hour enzymatic assay.
Note that the picture was taken after the plate-reader assay was completed and all conditions had reached a plateau, except the controls.
XJTU-CHINA 2019 Characterization
2019 team XJTU-CHINA's characterization
XJTU-CHINA 2019 employed pJ23106 as a constitutive promoter of a photosensitive protein -- Cph8 (BBa_K2598006) which is the key part of our light-control system, so we plan to quantitatively characterize this promoter BBa_J23106 in order to acquire parameters in realistic conditions which can be used in modelling. We use part BBa_K1819006, which is consist of GFP (BBa_K1819000) and its promoter J23106. We have experimentally validated this part in three different chassis of E. coli : DH5α, S17-7 and BL21.
For the J23106 strength assay, we set up the following protocol:
Day1: Transform pSB1K3-K1819006 into Escherichia coli DH5α, S17-7 and BL21 respectively.
Day2: Inoculate the transformants in 5-10 mL LB medium with chloramphenicol (25 ug/ml) which was cultured for 12h.
Day3:
1. Inoculate the recombinant 1% of E.coli into fresh LB medium with chloramphenicol, and culture at 37℃,200 rpm
2. Measure OD600 and GFP fluorescent intensity (RFU) of the bacteria every 2 hours using 200 ul of the culture broth with six parallel groups.
3. We will test (1) OD600, (2) GFP intensity with ex is fixed at 505nm and em is fixed at 515nm
The results are as follows:

As shown in Fig 1, all the three E. coli experienced the basic cell growth of very short lag phase, fast log phase and quite long stationary phase during 60-h cultivation. OD600 of all three strains basically reached stability after about 14h cultivation, and it is clearly showed that BL21 had the most vigorous growth, S17-1 the second, while DH5α had the slowest growth, but there was no significant difference between these three, in case of lab-scale cultivation.

The GFP intensity changes per cell were also be compared between these three strains, which shared the similar trends with cell growth. The GFP intensity per cell turned to be stable after about 12h cultivation. And recombinant S17-1 exhibited highest intensity among three strains, while BL21 is the least, indicating S17-1 somehow could be a better host for the measurement of this GFP-harboring parts based on our results.
Manchester 2019 Characterisation
Group: Manchester iGEM 2019
Author: Elisa Barrow, Camilo Albornoz
We wanted to add new, normalised RFU data for two promoters from the Anderson family of constitutive promoters BBa_J23102 (Strong constitutive promoter) and BBa_J23106 (weak constitutive promoter) respectively; and a T7 promoter BBa_K199118 all expressing mRFP1. Another interest that we had was to test how OD was affected by RFP production, therefore we performed our measurements twice, at OD600 and OD660 respectively. This was done because it has been shown that OD660 gives a more accurate representation of bacterial growth in RFP-producing bacteria (Hecht et al., 2016).
In order to obtain our results, we grew our cell cultures up to an OD600/660 of ~0.6. After the desired OD had been reached, cultures were induced with IPTG (for BBa_K199118) and anhydrotetracycline (for BBa_K092300). Then they were placed on a microplate reader (CLARIOstar®, BMG Labtech). The specific script conditions can be seen below. The machine was set to measure OD600/660 and RFU overnight every 15 minutes. The data was then analysed and plotted. This experiment was performed both in transformed E. coli DH5a as well as BL21.
OD600:
Discrete wavelengths, 1
Wavelength: 600
Well scan: spiral average, 5mm diameter
OD660:
Discrete wavelengths, 1
Wavelength: 660
Well scan: spiral average, 5mm diameter
RFP Fluorescence:
Focal Height: 7.5
Gain: 1000
Excitation: 574-15
Emission: 618-22
Well scan: Matrix scan 3x3 1mm diameter
RESULTS
Quantitative results:
Below are the results we obtained for the OD and fluorescence measurements of the different promoters with mRFP1. All the values were analysed by blank-correction. For OD, the blank was LB media, and for RFU, the blank was E. coli TOP10 since it does not express any colour. The values were individually normalised by dividing RFU/OD and then averaged to plot the mean against time. An RFU value of 0 corresponds to baseline E. coli TOP10 measurements.
RFU/OD600 values during overnight growth of three different promoters expressing mRFP1 in E. coli DH5⍺:

The plot shows the mean RFU/OD from three replicates of each construct expressed in E. coli DH5⍺. The OD was measured at 600 nm and RFP fluorescence was measured at Ex ƛ 574, Em ƛ 618, every 15 minutes for 13 hours. The RFU values were normalised by the OD and the triplicates averaged. All values have been blank-corrected. A total of 52 recordings were made per well, with three biological/technical replicates per construct.
RFU/OD600 values during overnight growth of three different promoters expressing mRFP1 in E. coli BL21(DE3):

The plot shows the mean RFU/OD from three replicates of each construct expressed in E. coli BL21 (DE3). The OD was measured at 600 nm and RFP fluorescence was measured at Ex ƛ 574, Em ƛ 618, every 15 minutes for 13 hours. The RFU values were normalised by the OD and the triplicates averaged. All values have been blank-corrected. A total of 52 recordings were made per well, with three wells per construct.
RFU/OD660 values during overnight growth of three different promoters expressing mRFP1 in E. coli DH5⍺:

The plot shows the mean RFU/OD from three replicates of each construct expressed in E. coli DH5⍺. The OD was measured at 600 nm and RFP fluorescence was measured at Ex ƛ 574, Em ƛ 618, every 15 minutes for 13 hours. The RFU values were normalised by the OD and the triplicates averaged. All values have been blank-corrected. A total of 52 recordings were made per well, with three wells per construct.
RFU/OD660 values during overnight growth of three different promoters expressing mRFP1 in E. coli BL21(DE3):

The plot shows the mean RFU/OD from three replicates of each construct expressed in E. coli BL21 (DE3). The OD was measured at 600 nm and RFP fluorescence was measured at Ex ƛ 574, Em ƛ 618, every 15 minutes for 13 hours. The RFU values were normalised by the OD and the triplicates averaged. All values have been blank-corrected. A total of 52 recordings were made per well, with three wells per construct.
Qualitative results:
Non-quantitative data of the iGEM-provided coloured constructs were also obtained through pelleting 5 mL of overnight induced culture at 10000 xg for 10 minutes. These pellets were then transferred to 2 mL Eppendorfs and spun at 19, 900 xg in a conventional table-top microcentrifuge and imaged as shown.

5 mL of overnight bacterial culture pellets. In both BBa_J23102 and BBa_J23106 replicates 1 and 2 were transformed into BL21(DE3) (left and centre) while replicate 3 was transformed into DH5⍺ (right). However, for BBa_K199118 all 3 biological replicates are shown in BL21(DE3). All Eppendorfs are shown under normal light (in white) and UV light (blue) for visualisation purposes only. Biological replicates of BL21(DE3) cells for T7 promoter.
These results do not visually show the difference in fluorescence between DH5⍺ and BL21(DE3). However, it is visible particularly for BBa_K199118 the difference in expression between the 3 performed biological replicates.
CONCLUSION
The normalisation of fluorescence measurements to OD showed that the constitutive promoters, as well as the T7 promoter, started with a very high fluorescence-to-OD ratio, which decreased with time and then remained constant. This means that as the bacteria kept growing, the relative fluorescence measurements increased linearly with them. The strong constitutive promoter, BBa_J23102, showed the highest fluorescence-to-OD ratio followed by the weak constitutive promoter J23106 as we would expect and lastly the T7 BBa_K199118 which showed the lowest fluorescence-to-OD values despite possessing the highest plasmid copy number. This was true in both tested E. coli strains DH5⍺ and BL21(DE3). Additionally, this trend remained true in both OD600 as well as OD660 nm.
Data between OD600 and OD660 apparently varies between the two different tested E. coli strains. In DH5⍺, measurements at 600 nm are lower than measurements at 660 nm. Compared to BL21(DE3). Therefore we can conclude that a potential false increase in apparent cell density was only significant for the BL21(DE3) strain and not in the DH5⍺. This means that in our results, measuring optical density at 660 nm was only more appropriate for E. coli BL21(DE3) cells.
In conclusion, new normalised data for mRFP1 fluorescence has been characterised for three existing parts (BBa_J23102, BBa_J23106, and BBa_K199118) and for BBa_K092300 cloned into pBbB2c. This means that the relative fluorescence units can now be compared with higher accuracy and precision across measurements and even between different laboratories.
REFERENCE
Hecht, A., Endy, D., Salit, M. and Munson, M. S. (2016) ‘When Wavelengths Collide: Bias in Cell Abundance Measurements Due to Expressed Fluorescent Proteins’, ACS Synthetic Biology. American Chemical Society, 5(9), pp. 1024–1027. doi: 10.1021/acssynbio.6b00072.
|
•••••
University of Texas at Austin iGEM 2019 |
UT Austin iGEM 2019: Characterization of metabolic burden of the Anderson SeriesDescriptionThe 2019 UT Austin iGEM team transformed the Anderson Series promoters into our 'burden monitor' DH10B strain of E. coli, which contains a constitutive GFP cassette in the genome of the cell. GFP expression fluctuates depending on the number of ribosomes available. Using this strain, we characterized the relative burden (percent reduction in growth rate) of each Anderson Series part. Our results showed a range of growth rate reductions for each of these parts due to ribosomal reallocation from the genome of the host cell, towards the expression of RFP. Anderson Series parts with strong promoters are depicted with darker red colors and Anderson Series parts with weak promoters are depicted with lighter pink colors to show relative RFP expression. We saw a positive correlation between relative promoter strength and metabolic burden; parts with stronger promoters expressed less GFP and had a lower growth rate than parts with weaker promoters. The regression line for the graph below was constructed by measuring the burden of 5 parts that were created by the 2019 UT Austin iGEM team that each contained an Anderson Series promoter (BBa_J23104 or BBa_J23110), an RBS of varying strength, and a BFP reporter. For more information on characterization of these parts through the burden monitor, visit our team’s wiki page: [1]
Importance of Characterizing BurdenAlthough often we cannot avoid using a specific burdensome part, knowing in advance that it is burdensome, and that it has a high chance of mutating into a non-functional genetic device, can help with troubleshooting and coming up with alternatives. In the specific case of fluorescent protein-expressing devices, Fluorescence-activated cell sorting (FACS) can be used to filter out individual cells that meet a certain fluorescence threshold. This way, the cells expressing lower levels of the fluorescent protein are weeded out of the population. |


//direction/forward
//promoter/anderson
//regulation/constitutive
//rnap/prokaryote/ecoli/sigma70
| negative_regulators | |
| positive_regulators |