
 1 Registry Star
Part:BBa_J23100
constitutive promoter family member . For video explanation on this promoter family and its use, see [http://www.synbiotrails.org/#!/trail?id=org.clothocad.trails.youtube.TranscriptionModels this].
|
|
Variant RFP (au) J23112 1 J23103 17 J23113 21 J23109 106 J23117 162 J23114 256 J23115 387 J23116 396 J23105 623 J23110 844 J23107 908 J23106 1185 J23108 1303 J23118 1429 J23111 1487 J23101 1791 J23104 1831 J23102 2179 J23100 2547 |


Constitutive promoter family
Parts J23100 through J23119 are a family of constitutive promoter parts isolated from a small combinatorial library. J23119 is the "consensus" promoter sequence and the strongest member of the family. All parts except J23119 are present in plasmid J61002. Part J23119 is present in pSB1A2. This places the RFP downstream of the promoter. Reported activities of the promoters are given as the relative fluorescence of these plasmids in strain TG1 grown in LB media to saturation. See part BBa_J61002 for details on their use.
These promoter parts can be used to tune the expression level of constitutively expressed parts. The NheI and AvrII restriction sites present within these promoter parts make them a scaffold for further modification. JCAraw
Sequence and Features
- 10COMPATIBLE WITH RFC[10]
- 12INCOMPATIBLE WITH RFC[12]Illegal NheI site found at 7
Illegal NheI site found at 30 - 21COMPATIBLE WITH RFC[21]
- 23COMPATIBLE WITH RFC[23]
- 25COMPATIBLE WITH RFC[25]
- 1000COMPATIBLE WITH RFC[1000]
Functional Parameters
Relative promoter strength estimates (see [http://2009.igem.org/Team:Groningen/Promoters this page] from Groningen 2009):
| Reference | Strength |
|---|---|
| BBa_J23109 | 67 |
| BBa_J23106 | 2 |
Navigation
2021
iGEM_21_Tongji_China iGEM_21_SZPTiGEM_21 Leiden
iGEM_21 XHD-Wuhan-A-China
2020
iGEM_20 KEYSTONE_AiGEM_20 Gaston_Day_School
iGEM_20 QHFZ-China
2022
iGEM_22 BS_United_China2009-2019
iGEM_19 ThessalyiGEM_19 Stuttgart
iGEM_19 Baltimore_Biocrew
iGEM_19 Newcastle
iGEM_19 Hamburg
iGEM_19 UT_Austin
iGEM_18 UESTC-China
iGEM_17 Nanjing-China
iGEM_16 Sheffield
iGEM_09 USTC
USTC_2009's MEAUREMENT
[K176011]
Usage and Biology
The Yale iGEM team has assembled this promoter to citrine (an improved version of YFP, with excitation peak at 514nm and emission peak at 527nm) and a T7-terminator to quantify the level of expression in E. coli and in non-model organism hosts. This construct is available as the biobrick K185000
This construct has been successfully cloned into E. coli using the broad-host range vector pKT230, a RSF1010 derived plasmid, as well as using the pPZP200 plasmid which can be transformed into agrobacterium and rhizobium. Leaky expression of citrine was observed.
Yale 2015's Characterization
.jpg)
.jpg)
Measured strength
The Yale iGEM team found fluorescence levels nine times above the baseline level in E. coli cells transformed with the promoter-citrine construct. We also found this promoter to be effective in driving gene expression in S. meliloti, with fluorescence levels of over two times that of the baseline observed.
We further compared expression level of this promoter to two of the other promoters in the Anderson collection. The Anderson lab found relatively expression levels of 1, 0.33, and 0.10 respectively when comparing the promoters J23100 (Anderson Strong), J23110 (Anderson Medium) and J23114 (Anderson Weak). We found the relative expressions to be 1, 1.71 and 1.78 when we transformed our constructs into E.coli: K1856004 (Anderson Strong-Citrine), K1856003 (Anderson Medium-Citrine), K1856002 (Anderson Weak-Citrine). This highlights that even as all three Anderson promoters are effective in driving gene expression in E. coli, the relative expression level may vary depending on the gene fused to the promoter and on the E. coli strain used. The Yale iGEM team's readings were obtained in E. coli DH10B.
Comparing expression levels in S. meliloti (a rhizobium strain), the relative expression values were 1, 2.36, and no significant expression for the Anderson Strong, Anderson Medium, and Anderson Weak promoters respectively.
Team Warsaw 2010's measurement
Absolute promoter strength: 13,1pg RNA/minute/ug substrate DNA. It equals 2,80 microPoPSSheffield 2016's Characterisation
Nanjing-China 2017's Characterisation
In order to further extend the range and improve the sensitivity of detection, we expect to enhance the expression of SQR by substituting psqrR with pcons, the most efficient promotor among the igem parts. By doing so, we make sure that there is enough SQR in the system to oxidize even a small amount of S2- in time.
We have observed RFP response after inducing the modified pathway with 100 μmol/L Na2S, which proves that the new pathway works. We are still working on the comparison of two pathways.
>Internal Priming Screening Characterization of BBa_J23100: Has no possible internal priming sites between this BioBrick part and the VF2 or the VR primer.
The 2018 Hawaii iGEM team evaluated the 40 most frequently used BioBricks and ran them through an internal priming screening process that we developed using the BLAST program tool. Out of the 40 BioBricks we evaluated, 10 of them showed possible internal priming of either the VF2 or VR primers and sometime even both. The data set has a range of sequence lengths from as small as 12 bases to as large as 1,210 bases. We experienced the issue of possible internal priming during the sequence verification process of our own BBa_K2574001 BioBrick and in the cloning process to express the part as a fusion protein. BBa_K2574001 is a composite part containing a VLP forming Gag protein sequence attached to a frequently used RFP part (BBa_E1010). We conducted a PCR amplification of the Gag-RFP insert using the VF2 and VR primers on the ligation product (pSB1C3 ligated to the Gag + RFP). This amplicon would serve as template for another PCR where we would add the NcoI and BamHI restriction enzyme sites through new primers for ligation into pET14b and subsequent induced expression. Despite gel confirming a rather large, approximately 2.1 kb insert band, our sequencing results with the VR primer and BamHI RFP reverse primer gave mixed results. Both should have displayed the end of the RFP, but the VR primer revealed the end of the Gag. Analysis of the VR primer on the Gag-RFP sequence revealed several sites where the VR primer could have annealed with ~9 - 12 bp of complementarity. Internal priming of forward and reverse primers can be detrimental to an iGEM project because you can never be sure if the desired construct was correctly inserted into the BioBrick plasmid without a successful sequence verification.
Measured strength
Sheffield 2016 has improved the characterisation of both BBa_J23100 and BBa_J23106. These parts are a strong and medium promoter respectively, that we have used to design our iron detecting device. We have experimentally validated through fluorimetry that there is indeed a significant difference between expression levels of GFP coupled to the strong and medium promoters. Comparative analysis of promoter strengths can be directly interpreted from the data we obtained. This data can be found both on the original part experience pages of BBa_J23100 and BBa_J23106, as well as at our website. Our team has also improved the function of the BBa_J23100 part, by adding an RBS site downstream of the promoter (BBa_K2016005). BBa_J23100 was originally submitted to the Registry by Berkeley 2006.

Fluorescence of JC28 mutants or W3110 wild types transformed with RyhB-GFP constructs under the control of medium (MedGFP) or strong promoters (StrGFP).
Improvement from iGEM 2018 UESTC-China
This year, we UESTC-China have improved the previous part BBa_J23100 by adding RBS and pelB-5D. The combination of promoter, RBS and signal peptide makes it convenient to use as a biobrick and gives it the function of extracellular expression. And the part number is BBa_K2617017. For the function determination, we chose the PETase as our reporter protein because its activity can be easily detected. Thus we constructed two plasmids with and without pelB-5D respectively to compare the function of our improved part and previous part.
Link to our biobrick: https://parts.igem.org/Part:BBa_K2617017.
The activity of the extracelluar fractions was detected by the method of pNPB. And the results were as followed(Fig. 1).

Based on our functional determination test results, the improvement that we did has succeeded. PETase that carrying our improved part (Fig. 1) has much higher activity level than the PETase that carrying promoter BBa_J23100 but without pelB-5D. From our experiment result, we could conclude that our improved part indeed gives the promoter BBa_J23100 the function of extracellular expression.
Thessaly 2019 Characterization
Thessaly 2019 sought to characterize the coding sequence of TEM-optimized β-lactamase (BBa_I757010) under the regulation of the constituve Anderson Family promoters BBa_J23100, BBa_J23105, BBa_J23106, BBa_J23119. β-lactamase is an enzyme that hydrolyses β-lactams (e.g. ampicillin) and is naturally found in prokaryotic cells. A colorimetric assay has been developed using nitrocefin as a substrate which after hydrolysis from β-lactamase changes the reaction color, from yellow (380nm) to red (490nm).
To achieve that, the coding sequence was assembled with each promoter, a universal RBS (BBa_B0034) and a double terminator(BBa_B0015). The parts were cloned in pSB1C3 and pSB1K3 and transformed into E. coli DH5a competent cells.
In the photo below you can see the results of the primer addition using overhang PCR:
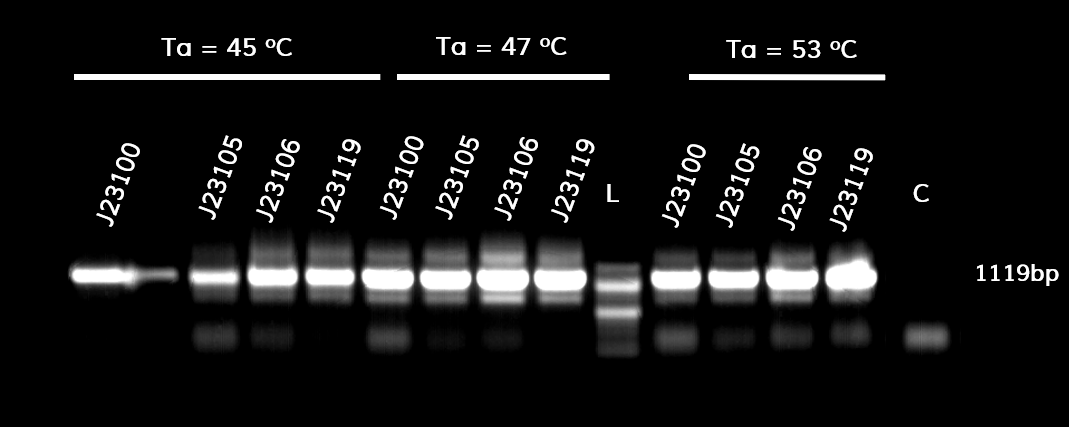
Figure 1. The results obtained after the PCR with the overhang primers for the different promoters of the Anderson family. We tested different annealing temperatures (45, 47 & 53℃) aiming for clear results. The expected band is at 1119bp and the ladder used was the 100bp DNA ladder by NEB.
For protein expression, the plasmids were transformed into E. coli BL21 (DE3) competent cells.
For the β-lactamase assay, we set up the following experimental design:
1. Grow BL21 (DE3) pre-culture overnight in 5ml LB (~16h) at a shaking incubator, 37℃ / 210rpm
2. The following morning, measure the OD600 of overnight cultures
3. Dilute all cultures to OD600¬ = 0.05 in M9 minimal medium
4. Grow cells 37℃ /210 RPM until OD600=0.4-0.6 (~2h)
5. Dilute all cells to the same OD600 (e.g. 0.4)
6. Load 160 of culture in a 96-well plate (do triplicates). Add 40 ul 0.5 uM nitrocefin for a final concentration of 100nM
7. Measure the absorbance at 490nm (for nitrocefin hydrolysis) and 600nm (for cell growth) every 30 seconds for 2 hours in a microplate reader. Shake between readings. Because plateau was reached within the first 30 minutes of the reaction, only those are depicted in the graph.
To ensure that the absorbance shown corresponds only to enzymatic activity by β-lactamase, we included 3 controls in the experiment. The first control has M9 medium only (no cells) and nitrocefin, the second has empty BL21 (DE3) cells (no plasmid) and nitrocefin, while the third has BL21 (DE3) cells containing the plasmid but not the part (empty plasmid). To obtain comparable results, we normalized all values by dividing OD490 by OD600.
The results are shown in the graph below

Figure 2. The hydrolysis of nitrocefin enabled by the expression of the β-lactamase gene, under the control of different promoters (J23100, J23105, J23106 & J23119) of the Anderson family. The substrate (nitrocefin) hydrolysis (490nm) is divided by cell growth (600nm), in order to normalize all values.
The maximum expression of β-lactamase was observed under control of the J23119 (brown line) which is the wild type promoter of the Anderson family. The expression is reduced with the J23100 and J23106 (yellow and purple line respectively), while the lowest expression levels were observed with the J23105 promoter (blue line). These results are in accordance with those from previous teams that measured fluorescence and the same pattern is observed. The controls conditions (pSB1C3 and BL21, or light purple and light blue respectively) confirm that the absorbance measured derives from β-lactamase activity only, both quantitatively and visually.
Below you can see the 96-well plate of the assay:

Figure 3.The observed color change due to the hydrolyzation of nitrocefin due to the production of β-lactamase, after a 2-hour enzymatic assay.
Note that the picture was taken after the plate-reader assay was completed and all conditions had reached a plateau, except the controls.
iGEM Team 2019 Stuttgart Characterization
We added quantitative experimental characterization to the following biobricks:
BBa_J23100
BBa_J23112
BBa_J23118
These parts are a family of constitutive promoters. They were present in plasmid BBa_J61002.
We analyzed the influence of the mentioned promoters on the expression of red fluorescence protein (RFP),
both on protein level (fluorescence spectroscopy) and mRNA level using reverse transcriptase quantitative polymerase
chain reaction (RT-qPCR).
Biobricks were transformed in E. coli MG1655. Cells were harvested in the early exponential phase and
fluorescence was measured. Also, 500 µL of culture was centrifuged and the pellet was used for RNA extraction.
In addition to that, E. coli MG1655 was cultured and harvested for RNA isolation without the plasmid
BBa_J61002 to ensure, that our primers specifically bind to RFP mRNA.
RT-qPCR was performed and analyzed using the ddCt method. To quantify the expression levels of RFP under different
promoters, the cDNA of a house-keeping gene was amplified as well. We chose a GTPase-activation protein (GAP) as a
housekeeping gene.
Results of fluorescence spectroscopy
Investigating the grown cell cultures by fluorescence spectroscopy clearly showed emission at 590nm (excitation at
540 nm) indicating a successful expression of RFP. Cells containing the promoter BBa_J23100 showed an emission at
590 nm of 192 +- 13. Compared to that, cells containing the promoter BBa_J23112 showed an emission of 30 +- 1. The
highest emission was shown by cells containing the promoter BBa_J23118: 345 +- 4.
Results of qPCR
Figure 1 shows, that RFP expression was about 7-fold higher than the expression of GAP in cells containing promoter BBa_J23100. Compared to
that, the expression of RFP in cells containing promoter BBa_J23112 was about 55-fold higher than expression of the
house-keeping gene. The highest expression of RFP compared to GAP was observed in cells containing promoter BBa_J23118.
Here, RFP expression was 74-fold compared to GAP expression.
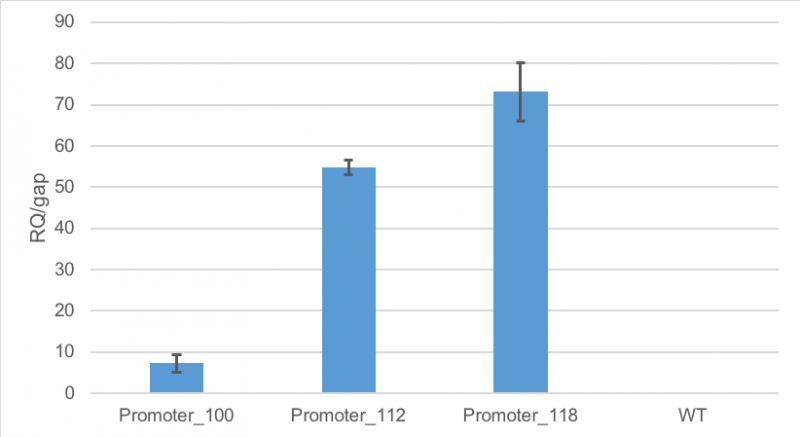 Figure 1: Average relative quantification of RFP expression compared to the expression of the house-keeping gene GAP in E. coli
MG1655.
Cells contained the plasmid BBa_J61002 with different promoters: BBa_J23100, BBa_J23112 and BBa_J23118. As a
control
E. coli MG1655 were cultivated without the plasmid. RT-qPCR measurements were carried out in technical triplicates. Standard deviation is shown
Figure 1: Average relative quantification of RFP expression compared to the expression of the house-keeping gene GAP in E. coli
MG1655.
Cells contained the plasmid BBa_J61002 with different promoters: BBa_J23100, BBa_J23112 and BBa_J23118. As a
control
E. coli MG1655 were cultivated without the plasmid. RT-qPCR measurements were carried out in technical triplicates. Standard deviation is shown
We were surprised by the results of the characterization of the Anderson promoters as they do not meet our expectations. Actually, we expected that the use of different promoter strengths would result in different levels of mRNA in a way that weak promoters would result in weak fluorescence and low corresponding mRNA levels and strong promoters would lead to high corresponding mRNA levels. More precisely, we expected cells with the promoter BBa_J23100 to exhibit the highest mRNA level, as it was supposed to be the strongest promoter of the ones we characterized.
When measuring fluorescence, we obtained the expected results: it was revealed, that cells with the promoter BBa_J23100 (strongest promoter) produced more RFP than cells with the promoter BBa_J23118. Cells with the weakest promoter (BBa_J23112) produced fewest amounts of RFP.
Possible reasons for the discrepancy between promoter strength, RFP amount and mRNA concentration could lie in the promoter library itself: Changes in the promoter sequence to generate the library could lead to impaired secondary structure of the mRNA. This in turn may influence the binding of ribosomes and the translation initiation efficiency significantly.
It may be possible, that the differences in fluorescence are mainly caused by changes on the translational level and not on transcriptional level, as to date promotor strength for these biobricks was only determined by fluorescence measurements.
For more information, detailed material and method description, please visit our wiki
Baltimore Biocrew 2019 Characterization
Goal
We, the Baltimore Biocrew, decided to characterize some of the Anderson promoters. These promoters are highly used by iGEM but the relative expression of these promoters have been routinely determined by measuring the fluorescence of a reporter protein. However, the function of a promoter is to start transcription of a gene so it may be more informative to measure the amount of RNA (instead of protein) produced by a reporter gene. Therefore, we decided to further characterize a selection of the Anderson promoters (J23100, J23101, J23103, J23105, J23118) by measuring RNA using reverse-transcription quantitative Polymerase Chain Reaction (qPCR).
Results
We set up samples for qPCR with three or four technical replicates per promoter and no template control samples to measure DNA contamination. We did data analysis using the Livak Method (a standard, comparative method) to determine the relative strength of the promoters from the qPCR data using rrSD as our reference gene, RFP as our target gene, and J23100 as our calibrator sample.
Example:
ΔCT(J23101) = CT(RFP, J23101) – CT(rrSD, J23101)
ΔΔCT(J23101) = ΔCT(J23101) – ΔCT(J23100)
2^(–ΔΔCT) = relative expression ratio
In our first trial of qPCR (8/03/19), we were able to measure the relative strengths for J23100, J23101, J23103, and J23105 which were 1.00, 0.00, 0.81, and 1.93, respectively. Since these strengths did not match the relative expression levels reported by iGEM2006_Berkeley from protein level measurements, we repeated the qPCR (8/10/19) with the same cDNA. The strengths from this second trial were 1.00, 0.00, 0.37, and 0.20. We repeated it again and the relative strengths that we got on 10/12/19 for J23100, J23101, J23103, and J23103 were 1, 0, 2.91, and .32. Next, we made new cDNA by growing new liquid cultures, extracting RNA again, and repeating reverse transcription. From the new cDNA, we repeated the qPCR procedure two more times. The relative strengths for that we got on 9/28/19 for J23100, J23101, J23103, J23105, and J23118 were 1, 24.63, .36, 1.76, and .25. The relative strengths that we got on 10/12/19 for J23100, J23101, J23103, and J23105 were 1, 45.97, 3.20, and 1.26. In addition we measured promoter J23118 twice and got the strengths 1.13 and 1.32.
Here is the relative promoter strengths that we got from the qPCR. Baltimore BioCrew measurements in orange compared to the 2006 Berkeley iGEM, who determined relative strengths from measurements at the protein level, in blue.

To support our RNA measurements we also measured fluorescence of the liquid cultures we used to extract RNA. The cultures were grown overnight so we expected the bacteria to be at the stationary phase, but we measured OD to normalize any differences in growth.
| Promoter | OD | fluorescence | fluorescence divided by OD | corrected relative expression | reported relative expression |
|---|---|---|---|---|---|
| BBa_J23100 | 0.876 | 250 | 285.38 | 1 | 1 |
| BBa_J23101 | 0.674 | 255 | 378.33 | 1.33 | 0.7 |
| BBa_J23103 | 1.1 | 230 | 209.09 | 0.73 | 0.01 |
| BBa_J23105 | 1.08 | 215.74 | 209.09 | 0.76 | 0.24 |
| BBa_J23118 | 1.04 | 238 | 228.84 | 0.80 | 0.56 |
After redoing our protocol many times and trying to compare our results to 2006 Berkeley iGEM team we concluded that our data doesn’t quite match theirs. The different results in strengths could be caused by many different factors while doing our protocols. However, we have succeeded in characterizing the different strength Andersons promoters (J23100, J23101, J23103, J23105, J23118) by measuring RNA using Quantitative Polymerase Chain Reaction (qPCR). In conclusion, we successfully reached our goal in bringing new data to the characterizations of 5 different Andersons Promoters. In the future, it would be good for other iGEM teams to try to measure RNA as well so there will be a standard qPCR protocol for iGEM.
To see more detailed methods and our protocols, visit our wiki
Newcastle 2019 Characterisation
Aim:
Newcastle 2019 have characterised the strength of the constitutive promoter BBa_J23100. The activity of BBa_J23100 was determined using eGFP as a reporter. A standard curve of the fluorescence level of eGFP was determined using eGFP with a His6-tag under the BBa_J23100 promoter. This allowed us to purify the eGFP protein to determine fluorescence at protein level. Our goal was to calculate absolute values of eGFP protein concentration in cells.
Figure 1.
A) Standard Curve of the mean fluorescence level of purified eGFP protein diluted to concentrations from 0 to 8.25 µM. Linear regression equation of Y = 302.4x + 72.79 and an R2 value of 0.9951.
B) The optical density (OD600) of E. coli Top10 cells assembled with eGFP over 24 hours
C) The fluorescence intensity of E. coli Top10 cells assembled with eGFP over 24 hours
D) Protein concentration in mg/ml of eGFP assembled in E. coli Top10 cells over 24 hours. Protein concentration was determined by converting fluorescence figures from B using the equation Y = 302.4x + 72.79.
E) Colony forming units (CFU) per mL (CFU/mL) of eGFP assembled in E. coli Top10 cells over 24 hours
F) The Number of eGFP proteins per cell over 24 hours. E. coli Top10 cells were assembled with eGFP
Excitation wavelength = 488 nm. Emission wavelength = 507 nm. Measured in Greiner black welled 96 well plate in a ThermoFisher Varioskan Lux Microplate Reader
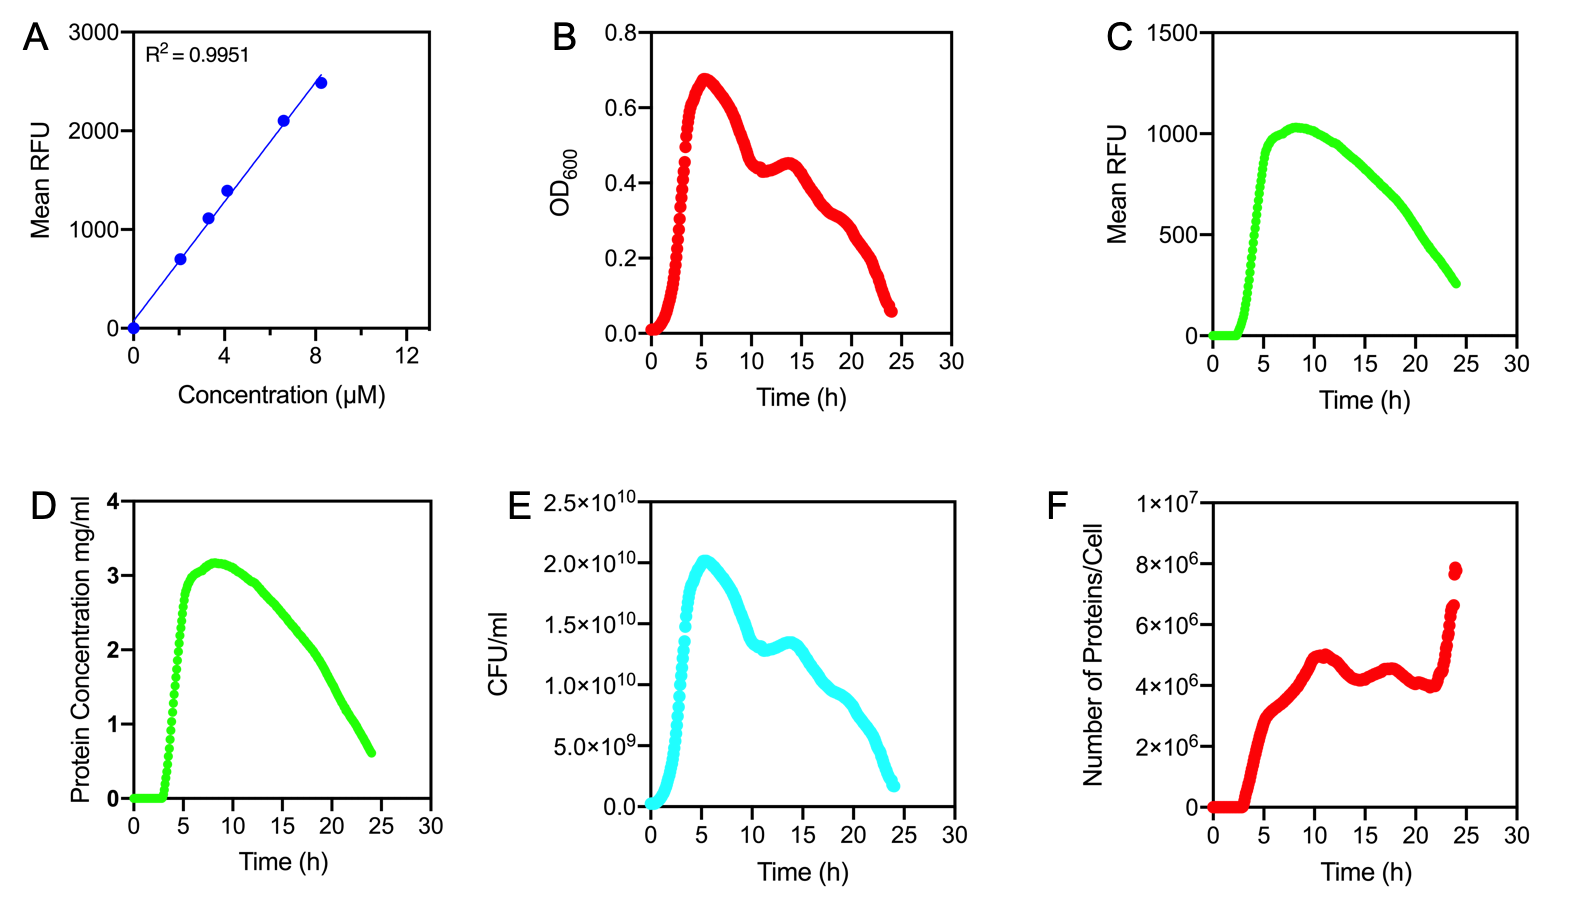
Results Figure 1A shows the standard curve of diluted purified eGFP at increasing concentrations. An R2 value of 0.9951 was achieved, showing the standard curve was a good fit. The OD600 showed a growth curve with an exponential phase and death phase however, the lag and stationary phase was not observed (Figure 1B). This was unexpected as we could expect the curve to be similar to that of a typical E. coli growth curve. This may be due to an issue with the plate reader and cell clumping at the lower optical densities. However, the fluorescence level reflected a similar pattern to a typical E. coli growth curve (Figure 1C). The fluorescence values into protein concentration in mg/ml (Figure 1D). The graph shows that the maximum protein concentration is approximately 3mg/ml after 10 hours. The protein concentration (mg/ml) showed a similar pattern as observed in the fluorescence level. The number of viable cells in our culture can be measured over the 24 hour period. Using these values combined with the protein concentration in mg/ml, we are able to calculate the mg of protein per CFU (mg/CFU) by dividing the protein concentration (mg/ml) over the CFU/ml value at the equivalent time (Figure 1E). Whilst mg/CFU is much better than a relative fluorescence value, our goal was to calculate absolute values of eGFP protein concentration in cells - the Number of Proteins per Cell. We divided the mg/CFU values by the molecular weight (MW) of the protein in mg. The MW of eGFP is 28.179 kDa, which is 28179•1.66 x 10⁻²¹ in mg. This resulted in figure 1F showing the Number of eGFP proteins per cell over 24 hours. However, there was a spurious increase in the number of protein per cell, this may be due to the issue in OD600 readings as seen in figure 1B.
Conclusions: In conclusion, we achieved the goal to calculate absolute values to measure promoter strength of BBa_J23100 using eGFP fluorescent expression as a reporter. A standard curve of the number of proteins per cell over time was achieved. The results showed that protein expression was high per cell reflecting the strength of the promoter. We have accurately measured proteins with internal standards. However, this experiment should be repeated as there were issues with measuring the optical density.
For more detail see - https://2019.igem.org/Team:Newcastle/Results/bronzecharacterisation
Hamburg 2019
Group: Hamburg iGEM 2019
Author: Marie-Theres Thieme, Marcel Zimmeck
We characterized the activity of the promoters we used in our project, the two constitutive promoters from the Anderson Family, BBa_J23100 and BBa_J23102. We measured the expression of GFP downstream of the promoters.
The parts were cloned into E. coli DH5α competent cells. The fluorescence measurements were performed using flow cytometry and plate reader measurements. The results of the flow cytometry measurement are shown in Figure 1.
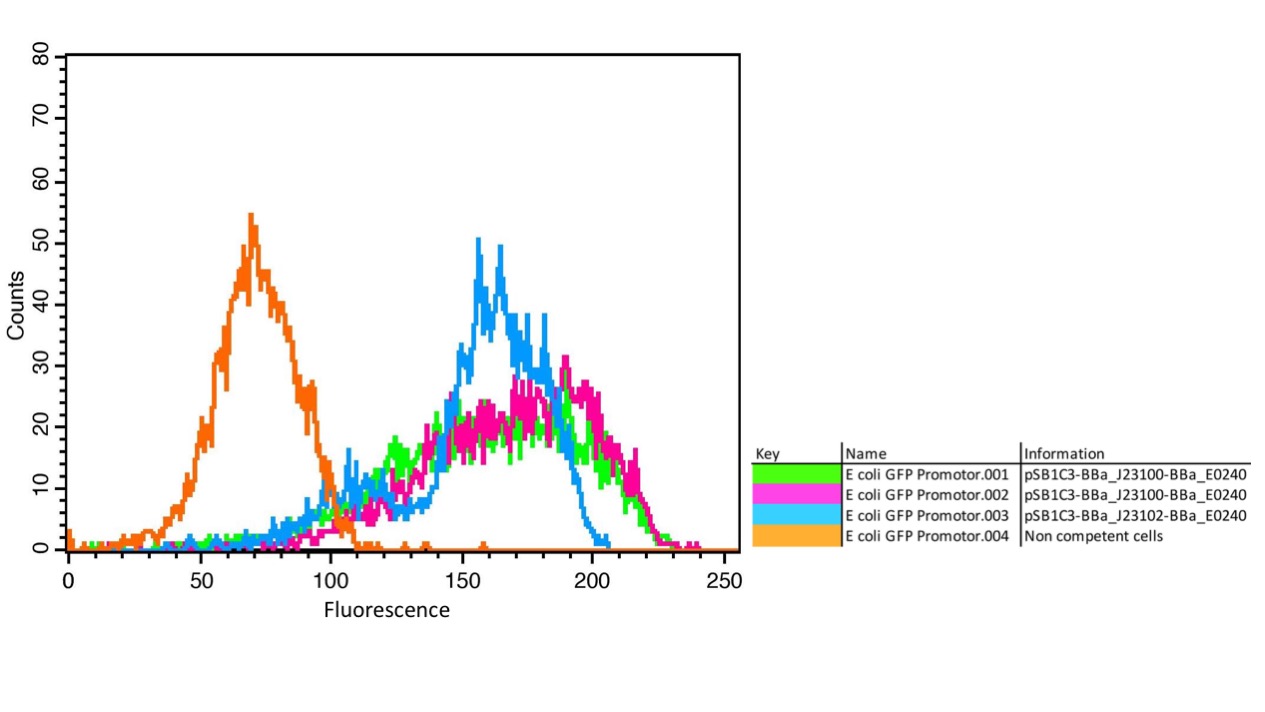
The results confirm the different strengths of the constitutive promoters. BBa_J23100 expresses a stronger fluorescence signal than BBa_J23102. As a negative control we used non-competent cells to measure background emission.
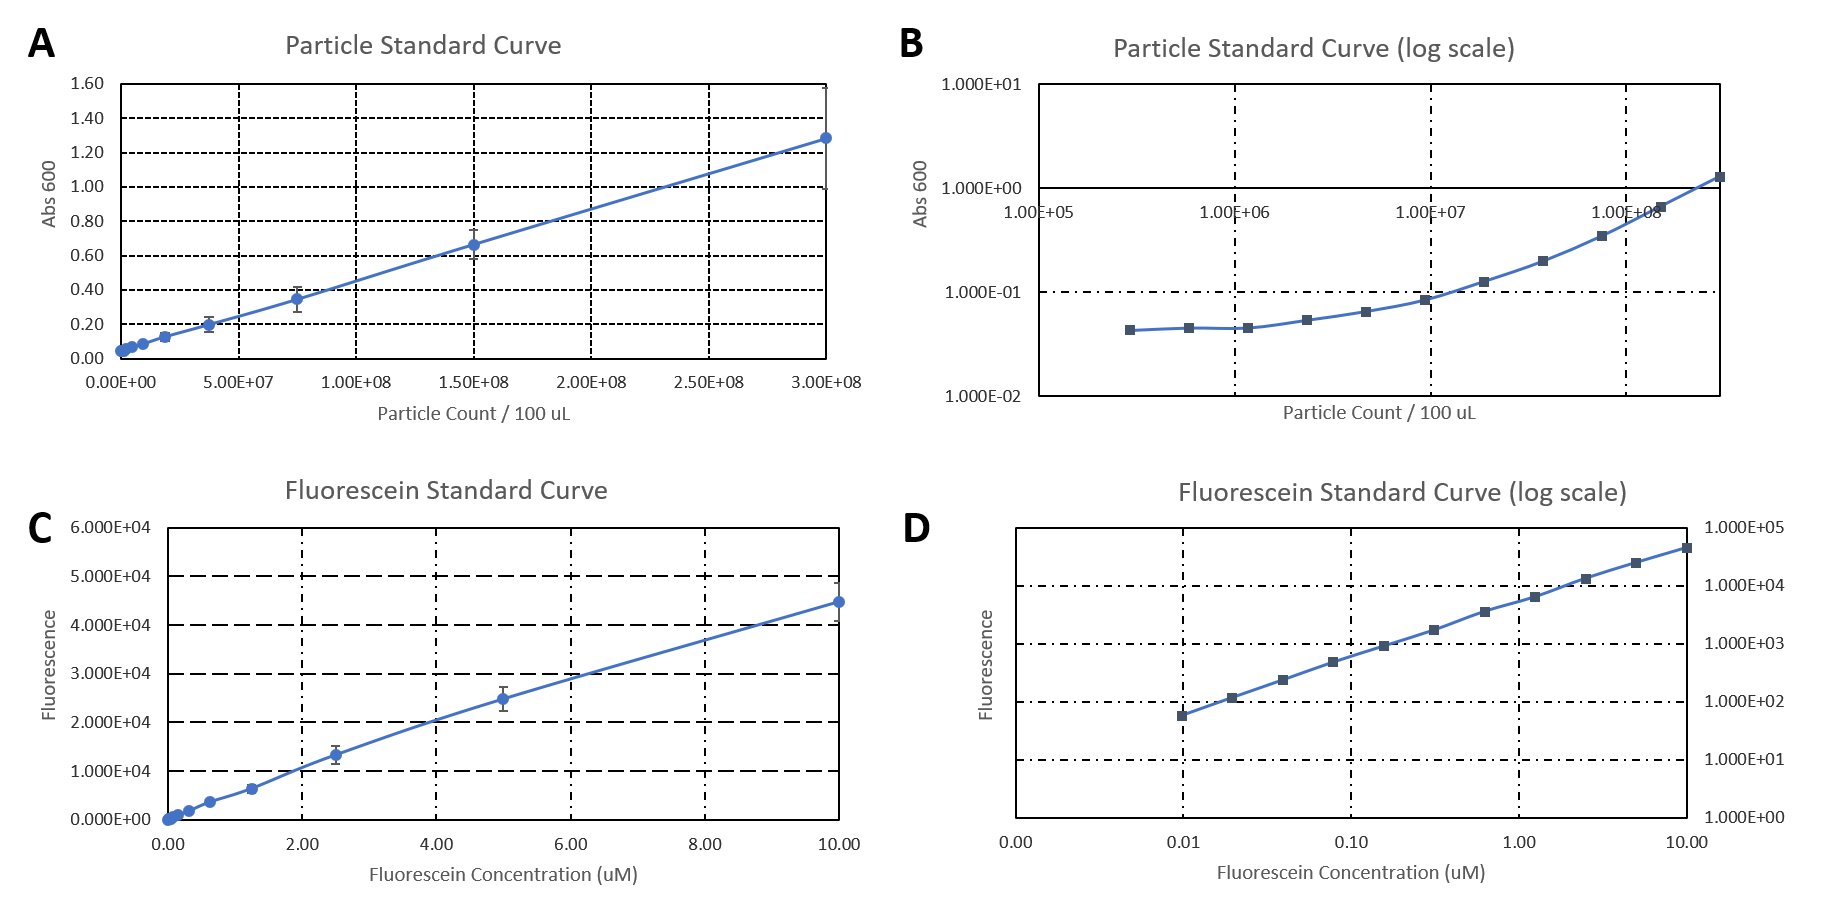
The data used to calibrate the plate reader measurements are shown in Figure 2. The results of our measurement of GFP on the plate reader are shown in Figure 3.
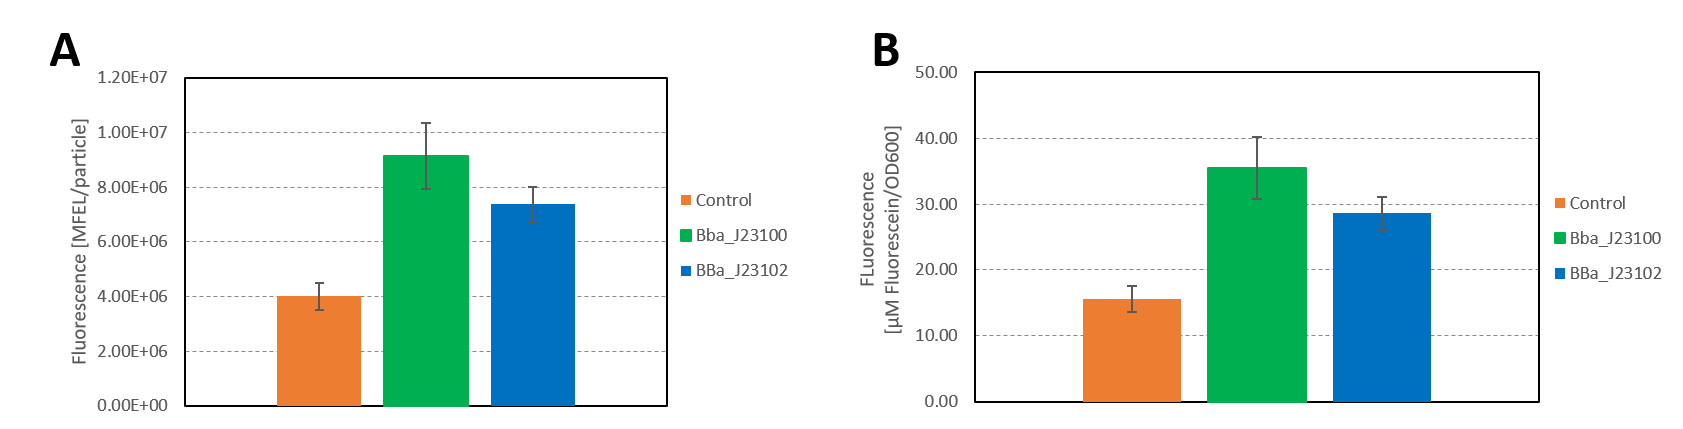
The results confirm the previous results from the FACS measurement. The promoter BBa_J23100 expresses a stronger fluorescence signal when compared to BBa_J23102.
We calculated the strengths of these promoters relative to the control:
BBa_J23100: 2.28
BBa_J23102: 1.84
The relative strength of BBa_J23102 when compared to BBa_J23100 is 0.8. In comparison, the values in the registry is 0.856.
Additionally, we sequenced the plasmids used in our measurement. The reported sequence matched the Anderson promoter BBa_J23100. The reported sequence for the promoter BBa_J23102 showed three point mutations, which could have impacted the strength of the promoter. The following mutations occurred: 6A>G, 22G>A, 27T>A. This explains the decrease in the relative promoter strength of BBa_J23100 compared to BBa_J23102.
Added by KEYSTONE_A 2020 Team
J23100 can be used as a strong constitutive promoter in bacterial cellulose producing strain K. rhaeticus iGEM. It is the strongest one among all constitutive promoters characterized.

Figure above: Constitutive promoter average strengths in K. rhaeticus iGEM and E. coli, normalized against J23104.
Although all promoters are functional, their relative strengths differ between K. rhaeticus and E. coli. For K. rhaeticus, data is shown as grey bars, with standard deviation of N=3 biological replicates, characterized in liquid HS-medium containing cellulase, measured 3 h post-inoculation. Relative promoter strengths in E. coli are superimposed as black stripes.
References:
Florea, M., Hagemann, H., Santosa, G., Abbott, J., Micklem, C. N., Spencer-Milnes, X., ... & Chughtai, H. (2016). Engineering control of bacterial cellulose production using a genetic toolkit and a new cellulose-producing strain. Proceedings of the National Academy of Sciences, 113(24), E3431-E3440.
Gaston Day School Characterization 2020
Group: Gaston Day School iGEM 2020
Author: George Luan
We incorporated the strong Anderson Promoter J23100 into our argK expression design. We built a MATLAB model and simulated it using the ode45 solver. The results are shown below in the figure. We calculated the transcription rate in M/min per cell from the promoter activity (polymerase per second per cell). We derived the reference promoter (J23101) activity value from (Kelly, 2009). According to the original measurement of relative promoter strength provided in the registry, J23100 is (2547/1791) times the strength of the reference promoter; adopting a similar method used by Team:Sydney_Australia 2016, we multiply the promoter activity of J23101 by the ratio of 2547:1791 and got out the value of 0.042663 PoPS per cell. Since our plasmid has an average copy number of 200 per cell, the total expression per cell is equivalent to 8.5326 molecules per second per cell. We converted this value to transcription rate in the unit compatible to those of most of the gene expression parameters so that future teams can also use the this value in their initial simulations. (Many available gene expression model parameters use molar and minute as the unites.) We attained the transcription rate in mol/s by dividing the Avogadro’s number and got out 1.4169 * 10^-23 mol/s. We used 6 * 10^-16 L as the volume of the E. coli cell. We divided the transcription rate in mol/s by the cell volume and multiplied it by 60 and finally attained the value 1.416 * 10^-6 M/min for the transcription rate. This parameter provides a baseline for initial simulations. However, previous teams have found out that the expression level can vary depending on E. coli strains. The promoter activity also does not completely represent the transcription efficiency (e.g. Polymerase travels at a different speed at different points on a DNA sequence.) Therefore, the future teams need to experimentally optimize the parameter for their own experiments.
We simulated our model, and the graph below shows the argK expression level under J23100.

The additional information about the modeling results can be found on our wiki. Our results suggested that even though J23100 yields more robust expression compared to other Anderson Promoters, it is most likely that weak constitutive promoters like J23116 can still provide sufficient expression level of genes in the cell because of the over-expression. A critical factor for metabolic engineering is to help the cell to maintain expedient level of pathway proteins so the metabolic pathway is able to maintain healthy and efficient. High gene expression level under strong constitutive promoters, especially those that are related to the cell’s own metabolic pathways, can potentially disrupt the cell’s metabolism, damage the cell’s function, and even cause the death of the cells. Our past experience (Gaston Day School 2018) also suggests that excessive metabolic component expression will make the cell more vulnerable. Besides, strong constitutive expression also takes up large amount of energy source of the cell. Therefore, J23100 is not ideal for metabolic engineering. According to (Fakruddin, 2003), strong inducible promoters can also be used in place of J23100.
References:
Fakruddin, M., Mohammad Mazumdar, R., Bin Mannan, K. S., Chowdhury, A., & Hossain, M. N. (2012). Critical Factors Affecting the Success of Cloning, Expression, and Mass Production of Enzymes by Recombinant E. coli. ISRN biotechnology, 2013, 590587. https://doi.org/10.5402/2013/590587
Kelly, J., Rubin, A., Davis, J., Ajo-franklin, C., Cumbers, J., Czar, M., De Mora, K., Glieberman, A., Monie, D., & Endy, D. (2009). Measuring the activity of biobrick promoters using an in vivo reference standard. Journal of Biological Engineering, 3 (1), 4. https://doi.org/10.1186/1754-1611-3-4
iGEM 2020 QHFZ-China, new documentation (For Bronze)
Group: QHFZ-China iGEM 2020
Author: Yixian Yang
We measured BBa_J23100, BBa_J23107 and BBa_J23109 as a strong, moderate and weak promoter respectively in 2020. For all the experiments below, we use E. coli BL21(DE3) strain.
Part 1: Measurement with a reporter, sfGFP
Description
First, we measured the strength of the promoter by sfGFP BBa_K3457015.
Protocol
The gene circuit we used is as below:

The protocol is as below:
(1)Pick clones in good condition and put them into 500 μL LB medium containing antibiotics. Shake them to grow at 37℃ for 5~7 hours until the bacteria solution becomes turbid.
(2) Add 2mM iPTG into 3 mL LB medium containing antibiotics. Add 3 μL of the bacteria solution mentioned in step 1 to dilute the bacteria by the ratio of 1:1000. Shake the solution to grow the bacteria at 37℃ overnight.
(3) The bacteria solution was centrifuged, and the LB medium was removed. Then the bacteria were resuspended by PBS. 100 μL such solution was put into a well of a 96-well plate. The GFP fluorescence and OD600 were detected by microplate readers (Bio-Teck). The parameters are exciting light: 488 nm, light reception: 520 nm, gain 50.
(4) The value of PBS was deducted from the result above. GFP / OD600 was calculated.
Result

We set the strehgth of J23109 as 1. The relative strengths of J23107 and J23109 were 4.4 and 12.0. Though they are not the same as the data at the top of this page, they worked well, and the strength order of the three promoters was consistent with other people's data. The difference may owe to a particular gene circuit and protocol.
Part 2: Measurement with CHAS 106094
Description
Second, we measured the strength of the promoter by CAHS 106094 BBa_K3457012. This year, we used CAHS 106094 to protect bacteria from freeze-drying and dry storage. We used different promoters to adjust the expression level of CAHS 106094 to study the relationship between the survival rate and CAHS 106094 expression level.
Protocol
The gene circuit we used is as below:

The protocol is as below:

【Day 1】Induction culture
(1) PPick clones in good condition and put them into 500 μL LB medium containing antibiotics. Shake them to grow at 37℃ for 5~7 hours until the bacteria solution becomes turbid.
(2) Add 2mM iPTG into 3 mL LB medium containing antibiotics. Add 3 μL of the bacteria solution mentioned in step 1 to dilute the bacteria by the ratio of 1:1000. Shake the solution to grow the bacteria at 37℃ overnight.
【Day 2】Freeze-dried
(1) If fluorescence induced by the iPTG is detectable in the control group (GFP), continue experimenting.
(2) Use spectrophotometer to measure the OD600 of the bacteria solution, OD600 = 1 equals to
109 cells. If the OD600 value is between 0.1 and 1, There is a linear relationship between
OD600 and bacterial density. Calculate the volume of bacterial solution for 109 cells by using
the formula V = 100 / (OD600 × Dilution ratio).
(3) Take out a measured amount of 109 cells and centrifuge it at 8000 rpm for 3 min. Then pour out the
supernatant.
(4) Resuspend the bacteria in a 15 ml tube with a pre-refrigerated 100 μL 3% glucose solution.
(5) Take off the cover of the tube and put the bacteria into the cold trap. Open the compressor of the lyophilization machine and freeze the shaking tube for 2 h at -70℃.
(6) Put the caky bacteria solution into the drying chamber of the lyophilization machine. Open the vacuum pump to
dry it in vacuum for 6h at 1 Pa vacuum degree.
(7) Turn off the vacuum pump, place it at seal box filled with silica-gel desiccant a for 2 days at room
temperature.
【Day 3】Room temperature storage
【Day 4】Detect the survival rate
(1) Add 1 mL of sterile water to the tube, vortex for 15 s, placed it at room temperature for 10 min.
(2) Adjust the density of the bacteria solution by gradient dilution, then spread 100 μL of the bacteria solution on
the LB plate.
(3) If the density above is not suitable, take 100μL of the solution and spread it on the LB plate after several
gradient dilutions.
(4) Culture the bacteria overnight at 37℃.
【Day 5】Cell Count
(1) Take out the LB plate and take photos to record experimental results.
(2) Use the automatic cell counting function of Image J to count the colone number on the LB plate, then compare the
results between each group.
Result

As expected, J23100 is the most potent promoter and it gave the best survival rate. J23107 is the second and J23109 seemed too weak to express enough CAHS 106094. In conclusion, J23100 and J23107 is effective in this situation, but J23109 is not.
Contribution from iGEM 2021 SZPT-China
(The following experimental data are from the literature, not the actual data made by the team.)
Group: iGEM 2021 SZPT-China
Author: Yuetong Chen
Due to the compression of experimental time this year, we are not able to obtain the actual data of the characterization of Anderson promoter.Although the Anderson promoters have been well-studied and widely-used in Escherichia coli, our findings in the literature revealed that the expression pattern in Gluconacetobacter hansenii ATCC 53582 is completely different from that in E. coli. Hereby, we present the characterization of the Anderson promoter family in G. hansenii ATCC 53582, which could be a useful genetic tool in future studies on bacterial cellulose film.
Abstract
Promoter is one of the major tools in synthetic biology, which can be manipulated to tune gene expression. The strength of a promoter is normally dictated by its precise sequence. Min et al. investigated transcription performance of a reporter gene mRFP1 that was driven by 11 different constitutive promoters in G. hansenii ATCC 53582, including the strongest member in the family J23119 from an open-access collection known as the Anderson family. The variant promoter J23119-A27T was accidentally constructed during the cloning process and it differed from J23119 with only a single nucleotide at the 27th position. The RBS and terminator in the testing platform were the BioBrick parts Promoter is one of the major tools in synthetic biology, which can be manipulated to tune gene expression. The strength of a promoter is normally dictated by its precise sequence. Min et al. investigated transcription performance of a reporter gene mRFP1 that was driven by 11 different constitutive promoters in G. hansenii ATCC 53582, including the strongest member in the family J23119 from an open-access collection known as the Anderson family. The variant promoter J23119-A27T was accidentally constructed during the cloning process and it differed from J23119 with only a single nucleotide at the 27th position. The RBS and terminator in the testing platform were the BioBrick partsBBa_B0034andBBa_B0015respectively.


Figure 1. (a) List of Anderson promoters that were evaluated in this study. (b) A schematic depicting the mRFP1 reporter assay used to determine the strength of each candidate promoter.
The expression characteristics of Anderson promoters in Gluconacetobacter hansenii ATCC 53582
In the literature, the strength of each promoter, as quantified by the fluorescence intensity per unit OD, was normalized to that of the J23119 construct. It is worth noting that these promoters showed a bimodal distribution (Figure 2). Among the tested promoters, J23100, J23119-A27T, J23104, J23102 and J23119 are strong ones. J23119 is the strongest Anderson promoter in E. coli. but not in G. hansenii ATCC 53582. Instead, J23100, J23119-A27T, J23104 and J23102 are consistently stronger than J23119.

Besides, the strength of a few Anderson promoters in either E. coli or G. hansenii ATCC 53582 was compared in the literature. In general, most promoters that are strong in G. hansenii ATCC 53582 also tend to be strong in E. coli and vice versa. The promoter strength exhibit an apparent bimodal distribution pattern in G. hansenii ATCC 53582, whereas they appear to be more evenly distributed from 0 to 1 in E. coli.

The influence of promoter strength on the sequence characteristics
By comparing the relationship between the strength and sequence characteristics of these 11 promoters tested in G. hansenii ATCC 53582, we found an interesting correlation. Our data revealed that the first 3 bases of the promoter sequence (within the−35 box) have an important role in regulating gene expression in the Gluconacetobacter genus. The nucleotides “T” (thymine) and “G” (guanine) at position 1 and 3 respectively seem particularly crucial, as both of them are present in all the strong promoters, but absent in all the weak promoters. For example, J23108 differs from J23119 by only one nucleotide at the first position, but its promoter strength is significantly lower than that of J23119 in all the three strains tested (P< 0.001). Similarly, J23101 differs from J23119-A27T by only a single nucleotide at the third nucleotide position, but its promoter strength is at least 5-fold lower than that of J23119-A27T. In contrast, several nucleotides in the −10 box (underlined in TATAAT) can be mutated without causing a massive effect on the promoter strength.
References
[1] Min Yan Teh, Kean Hean Ooi, Shun Xiang Danny Teo, et al. An Expanded Synthetic Biology Toolkit for Gene Expression Control in Acetobacteraceae [J]. ACS Synthetic Biology, 2019, 8(4): 708-723.
Calibration of pBAD to J23100
https://2021.igem.org/Team:Leiden
We first cloned promoters in front of the gene of the fluorescent protein mCherry (BBa_K3962339 and BBa_K3962340) for the calibration. The result showed constant expression from p2547::mCherry and the expression from pBAD::mCherry increased gradually as the concentration of arabinose increased (Figure 1). The lowest fluorescent protein expression was observed at the concentration of 0.00032% (w/v). We also concluded that pBAD is tightly regulated as it showed low leaky expression when no arabinose was added.

Figure 1. The fluorescence intensity of strains carrying our construct under different arabinose concentration. The measurement was carried out for 20 h. The x-axis shows the time of each measurement. The y-axis shows the fluorescence of mCherry in the arbitrary unit (AU). The blue data points represent the fluorescent intensity of p2547::mCherry strain, red data points represent the pBAD::mCherry strain. The arabinose concentration is shown at the top of each graph.
The relation between the arabinose concentration (w/v, log5) and the relative fluorescence of pBAD fitted into a linear regression model with R2=0.9586 (Figure 2). From the regression it could be calculated that at the arabinose concentration of 0.14%, the transcriptional activity of pBAD was equal to p2547.

Figure 2. Linear regression of arabinose concentration relative fluorescence of pBAD compared with p2547. The orange dash lines showed how p2547 related to pBAD transcriptional activity at the arabinose concentration of 0.14% (log5-1.22).
To assist future iGEM teams in the usage of these promoters for regulation and prediction of synthetic circuitry, a table with arabinose concentrations causing equal expression of promoters in Anderson’s constitutive promoter collection was made.
Contribution
|
•••••
University of Texas at Austin iGEM 2019 |
UT Austin iGEM 2019: Characterization of metabolic burden of the Anderson SeriesDescriptionThe 2019 UT Austin iGEM team transformed the Anderson Series promoters into our 'burden monitor' DH10B strain of E. coli, which contains a constitutive GFP cassette in the genome of the cell. GFP expression fluctuates depending on the number of ribosomes available. Using this strain, we characterized the relative burden (percent reduction in growth rate) of each Anderson Series part. Our results showed a range of growth rate reductions for each of these parts due to ribosomal reallocation from the genome of the host cell, towards the expression of RFP. Anderson Series parts with strong promoters are depicted with darker red colors and Anderson Series parts with weak promoters are depicted with lighter pink colors to show relative RFP expression. We saw a positive correlation between relative promoter strength and metabolic burden; parts with stronger promoters expressed less GFP and had a lower growth rate than parts with weaker promoters. The regression line for the graph below was constructed by measuring the burden of 5 parts that were created by the 2019 UT Austin iGEM team that each contained an Anderson Series promoter (BBa_J23104 or BBa_J23110), an RBS of varying strength, and a BFP reporter. For more information on characterization of these parts through the burden monitor, visit our team’s wiki page: [1]
Importance of Characterizing BurdenAlthough often we cannot avoid using a specific burdensome part, knowing in advance that it is burdensome, and that it has a high chance of mutating into a non-functional genetic device, can help with troubleshooting and coming up with alternatives. In the specific case of fluorescent protein-expressing devices, Fluorescence-activated cell sorting (FACS) can be used to filter out individual cells that meet a certain fluorescence threshold. This way, the cells expressing lower levels of the fluorescent protein are weeded out of the population. |


XHD-Wuhan-A-China Characterization 2021
https://2021.igem.org/Team:XHD-Wuhan-A-China
Design and purposes
Based on BBa_J23100, a genetic circuit BBa_J23100-B0034-amilCP-B0015 was constructed to characterize the function of this BBa_J23100 promoter. Since we use new microbial chassis organisms in our project, we need a suitable plasmid backbone to ensure that our gene circuit can be expressed correctly. After our search and BLAST, the combination of the J23100-amilCP gene circuit and the pBBR1MCS-2 plasmid backbone is a new combination, which did not appear in the previous iGEM project.We cloned the J23100 promoter from the J23100- pSB1C3 plasmid, and used homologous recombination to obtain the recombinant plasmid J23100- pBBR1MCS-2, and verified the length of the recombinant plasmid to ensure the success of the recombinant plasmid through PCR and enzyme digestion.
method
AmilCP expression under the control of J23100 with pBBR1MCS-2
The plasmid J23100-pBBR1MCS-2 containing the J23100 promoter was transformed into E. coli DH5α, and then cultured in LB liquid medium with shaking 200 rpm overnight. The next day, the bacterial solution was diluted 1:100 and suspended in LB liquid medium, and repeated three times. OD600 and OD588 every half hour was measured by microplate reader.
Results
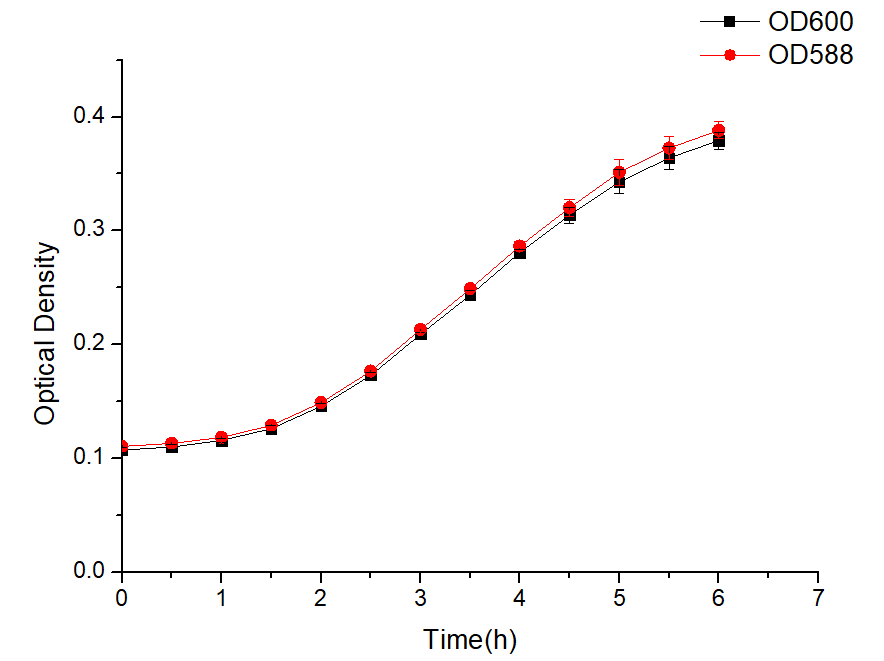
Figure 1 The expression of amilCP changes over time
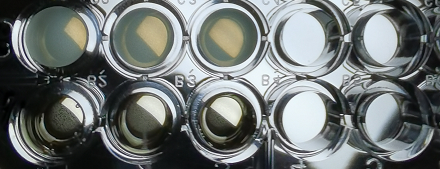
Figure 2 Sample characteristics during microplate reader testing
As shown in Figure 1 and Figure 2, the combination of J23100-amilCP and pBBR1MCS-2 can be expressed normally in E. coli, and it is found that the trend between OD600 and OD588 is basically the same. But the value of OD600 is slightly lower during the entire culture process. It can be seen from the figure that after introducing our plasmid, the bacteria began to enter the logarithmic growth phase after 2 hours, and entered the plateau phase after 5 hours. The OD value was around 0.4. The OD value is much lower than that of Escherichia coli which does not carry the plasmid. This result shows that our plasmid will affect the growth of E. coli and put greater growth pressure on Escherichia coli.
Tongji China 2021's characterization
Protocol
1. Transfer promoter-mRFP plasmid to BL21(DE3) or DH5α, coat plates and select monoclonal colony.</li>
2. Culture the bacteria from monoclonal colony in Amp LB medium overnight.
3. Adjust the bacteria concentration using Amp LB to OD600=0.4. Culture in 37 ℃ 220 rpm till OD600=0.7.
4. Inoculate the bacterial solution into a 96-well plate in the manner of 100 μL/well, with 3 groups of parallel. Measure the OD600 and fluorescence intensity (excitation: 535nm. Emission: 620 nm) of the plates by the Microplate spectrophotometer.
5. Calculate the relative fluorescence.
Purposes and Results
In order to improve the hydrogen sulfide oxidation efficiency by making subtle control of enzymes concentration, we chose promoters with different strength in Anderson library (BBa_J23100). We validated their relative strength in E.coli (DH5α) for model training(Figure 1). Our result shows a similar trend with previous characterization. However, we find that J23104 is a stronger promoter than J23100 and it shows bad repeatability in three replications while other promoters shows good repeatability. Characterization of J23104 in K. rhaeticus by KEYSTONE_A 2020 has a similar phenomenon.

We also characterized two promoter PlacI and Pcst in our kill switch(BBa_K3823012) and compared their strength with promoters in the Anderson library. Pcst has a considerable strength with J23110 while PlacI is a weak promoter(Figure 2).

Characterization by BS_United_China 2022
We utilized this part for our safety composite part(BBa_K4329009). The constitutive promoter will be used to initiate sgRNA toward our desired target region. Thus, know down of ATP synthase can be achieved to prevent our engineered bacteria from contaminating the natural environment.
This a an engineering from BNSC-China (ONCE_China)
We crossed the constitutive promoters of the J23 family (J23119, J23100, J23104, J23113) in prokaryotes as well as plac with several artificially designed promoters (TE1, TE2, TE3, TE4, TE5) in yeast that have been recently reported in the literature.

Figure. 1 Characterization of Synthesized promoters .
NYU Abu Dhabi 2024 Characterization
Group:
NYU-Abu-Dhabi 2024 BBa_J23100 was characterized as a promoter driving eYFP expression in bacterial colonies under two temperature conditions: 28°C (ambient) and 37°C (heat stress). The promoter activity was measured using fluorescence quantification. Based on the data from the promoter activity graph, BBa_J23100 exhibited moderate activity at both temperatures. However, the promoter showed slightly higher activity at 28°C compared to 37°C, where the activity remained relatively steady but lower. These results suggest that BBa_J23100 is a moderately strong promoter, but its efficiency may decrease slightly under heat stress conditions. 
Figure 1. Promoter activity of BBa_J23100 at 28°C and 37°C. The graph indicates that BBa_J23100 performs slightly better at 28°C, with stable but lower activity at 37°C. </center>
//direction/forward
//promoter/anderson
//regulation/constitutive
//rnap/prokaryote/ecoli/sigma70
| efficiency | 8.5326 molecule s^(−1 ) (per cell) |
| n/a | constitutive promoter family member |
| negative_regulators | |
| positive_regulators |