
 1 Registry Star
Part:BBa_R0062:Experience
This experience page is provided so that any user may enter their experience using this part.
Please enter
how you used this part and how it worked out.
The team from Davidson College and Missouri Western State University discovered that this part promotes "backwards transcription" when LuxR protein is present and AHL-3OC6 is absent. You can read [http://www.ibc7.org/article/journal_v.php?sid=265 the paper that documents this unexpected "backwards promoter activity"] in their open access paper.
Applications of BBa_R0062
User Reviews
UNIQb393447f1df4d92b-partinfo-00000000-QINU
|
•••••
ZJU-China 2016 |
For better description of single oscillation system, we measured the response intensity of pluxR to AHL. We found that the response threshold of pluxR to AHL isn’t exactly as what shown in BBa_R0062. The minimum response concentration was about 10^-9 M instead of 10^-11M, the maximum response concentration was about 10^-6M instead of 10^-7M. and the relation curve was different with ETH_Zurich 2014 too. Since our samples were much more than ETH_Zurich 2014, we believe that our result are more precise and our model are more in accordance with the reality. |


|
•••••
ETH Zurich 2014 |
Background informationWe used an E. coli TOP10 strain transformed with two medium copy plasmids (about 15 to 20 copies per plasmid and cell). The first plasmid contained the commonly used p15A origin of replication, a kanamycin resistance gene, and promoter pLux (BBa_R0062) followed by RBS (BBa_B0034) and superfolder green fluorescent protein (sfGFP). In general, for spacer and terminator sequences the parts BBa_B0040 and BBa_B0015 were used, respectively. The second plasmid contained the pBR322 origin (pMB1), which yields a stable two-plasmid system together with p15A, an ampicillin resistance gene, and one of three promoters chosen from the Anderson promoter collection followed by luxR (BBa_C0062). The detailed regulator construct design and full sequences (piG0041, piG0046, piG0047) are [http://2014.igem.org/Team:ETH_Zurich/lab/sequences available here]. Experimental Set-UpThe above described E. coli TOP10 strains were grown overnight in Lysogeny Broth (LB) containing kanamycin (50 μg/mL) and ampicillin (200 μg/mL) to an OD600 of about 1.5 (37 °C, 220 rpm). As a reference, a preculture of the same strain lacking the sfGFP gene was included for each assay. The cultures were then diluted 1:40 in fresh LB containing the appropriate antibiotics and measured in triplicates in microtiter plate format on 96-well plates (200 μL culture volume) for 10 h at 37 °C with a Tecan infinite M200 PRO plate reader (optical density measured at 600 nm; fluorescence with an excitation wavelength of 488 nm and an emission wavelength of 530 nm). After 200 min we added the following concentrations of inducers (3OC6-HSL, 3OC12-HSL, and C4-HSL): 10-4 nM and 104 nM (from 100 mM stocks in DMSO). Attention: All the dilutions of 3OC12-HSL should be made in DMSO in order to avoid precipitation. In addition, in one triplicate only H2O was added as a control. From the the obtained kinetic data, we calculated mean values and plotted the dose-response-curves for 200 min past induction.
Characterization of the promoter's basal leakiness with LuxR in the absence of 3OC6-HSLThe amount of regulator LuxR (BBa_C0062) in the system was shown to influence the pLux promoter's basal expression or leakiness. By using the three different constitutive promoters BBa_J23100, BBa_J23109, and BBa_J23111 for the production of LuxR we have measured this effect in terms of fluorescence (see Figure 1, left-hand side). ResultsThe measurements of the uninduced system (H2O only) showed an increase of the pLux (BBa_R0062) activity in terms of fluorescence per OD600 for increasing strength of the promoter controlling LuxR (BBa_C0062) expression. For BBa_J23100 (strongest promoter chosen) the basal GFP expression was more than 2.5-times higher as compared to BBa_J23109 (weakest one chosen), with BBa_J23111 (medium strength) falling between the two values but close to the strong promoter. Overall, this is in line with the promoter strength given in the Anderson collection and suggests that the basal leakiness of the pLux (BBa_R0062) promoter increases with an increase of LuxR (BBa_C0062) expression. Characterization of the promoter's sensitivity to 3OC6-HSL depending on LuxR concentrationThe amount of regulator LuxR (BBa_C0062) in the system was shown to influence the pLux promoter's response to the inducer concentration (3OC6-HSL). By using the three different constitutive promoters BBa_J23100, BBa_J23109, and BBa_J23111 for the production of LuxR we have measured this effect in terms of fluorescence (see figure 1). ResultsThe measurements of the induced system with 3OC6-HSL concentrations of 10-13 M to 10-5 M showed an increasing sensitivity of the pLux (BBa_R0062) promoter (in terms of fluorescence per OD600) for increasing strength of the promoter controlling LuxR (BBa_C0062) expression. For BBa_J23100 (strongest promoter chosen) the sensitivity is highest (half maximal effective concentration EC50 approximately 20 pM), for BBa_J23109 (weakest one chosen) the sensitivity is lowest (EC50 approximately 100 pM), with BBa_J23111 (medium) falling between these two but closer to the strong promoter (EC50 approximately 10 nM). Overall, this is in line with the promoter strength given in the Anderson collection and suggests that the sensitivity of the pLux (BBa_R0062) promoter increases with an increase of LuxR (BBa_C0062) expression. Also, the sensitivity and the approximate EC50 values are in the range of previous experience.
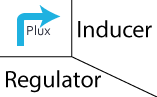
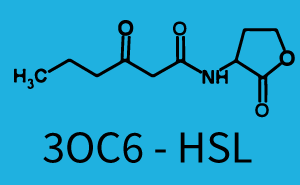
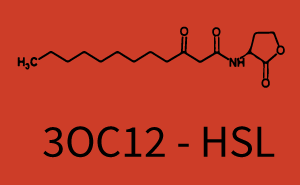
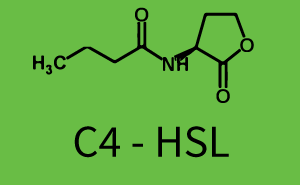
 Figure 1 Effect of varied promoter strength for the expression of LuxR (BBa_C0062) and the resulting change of pLux (BBa_R0062) sensitivity. The fluorescence per OD600 is shown over an inducer-range of 10-13 M to 10-5 M. The promoters used are: BBa_J23100 (high LuxR expression, red), BBa_J23111 (medium LuxR expression, green), and BBa_J23109 (low LuxR expression, blue). All three promoters are part of the Anderson collection. Data points are mean values of triplicate measurements in 96-well microtiter plates 200 min after induction ± standard deviation. For the full data set and kinetics please [http://2014.igem.org/Team:ETH_Zurich/contact contact] us or visit the [http://2014.igem.org/Team:ETH_Zurich/data/raw raw data] page. Characterization of crosstalkBackground informationThe E. coli strain used and the experimental set-up are described above. However, here we focus on the characterization of crosstalk and as a result we used only one, strong promoter (BBa_J23100) controlling the three different regulators (LuxR, LasR, and RhlR) used in the experiments in order to quantify crosstalk with pLux. In the following, we describe all the different levels of crosstalk we have assessed. First-order crosstalkIn the first order crosstalk section we describe activation of pLux due to LuxR binding to inducers different from 3OC6-HSL or pLux itself binding a regulator-inducer pair different from LuxR-3OC6-HSL. First Level crosstalk: LuxR binds to different AHLs and activates the pLux promoterIn the conventional system 3OC6-HSL binds to its corresponding regulator, LuxR, and activates the pLux promoter (figure 2, light blue). However, LuxR can potentially bind also other AHLs and then activate pLux (figure 2, 3OC12-HSL in red and C4-HSL in green). This leads then to unwanted gene expression (crosstalk).  Figure 2 Overview of possible crosstalk of the LuxR/pLux system with three different AHLs. Usually, 3OC6-HSL binds to its corresponding regulator, LuxR, and activates the pLux promoter (light blue). However, LuxR may also bind 3OC12-HSL (red) or C4-HSL (green) and then unintentionally activate pLux. Second Level crosstalk: other regulatory proteins, like LasR and RhlR, bind to their natural AHL substrate and activate the pLux promoterIn the conventional system 3OC6-HSL binds to its corresponding regulator, LuxR, and activates the pLux promoter (figure 2, light blue). However, pLux can potentially be activate by other regulators (LasR, RhlR), binding their corresponding regulator (figure 3, 3OC12-HSL in red, C4-HSL in green). This leads then to unwanted gene expression (crosstalk).
 Figure 3 Overview of possible crosstalk of the LuxR/pLux system with two additional regulators (LasR and RhlR). Usually, LuxR together with inducer 3OC6-HSL activate their corresponding promoter pLux (light blue). However, pLux may also be activated by the LasR regulator together with 3OC12-AHL (red) or by the RhlR regulator together with C4-AHL (green). Second order crosstalk: Combination of both cross-talk levelsThe second order crosstalk describes unintended activation of pLux by a mixture of both the levels described above. The regulator and inducer are being different from LuxR and 3OC6-HSL, respectively, and at the same time they do not belong to the same module. For example, the inducer C4-HSL (green), usually binding to the regulator RhlR, could potentially interact with LasR regulator (red) and together activate pLux (light blue). This kind of crosstalk is explained in figure 4.  Figure 4 Overview of possible crosstalk of the pLux promoter with both the regulator and inducer being unrelated to the promoter and each other. Usually, LuxR together with inducer 3OC6-HSL activate their corresponding promoter pLux (light blue). However, pLux may also be activated by another regulator together with an unrelated inducer. For example, the inducer C4-HSL (green) may interact with the LasR regulator (red) and together activate pLux (light blue). Results
Modelling CrosstalkEach experimental data set was fitted to an Hill function using the Least Absolute Residual method. The results are shown in table 2.  The fitting of the graphs was performed using the following equation :
| ||||||||||||||||||||||||||||||||||||


UNIQb393447f1df4d92b-partinfo-00000003-QINU
|
No review score entered. ETH Zurich 2013 |
Characterization of the pLuxR dose response to OHHL by plate reader analysis and single cell analysisFluorescence data analysis  The fitting of the following graphs was performed using this equation :
 Figure 1. Sensitivity curve of the wild type promoter analyzed on the Tecan Infinity M200 microtiter plate reader. The OHHL concentration range is plotted against the standarized fluorescence (au). EC50=5.86, R2= 0.87,n=1.7 .All assays were carried out in triplicates, results are presented as mean ± standard deviation.
To obtain high quality data we did single cell analysis over the range defined above. Obviously the EC50 changed compared to the microtiter plate data.  Figure 2. Dose response comparison between [OHHL] induction in liquid culture and on agar plates, of the BBa_J09855 construct using the BBa_R0062 promoter and a eGFP gene as reporter</b> analyzed at different [OHHL] in the single cell analysis. The black curve shows the response of to OHHL in liquid culture, the orange curve shows the response to OHHL on agar plates. All assays were carried out in duplicates, results are presented as mean ± standard deviation.
 Figure 3: Sensitivity curve of the wild type pluxR in agar plates and liquid culture For the liquid culture we got :EC50=0.02nM, R2=0.84, n=1.7; For the agar plates we got :EC50=4.45nM, R2=0.80, n=1.7 The black curve shows the response of to OHHL in liquid culture, the orange curve shows the response to OHHL on agar plates. All assays were carried out in duplicates, results are presented as mean ± standard deviation. To obtain high quality data we did single cell analysis over the dose response range defined above. Obviously the EC50 changed compared to the plate reader data. Figure 2. The plot shows the dose reponse curve of the promoter depending on AHL concentration. We performed this experiment in liquid culture as well as on agar plates (OHHL was added to the melted 1.5% agar), which was closer to our project. We observed a 220 time shift in the dose response between the liquid culture single cell analysis and the one in agar plates. See Figure 3 |
UNIQb393447f1df4d92b-partinfo-00000005-QINU
|
•••••
SUN(Tsinghua) |
Part was sequenced and functional. |
|
•••••
iGEM12_OUC-China |
|
•••••
|
In order to optimize the function of the lux promoter, We creat a hybrid promoter BBa_K737067 which combines plux with OmpR, and in this case, plux can be led to expression by HSL and obtain by phosphorylation of OmpR protein.. According to the research of it before, we camp up with a program . Keep the sequencing of Lux Box, -35box and -10box., Then put the sequencing of C3 point of OmpR promoter into -35box and -10box.
Figure 1 structural representation of Plux promoter
Figure 2 the analysis of conserved sequence of pLux by Weblogo Plux promoter is organized from the promoter the shining gene of V. fischeri(R0062). Through analyzing common hybrid promoter of Lux by Weblogo , we found that the sequence of Lux Box is conserved. In benefit of LuxR Binding Site, -35box and -10box of the promoter the shining gene of V. fischeri(R0062).
Figure 3 : Our design of pLux-OmpR hybrid promoter We link the hybrid promoter to the test circuit. For control group experiment, we put strain A to LB medium adding 20% Sucrose solution and not adding any sucrose solution to cultivate in 37% shake flask , and detect the change of OD value and fluorescence value between 12h.
Though high concentration sucrose solution restrains the grain of E.coli, it doesn’t have effect on the work of circuit. In conclusion, we find that high osmotic pressure has no effect on quorum sensing circuit and the activated of plux promoter. Strain A could serve as control group of pLux-OmpR hybrid promoter. |


Measurement of pLux/OmpR hybrid promoter's expression property
Place strain B in 100 mL LB medium with gradient osmotic pressure stress and culture in shake-flask in 37°C.Calculate RFU of each time point ,and we get a surprising result!

Figure 6 Experimental Group 1 Relative Fluorescence Unit--Time Scatter graph

From the figure 6 we can see that when stressed by 7% sucrose, GFP's expression is stronger than those cultured in normal condition.
However,when stressed by 14% sucrose, GFP's RFU is 3 times as high as normal culture condition.This indicates that sucrose stress promotes GFP's expression via gene circuit.
UNIQb393447f1df4d92b-partinfo-00000009-QINU
XMU-China 2011
|
••••
|
Site-directed mutagenesis at position 3,5 and 3/5 of BBa_R0062On the basis of the nucleotide sequence of the lux pR promoter, the 20 base pair inverted repeat ACCTGTAGGA TCGTACAGGT might consititude a protein binding site. And we also learned that mutagenesis at position 3 and position 5 might cause dramatic change on the expression of downstream gene. Therefore, we generated 3 mutants (BBa_K658006 BBa_K658007 BBa_K658008) of the promoter lux pR by site-directed mutagenesis at position 3, 5 and 3/5. By testing their strength in IR-GFP devices, we prove that mutagenesis at position 3 and position 5 can change the expression of downstream gene. Mutated promoters lux pR-3 (BBa_K658006) and lux pR-5 (BBa_K658007) dramatically enhanced the expression of the downstream gene compared with wild type promoter lux pR (R0062), while mutated promoter lux pR-3/5 (BBa_K658008) gave an even weaker expression of the downstream gene than promoter lux pR (R0062). Based on the information about the mutated promoters, we constructed a series of population-control devices which can maintain the cell density of bacteria population at several certain values. Lux pR strength testing deviceTo test the strength of promoters lux pR(BBa_R0062) and its 3 mutants lux pR-3 (BBa_K658006), lux pR-5(BBa_K658007), lux pR-3/5(BBa_K658008) , we constructed four devices( BBa_K658016 BBa_K658017 BBa_K658018 BBa_K658019). If promoter lacl+pL(BBa_R0011) is induced by isopropyl-b-D-thiogalactopyranoside (IPTG), this device will be switched on. At sufficiently high cell density, this device produces greenish tint visible by naked eye. By measuring florescent intensities at steady state of the cell growth for these four IR-GFP devices, the strength of a promoter lux pR could be defined.
The results are shown in following figures:
 Figure 1 Promoters strength relative to lux pR-3 (BBa_K658006).

 Figure 3: Fluorescence of four IR-GFP devices at 20h. 5, 3, 3/5, N represent for IR-3-GFP (BBa_K658017), IR-5-GFP (BBa_K658018), IR-3/5-GFP (BBa_K658019) and IR-GFP (BBa_K658016) respectively.
Application----a series of population-control devicesThe study of the mutated promoters lux pR-3 (BBa_K658006), lux pR-5(BBa_K658007) and lux pR-3/5(BBa_K658008) can be applied to construct a series of population-control devices based on iccdB0.6 (BBa_K658003). These devices—iccdB0.6(BBa_K658003), iccdB-3(BBa_K658009), iccdB-5(BBa_K658010) and iccdB-3/5(BBa_K658011) program the steady-state cell density maintaining at different levels.
The results are shown in following figures:  Figure 4 Experimentally measured steady-state cell density of iccdB0.6(BBa_K658003) and iccdB-3 (BBa_K658009).
 Figure 5 Average of experimentally measured cell densities of BL21’s cells with iccdB0.6 (BBa_K658003) and its mutant iccdB-3 (BBa_K658009).
This matched the result of the test on four lux pR promoters’ strength in our IR-GFP device (BBa_K658016) mentioned above. As is shown in figure 2, promoter lux pR-3 has the highest strength of the four. It is probable that mutation at position 3 lowers the threshold for the binding reaction between LuxR/AHL protein complex and promoter lux pR, which starts the Quorum Sensing system at a relatively earlier period with a lower cell density compared with circuits regulated by wild type promoter lux pR (BBa_R0062). Once the QS system is started, downstream killer protein expresses. The viable cell density reaches a steady state when cell growth rate equals to its death rate. Generally, steady-state cell density seems to fluctuate at the cell density when QS is started. Thus, the higher strength a promoter has, the earlier the population-control device is started, leading to a lower steady-state cell density.
|

|
No review score entered. iGEM Tokyo_Tech 2010 |
In order to characterize R0062, Plux repression promoter, we constructed K395100 combining R0062 and K121013, which is a promoter-less gfp reporter (rbs-gfp-ter-ter) on pSB6A1 and used a fusion of PlacIq (I14032) to gfp (K121013) as a positive control and used promoterless gfp (K121013) as a negative control.
|
.jpg)

|
Antiquity |
This review comes from the old result system and indicates that this part did not work in some test. |
|
•••••
wmholtz |
Using this part, I have successfully constructed and tested a quorum sensing circuit in E. coli. |
|
•••
Aberdeen_Scotland 2009 |
Our miniprep, digest and gel gave expected results. However we did not use this part for our cloning. |
|
No review score entered. NYMU-Taipei 2009 |
|

Tsinghua-A 2017
|
•••••
|
Crosstalk between Plux and Nine AHL-Receptor CombinationsI BackgroundThe crosstalk of Plux between 3 kinds of AHL molecules (3OC6HSL, 3OC12HSL and C4HSL) and 3 kinds of receptors (LuxR, LasR and RhlR) was characterized by ETH_Zurich 2014. However, they used AHL reagents to measure the dose-response of promoter activity, which may not be convenient in quorum sensing, because the concentration of AHL bacteria secrete may be out of the range they tested before. In other words, bacteria is unable to secrete so much AHL molecules to activate gene expression. Furthermore, the response time in the quorum sensing process is also important for designers to optimize their synthetic circuits with better precise and robustness. Therefore, we designed circuits to measure the crosstalk between receptors expressed in one kind of E.coli and AHL molecules secreted by another kind of E.coli and response time of these systems. II ResultsCrosstalk between Plux and Nine AHL-Receptor Combinations
III Experiment Design and Measurement MethodsFirst, we cloned three AHL synthases: luxI (BBa_C0061), lasI (BBa_C0078) and rhlI (BBa_C0070), each ligated with promoter (BBa_J23100), RBS (BBa_B0034) and terminator (BBa_B0015) on a low copy backbone (pSB3K3). At the same time, we cloned three receptor-promoter combinations to pSB6A1. The three receptors are luxR (BBa_C0062), lasR (BBa_C0179) and rhlR (BBa_C0171) (with the same promoter, RBS and terminator as AHL synthases). Sensor promoter Plux (BBa_R0062) drives RFP (BBa_E1010) expression (with the same RBS and terminator as above) to detect the response of the promoters to AHL molecules via the receptors. Adding together, there are nine AHL-Receptor-Plux combinations. After that, we co-transformed the plasmids containing AHL synthases and plasmids containing receptor-Plux combinations. (Gene circuit of them is shown in Fig. 2) (Fig. 2 Gene circuit of 9 AHL-Receptor-Plux combinations) Finally, we detect how RFP intensity per cell change with time, which can be used to indicate the intensity of the promoter response to AHL molecule via corresponding receptor. Detailed measurement methods are as follows: 1. Transform MG1655ΔsdiAΔlacI with 9 kinds of combinations of plasmids mentioned above. 2. Pick bacterial clones from the petri plate, then shake it overnight in the LB medium (3ml) with 50 microgram/ml Ampicillin and 30 microgram/ml Kanamycin at 37℃. For each combination, 2 clones are picked. 3. Dilute the overnight culture to 1/50 in fresh LB medium (3ml) containing 50 microgram/ml Ampicillin and 30 microgram/ml Kanamycin. 4. Incubate the fresh cultures at 37℃ until OD600 reaches 0.2. 5. Add 1ml culture obtained from Procedure 4 to 2ml fresh LB medium containing 50 microgram /ml Ampicillin and 30 microgram/ml Kanamycin. Incubate the fresh cultures at 37℃. 6. Take out 200μl cultures obtained from Procedure 5 and measure the fluorescent intensity and OD600 after some time. (The cultures will not be put back again.) The excitation wavelength is 584nm, emission wavelength is 607nm.
Background informationQuorum-sensing bacteria such as Vibrio fischeri, are able to detected their own population density and implement density-based decision-making,Using the luxI/luxR quorum-sensing system, synthetic biologists have designed a large number of devices in prokaryotic microorganisms.Inevitably, high performance is required from such devices, and this includes reliability, sensitivity, Hence, to improve the properties of population-density switches, we design of ultrasensitive responses base https://parts.igem.org/Part:BBa_R0062 use Point mutation Experiment Design
plux3: https://parts.igem.org/Part:BBa_K2267030 plux1: https://parts.igem.org/Part:BBa_K2267029 plux6: https://parts.igem.org/Part:BBa_K2267032 plux8: https://parts.igem.org/Part:BBa_K2267046 III MethodsThe experiments for the characterization of parts were performed as described previously For density-response testing, cells (E. coli strain BW25113) from single colonies on LB agar (BD, USA) plates were grown overnight in 1 ml nutrition-rich, acid-base equilibrium medium (REM) (15.2 g/l yeast extract (BD, USA), 0.5% (NH4)2SO4, 4 mM MgSO4, 2% glucose and 24 g/l K2HPO4.3H2O, and 9.6 g/l KH2PO4) in Falcon tubes overnight (8−12 h, 1000 rpm, 37 °C, mB100-40 Thermo Shaker, AOSHENG, China). The cultures were subsequently diluted 500-fold with REM in 96-well plates, which were further incubated at 37°C in a shaker at 1000 rpm. Once the diluted cultures reached an OD600 of 0.12–0.14 (~3 h), 10 μL aliquots were transferred into 1 mL REM in 24-well plates (Corning/Costar 3524). These plates were incubated at 37°C in a Varioskan Flash (Thermo Scientific, USA) under constant shaking at 1,000 rpm for 20 h to maintain exponential growth, during which the OD600 and fluorescence values were recorded IV ResultsThe activated LuxR regulator binds to a LuxR-inducible promoter, pLux, upstream of a GFP reporter. As a result, GFP is expressed when the receiver device is induced with 3O-C6 AHL. We designed this part to characterize the activation range of the Lux receiver device. https://parts.igem.org/Part:BBa_K2267040 is Control, we did point mutation on https://parts.igem.org/Part:BBa_R0062 and the exact spots are plux1: https://parts.igem.org/Part:BBa_K2267029 plux3: https://parts.igem.org/Part:BBa_K2267030 plux4: https://parts.igem.org/Part:BBa_K2267031 plux6: https://parts.igem.org/Part:BBa_K2267032 plux8: https://parts.igem.org/Part:BBa_K2267046 listed below. We linked gfp reporter genes luxr-plux1-gfp: https://parts.igem.org/Part:BBa_K2267043 luxr-plux3-gfp: https://parts.igem.org/Part:BBa_K2267041 luxr-plux4-gfp: https://parts.igem.org/Part:BBa_K2267042 luxr-plux6-gfp: https://parts.igem.org/Part:BBa_K2267044 luxr-plux8-gfp: https://parts.igem.org/Part:BBa_K2267045 on them respectively to test the function of modified promoters.
We characterised the activation range of this device using a GFP reporter https://parts.igem.org/Part:BBa_K319039. The results of our characterisation experiments can be found here
|
 (Fig. 1: Results of our crosstalk experiment)
3OC6HSL-LuxR is the wild-type pair of Plux. However, from this result, we can see that there are many other pairs can activate Plux. For example, 3OC6HSL-LasR, 3OC6HSL-RhlR, 3OC12HSL-LuxR, C4HSL-LuxR, C4HSL-LasR, C4HSL-Rhl can all activate it. What is more, the quorum sensing needs more than 30 hours to establish a steady state, which may be important for designing dynamic functions in bacteria with quorum sensing.
(Fig. 1: Results of our crosstalk experiment)
3OC6HSL-LuxR is the wild-type pair of Plux. However, from this result, we can see that there are many other pairs can activate Plux. For example, 3OC6HSL-LasR, 3OC6HSL-RhlR, 3OC12HSL-LuxR, C4HSL-LuxR, C4HSL-LasR, C4HSL-Rhl can all activate it. What is more, the quorum sensing needs more than 30 hours to establish a steady state, which may be important for designing dynamic functions in bacteria with quorum sensing.


UNIQb393447f1df4d92b-partinfo-00000016-QINU