
 1 Registry Star
Part:BBa_C0062:Experience
This experience page is provided so that any user may enter their experience using this part.
Please enter
how you used this part and how it worked out.
Applications of BBa_C0062
The Genspace 2015 iGEM team used a Lux + LacZ device in order to evaluate a prototype biosensor (BBa_K1799019) that detects L-Acyl-Homoserine-Lactone (AHL) and produces beta galactosidase activity in response. This mechanism is as follows: AHL is a small molecule (213.23 Daltons) produced by some bacteria that have evolved quorum sensing circuits to detect the presence of high concentrations of bacteria. We started with the naturally-occurring quorum-sensing circuit wherin the LuxR regulatory protein binds with AHL and stimulates promotion by the pLux promoter. In the wild, this can trigger behavior such as biofilm formation. Placement of the LacZ translational unit downstream of the pLux results in the production of beta galactosidase in the presence of AHL. This can be measured using the Miller Assay.
The Lux pathway responds to the presence of AHL, which is produced by various bacterial species, including Pseudomonas aeruginosa, commonly found in large numbers in human waste and sewage.
Experimental Data
A Beta-Galactosidase Assay (aka “Miller Assay”) was carried out as described by Marian Price-Carter from the Roth Lab at UCLA (http://rothlab.ucdavis.edu/protocols/beta-galactosidase-3.html). Different concentrations of AHL were found to impact both cell growth profiles as well as Beta-Galactosidase activity levels. We also found that constant exposure to high levels of AHL (1uM) through repeated 1:100 dilutions had no discernable impact on cell growth compared to negative controls (0uM), but had the unexpected effect of minimizing Beta-Galactosidase production – even relative to negative controls. Indeed, we found the unit-step change in AHL concentration to be the salient factor in increased expression of Beta-Galactosidase. By “unit-step” change, we mean making a 1:100 dilution from an overnight with no AHL into an LB solution with the appropriate antibiotics and a greater-than-zero AHL concentration.
The AHL concentrations reported here were determined based on initial attempts to find a concentration range where cell growth was neither substantially delayed nor was Beta-Galactosidase production only modestly increased. We started with overnights that were first prepared in 0uM and 1uM AHL concentrations with appropriate antibiotics in LB media in a rotating incubator at 37C. The 1uM AHL overnight was diluted 1:100 into fresh LB media with appropriate antibiotics and with 1uM AHL to serve as the positive control. The overnight with no AHL was diluted 1:100 into fresh LB media with appropriate antibiotics and either 0uM or 1uM AHL. The 0nM AHL solution served as the negative control. Each hour after dilution (for a total of four hours), 1 mL samples were taken and immediately evaluated for OD600 readings as well as input to the Beta-Galactosidase assay. The initial results are shown below (note: not in triplicate at this stage of the experiment).
 Initial Cell Density & Beta-Galactosidase Activity versus Time
We were intrigued by the low rate of growth for the 1uM test case as well as the considerable Beta-Galactosidase activity levels. We wished to find the AHL concentrations that resulted in reduced amounts of delay in cell growth through a series of OD600 measurements (which are easier to conduct than a Beta-Galactosidase assay). In a similar way as before, we evaluated the following AHL concentrations in succession: 1uM (1000nM), 500nM, 100nM, 10nM, 3nM, 1nM, 0.5nM and the results are shown in the figure below.
 Preliminary Cell Density Studies
All AHL concentrations greater than 10nM showed consistent delays in cell growth over the first three or four hours. Concentrations between 0.5nM and 10nM showed an almost uniform variation between minimal and maximal delay, respectively. Guided by this preliminary investigation, and consistent with previous characterizations involving the Lux promoter (for example, see https://parts.igem.org/Part:BBa_R0062:Experience ), we chose to focus on unit-step AHL concentrations of 0.1nM, 1nM and 10nM. A negative control with no AHL and a positive control maintained in 1uM AHL continued to be included for comparative purposes. Overnights were first prepared in 0uM and 1uM AHL concentrations with appropriate antibiotics in LB media in a rotating incubator at 37C. The 1uM AHL overnight was diluted 1:100 into fresh LB media with appropriate antibiotics and with 1uM AHL to serve as the positive control. The overnight with no AHL was diluted 1:100 into fresh LB media with appropriate antibiotics and either 0nM, 0.1nM, 1nM or 10nM AHL. The 0nM AHL solution served as the negative control. Each hour after dilution, 1.5 mL samples were taken and put immediately on ice and stored at 4C to create triplicate 0.5mL samples for use in the Beta-Galactosidase assay.
Cell growth curves as measured by OD600 were obtained and are plotted below.

There is no substantial difference between the positive and negative controls. The growth curve associated with the 0.1nM solution is also substantially the same as the controls. In contrast, the growth curves for 1nM and 10nM are considerably delayed compared to the controls. However, after 14 hours, all solutions under study have approached stationary phase.
The Beta-Galactosidase Activity (measured in Miller Units) is plotted below.

As observed in prior work (e.g., http://www.ncbi.nlm.nih.gov/pmc/articles/PMC3145315/) the high levels (>20,000) of Beta-Galactosidase activity associated with AHL concentrations of 1nM and 10nM are correlated with delayed cell growth. While the negative control has a relatively low level of Beta-Galactosidase activity, as expected, it is remarkable to note that the positive control has a lower level still. In a quorum sensing context, we might make sense of this as follows: the constant presence of a high-level of AHL does not require the same action as a sudden change in AHL. In this case, some refractory mechanism would appear reasonable. The unit-step change of AHL concentration to 0.1nM results in increased activity that attenuates to negative control levels after approximately 5 hours, consistent with being on the low-end of the AHL scale. In contrast, the 1nM and 10nM concentrations of AHL result in dramatic increases in activity. The onset of activity increase for 1nM appears to be slightly delayed compared to 10nM, which could be related to the effective diffusion delay of AHL through the outer membrane pores. However, after 3 hours, the activity for 1nM is commensurate with 10nM and eventually is greater beyond hour 8. This is due to an intrinsic difference in behavior as a function of AHL concentration that is explored next.
The number of Beta-Galactosidase molecules at each hour is estimated by multiplying the Miller Units (a reasonable proxy for the number of Beta-Galactosidase molecules per cell as noted by Garcia et al., 2011) by the OD600 value scaled by 8x10⁸. Using a three-sample moving average to ride out statistical fluctuations in each time series, we find the results shown below.

This plot shows that the concentration of 1nM AHL results in the highest yield of Beta-Galactosidase, almost a factor of four times greater than the negative control. These results are of interest in a variety of applications where the total yield of a synthesized product must be either maximized or set to a target value (often subject to a variety of other constraints). Further consideration of this type of phenomena is considered in the figures below.

The yield curves in these concentrations under study have a number of features in common. The yield over the first three hours increases at the lowest rate (r1). After three hours, the rate often increases (r2>r1) until a plateau is reached (P). These three parameters (r1, r2 and P) are sufficient to classify the observed yield curves. In the case of the positive and negative controls – as well as the 0.1nM concentration – the plateau is reached about an hour after entering stationary phase. This may also be true for the 10nM concentration as 14 hours of data capture was barely sufficient to reach stationary phase. However it is noteworthy that the 1nM concentration appears to have reached its plateau of terminal yield after only 11 hours (i.e., even while still in mid-log growth).
User Reviews
UNIQdb39b6b8b08c9cf2-partinfo-00000000-QINU
|
••••
ETH Zurich 2014 |
Background informationWe used an E. coli TOP10 strain transformed with two medium copy plasmids (about 15 to 20 copies per plasmid and cell). The first plasmid contained the commonly used p15A origin of replication, a kanamycin resistance gene, and promoter pLux (BBa_R0062) followed by RBS (BBa_B0034) and superfolder green fluorescent protein (sfGFP). In general, for spacer and terminator sequences the parts BBa_B0040 and BBa_B0015 were used, respectively. The second plasmid contained the pBR322 origin (pMB1), which yields a stable two-plasmid system together with p15A, an ampicillin resistance gene, and one of three promoters chosen from the Anderson promoter collection followed by luxR (BBa_C0062). The detailed regulator construct design and full sequences (piG0041, piG0046, piG0047) are [http://2014.igem.org/Team:ETH_Zurich/lab/sequences available here]. Experimental Set-UpThe above described E. coli TOP10 strains were grown overnight in Lysogeny Broth (LB) containing kanamycin (50 μg/mL) and ampicillin (200 μg/mL) to an OD600 of about 1.5 (37 °C, 220 rpm). As a reference, a preculture of the same strain lacking the sfGFP gene was included for each assay. The cultures were then diluted 1:40 in fresh LB containing the appropriate antibiotics and measured in triplicates in microtiter plate format on 96-well plates (200 μL culture volume) for 10 h at 37 °C with a Tecan infinite M200 PRO plate reader (optical density measured at 600 nm; fluorescence with an excitation wavelength of 488 nm and an emission wavelength of 530 nm). After 200 min we added the following concentrations of inducers (3OC6-HSL, 3OC12-HSL, and C4-HSL): 10-4 nM and 104 nM (from 100 mM stocks in DMSO). Attention: All the dilutions of 3OC12-HSL should be made in DMSO in order to avoid precipitation. In addition, in one triplicate only H2O was added as a control. From the the obtained kinetic data, we calculated mean values and plotted the dose-response-curves for 200 min past induction. Characterization of the promoter's sensitivity to 3OC6-HSL depending on LuxR concentrationThe amount of regulator LuxR (BBa_C0062) in the system was shown to influence the pLux promoter's response to the inducer concentration (3OC6-HSL). By using the three different constitutive promoters BBa_J23100, BBa_J23109, and BBa_J23111 for the production of LuxR we have measured this effect in terms of fluorescence (see Figure 1). ResultsThe measurements of the induced system with 3OC6-HSL concentrations of 10-13 M to 10-5 M showed an increasing sensitivity of the pLux (BBa_R0062) promoter (in terms of fluorescence per OD600) for increasing strength of the promoter controlling LuxR (BBa_C0062) expression. For BBa_J23100 (strongest promoter chosen) the sensitivity is highest (half maximal effective concentration EC50 approximately 20 pM), for BBa_J23109 (weakest one chosen) the sensitivity is lowest (EC50 approximately 100 pM), with BBa_J23111 (medium) falling between these two but closer to the strong promoter (EC50 approximately 10 nM). Overall, this is in line with the promoter strength given in the Anderson collection and suggests that the sensitivity of the pLux (BBa_R0062) promoter increases with an increase of LuxR (BBa_C0062) expression.
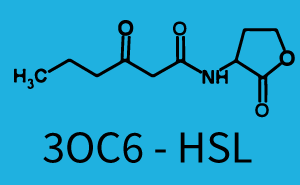
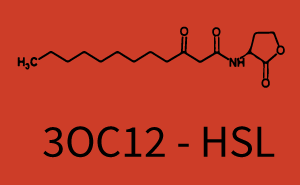
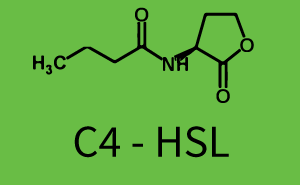
 Figure 1 Effect of varied promoter strength for the expression of LuxR (BBa_C0062) and the resulting change of pLux (BBa_R0062) sensitivity. The fluorescence per OD600 is shown over an inducer-range of 10-13 M to 10-5 M. The promoters used are: BBa_J23100 (high LuxR expression, red), BBa_J23111 (medium LuxR expression, green), and BBa_J23109 (low LuxR expression, blue). All three promoters are part of the Anderson collection. Data points are mean values of triplicate measurements in 96-well microtiter plates 200 min after induction ± standard deviation. For the full data set and kinetics please [http://2014.igem.org/Team:ETH_Zurich/contact contact] us or visit the [http://2014.igem.org/Team:ETH_Zurich/data/raw raw data] page. Characterization of crosstalkBackground informationHere, we focus on the characterization of crosstalk of LuxR with different AHLs and further crosstalk of LuxR-3OC6-HSL with the three promoters - pLux, pLas, and pRhl. In the following, we describe all the different levels of crosstalk we have assessed. First-order crosstalkIn the first order crosstalk section we describe activation of pLux due to LuxR binding to inducers different from 3OC6-HSL or pLux itself binding a regulator-inducer pair different from LuxR-3OC6-HSL. First Level crosstalk: LuxR binds to different AHLs and activates the promoter pLuxIn the conventional system 3OC6-HSL binds to its corresponding regulator, LuxR, and activates the pLux promoter (Figure 2, light blue). However, LuxR can potentially also bind to other AHLs and then activate pLux (Figure 2, 3OC12-HSL in red and C4-HSL in green).  Figure 2 Overview of possible crosstalk of the LuxR/pLux system with three different AHLs. Usually, 3OC6-HSL binds to its corresponding regulator, LuxR, and activates the pLux promoter (light blue). However, LuxR may also bind 3OC12-HSL (red) or C4-HSL (green) and then unintentionally activate pLux. Second Level crosstalk: LuxR binds to 3OC6-HSL, its natural AHL, and activates promoters different from pLuxIn the conventional system 3OC6-HSL binds to its corresponding regulator, LuxR, and activates the pLux promoter (Figure 3 left-hand side, light blue). However, LuxR can potentially also bind to additional cell-cell signaling promoters (Figure 2, pLas in red and pRhl in green) and then activate genes different from the pLux regulated gene of interest .  Figure 3 Overview of possible crosstalk of the regulator LuxR with three different cell-cell signaling promoters. Usually, 3OC6-HSL binds to its corresponding regulator, LuxR, and activates the pLux promoter (light blue). However, LuxR may also bind pLas (red) or pRhl (green) and then unintentionally activate 'off-target' gene expression. Second order crosstalk: Combination of both cross-talk levelsThe second order crosstalk describes unintended activation of a cell-cell signaling promoter by a mixture of both the levels described above. The regulator LuxR binds an inducer different from 3OC6-HSL and then activates a promoter different from pLux. For example, the inducer C4-HSL (green), usually binding to the regulator RhlR, could potentially interact with the LuxR regulator (light blue) and together activate the promoter pLas (red). This kind of crosstalk is explained in Figure 3.  Figure 3 Overview of possible crosstalk of the pLas promoter with both the regulator and inducer being unrelated to the promoter and each other. Usually, LasR together with inducer 3OC12-HSL activate their corresponding promoter pLas (red). However, pLas may also be activated by another regulator together with an unrelated inducer. For example, the inducer C4-HSL (green) may interact with the LuxR regulator (light blue) and together activate pLas (red). Results
Modeling crosstalkEach experimental data set was fitted to an Hill function using the Least Absolute Residual method.  The fitting of the graphs was performed using the following equation :
| ||||||||||||||||||||||||||||||||||||


|
•••••
SUN(Tsinghua) |
Part was sequenced and functional. LuxR was used in our Portable Pathogen Detector. |
|
•••••
wmholtz |
Using this part, I have successfully constructed and tested a quorum sensing circuit in E. coli. |
|
•••••
Youri |
This part was used and tested as a subpart in K546000, K546001, K546002, K546003, K546005 and K546546. This part functioned in all cases. |
|
Kevin (iGEM Braunschweig 2013) |
The plasmid pSB1C3 BBa_C0062 from the 2013 distribution Kit was transformed in E. coli XL1 BlueMRF. Sequencing with standard verification primer VF2 confirmed matching sequence of backbone DNA up to the EcoRI restriction site. The rest of the sequence (not shown) does not match the registry entry.
                   96                                             145
pSB1C3 LuxR   (96) GAGGCAGAATTTCAGATAAAAAAAATCCTTAGCTTTCGCTAAGGATGATT
  C0062 VF2    (1) GAGGCAGAATTTCAGATAAAAAAAATCCTTAGCTTTCGCTAAGGATGATT

                   146                                            195
pSB1C3 LuxR  (146) TCTGGAATTCGCGGCCGCTTCTAGAGATGAAAAACATAAATGCCGACGAC
  C0062 VF2   (51) TCTGGAATTCGACGCAA-TGGGTGCGCTGTCTACTAAATACAACGACACC

                   196                                            245
pSB1C3 LuxR  (196) ACATACAGAATAATTAATAAAATTAAAGCTTGTAGAAGCAATAATGATAT
  C0062 VF2  (100) CCGGAAAAAGCCTCCCGTACTTACGACGCTCACCGTGACGGTTTCGTTAT

                   246
pSB1C3 LuxR  (246) TAATCAATGC...
  C0062 VF2  (150) CGCTGGCGGC...
A restriction assay (Figure 1) showed that the sequenced part has no XbaI restriction site following the EcoRI site indicating another part in front of BBa_C0062 with a length of at least 1000 bp.
|

|
•
Wenwen Lin (2017 SiCAU-China) |
This year we used LuxR as a activation transcrition factor in our positive feedback detector. unfortunately, the LuxR can not work as our expection. So, A constitutive promoter (J23110) was selected to express LuxR, and the pluxR (R0061) was construted to promote GFPmut3b (E0040). We used it to test LuxR by adding AHL at different time (in E.coli BL21) It was obvious to find that the LuxR could not work well after culturing E.coli for a certain time. And we also could see that the promoter pluxR has a strong background express compared to blank group.
|

UNIQdb39b6b8b08c9cf2-partinfo-00000008-QINU