Part:BBa_J23109
constitutive promoter family member
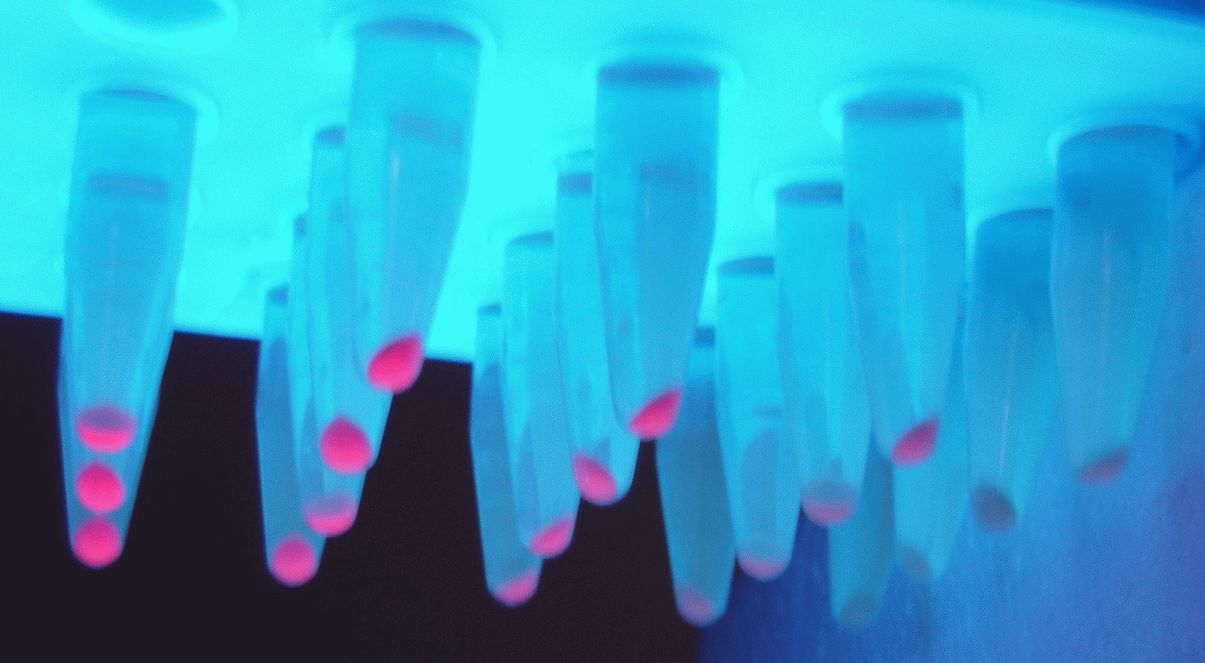
Variant RFP (au) J23112 1 J23103 17 J23113 21 J23109 106 J23117 162 J23114 256 J23115 387 J23116 396 J23105 623 J23110 844 J23107 908 J23106 1185 J23108 1303 J23118 1429 J23111 1487 J23101 1791 J23104 1831 J23102 2179 J23100 2547 |
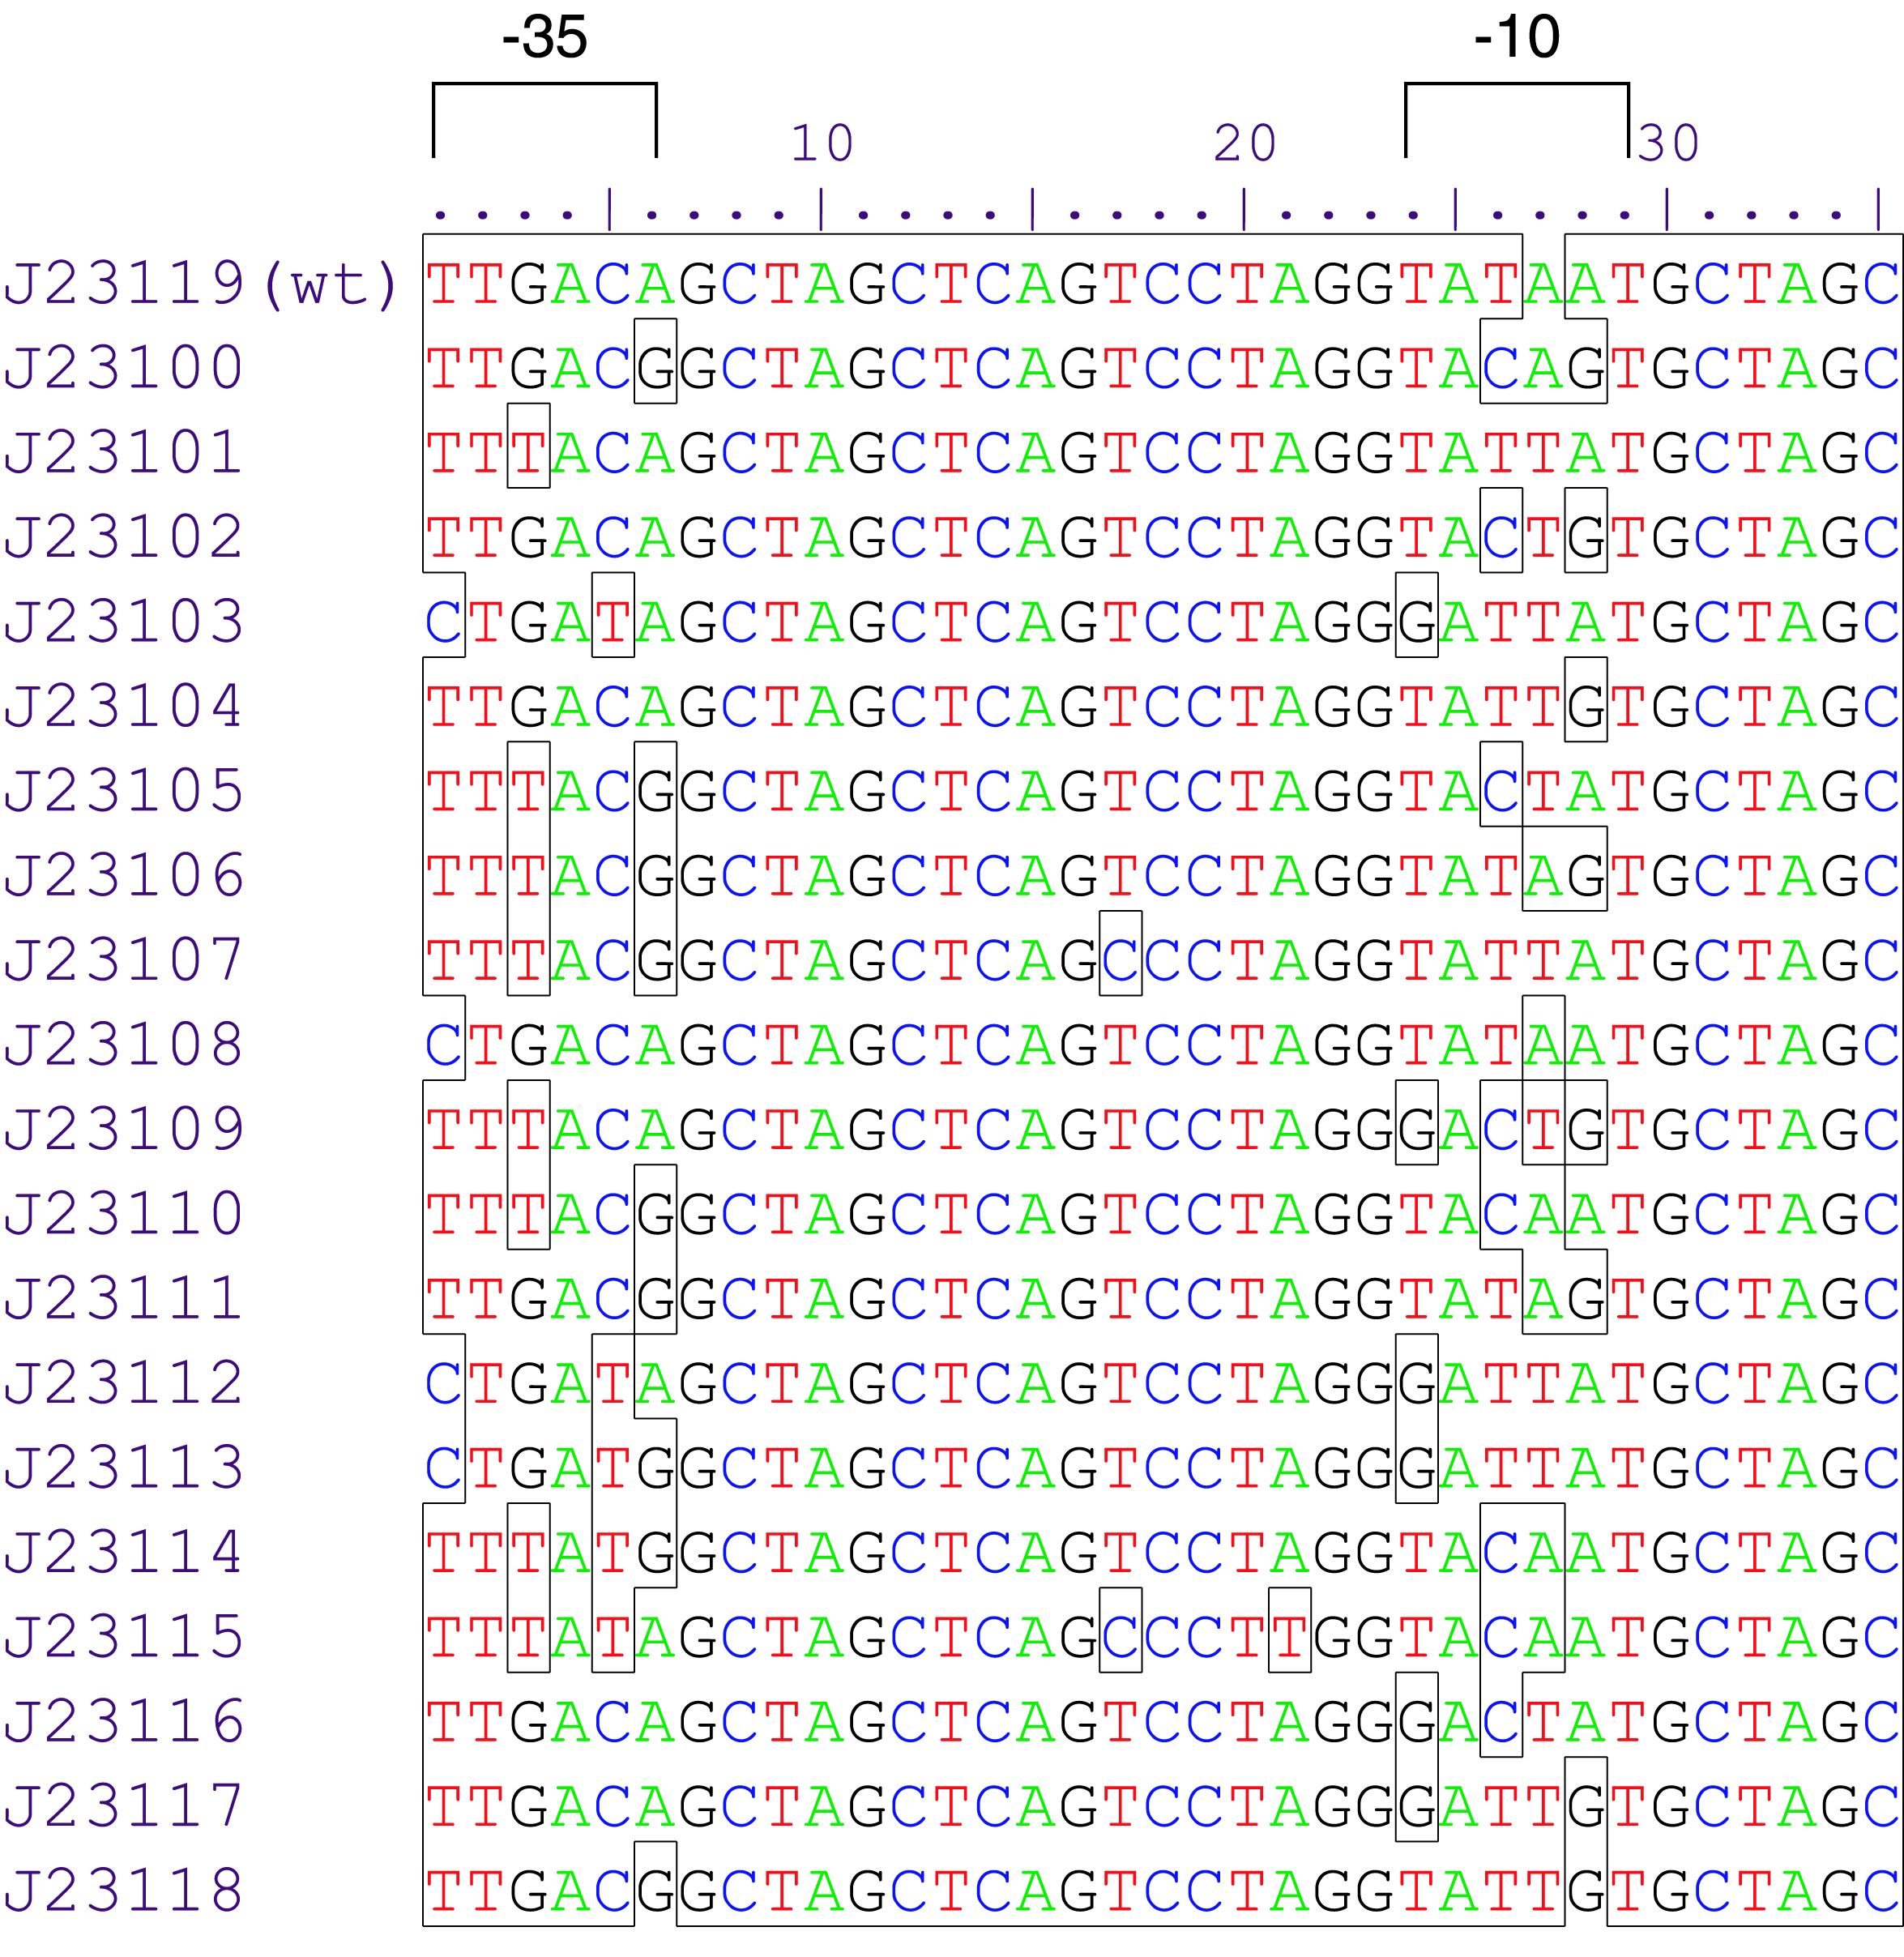
Constitutive promoter family
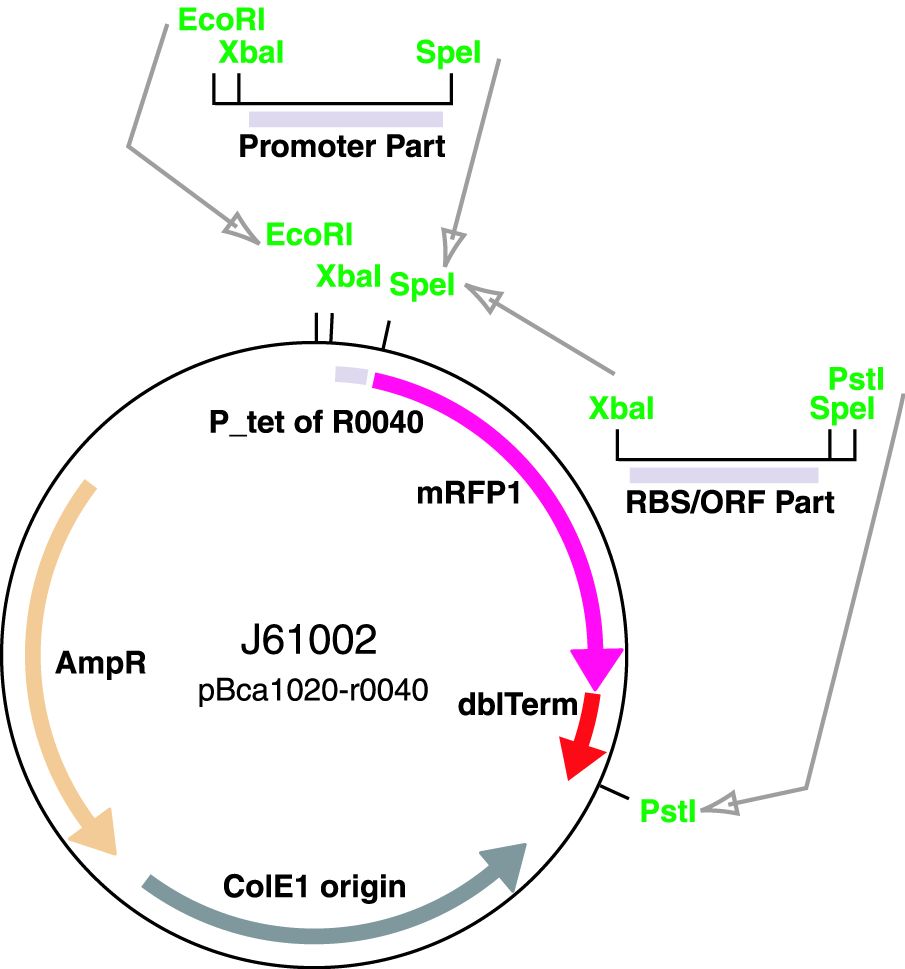
Parts J23100 through J23119 are a family of constitutive promoter parts isolated from a small combinatorial library. J23119 is the "consensus" promoter sequence and the strongest member of the family. All parts except J23119 are present in plasmid J61002. Part J23119 is present in pSB1A2. This places the RFP downstream of the promoter. Reported activities of the promoters are given as the relative fluorescence of these plasmids in strain TG1 grown in LB media to saturation. See part BBa_J61002 for details on their use.
These promoter parts can be used to tune the expression level of constitutively expressed parts. The NheI and AvrII restriction sites present within these promoter parts make them a scaffold for further modification. JCAraw
Sequence and Features
- 10COMPATIBLE WITH RFC[10]
- 12INCOMPATIBLE WITH RFC[12]Illegal NheI site found at 7
Illegal NheI site found at 30 - 21COMPATIBLE WITH RFC[21]
- 23COMPATIBLE WITH RFC[23]
- 25COMPATIBLE WITH RFC[25]
- 1000COMPATIBLE WITH RFC[1000]
Functional Parameters
Relative promoter strength estimates (see [http://2009.igem.org/Team:Groningen/Promoters this page] from Groningen 2009):
| Reference | Strength |
|---|---|
| BBa_J23100 | 0.015 |
| BBa_J23106 | 0.031 |
iGEM 2020 QHFZ-China, new documentation (For Bronze)
Group: QHFZ-China iGEM 2020
Author: Yixian Yang
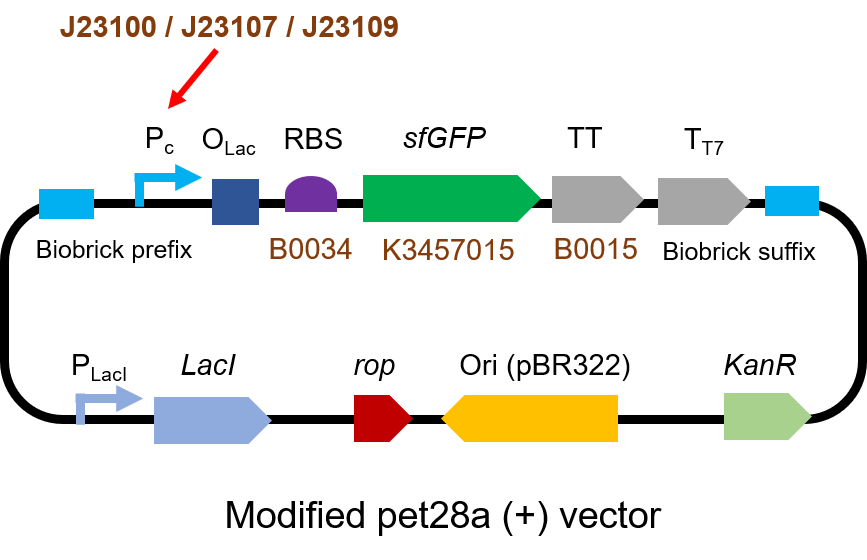
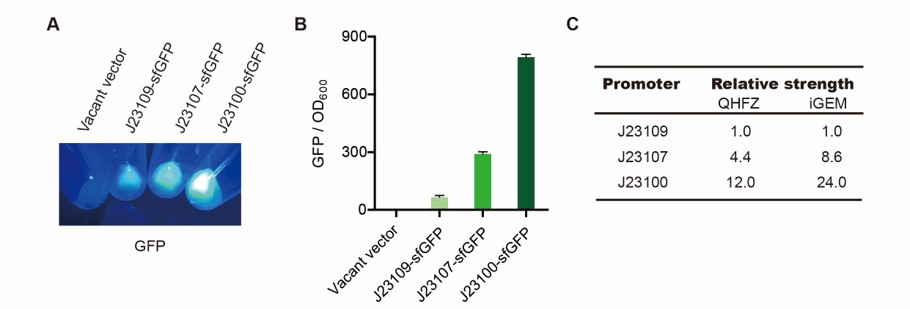
We measured BBa_J23100, BBa_J23107 and BBa_J23109 as a strong, moderate and weak promoter respectively in 2020. For all the experiments below, we use E. coli BL21(DE3) strain.
Part 1: Measurement with a reprter, sfGFP
Description
First, we measured the strength of the promoter by sfGFP BBa_K3457015.
Protocol
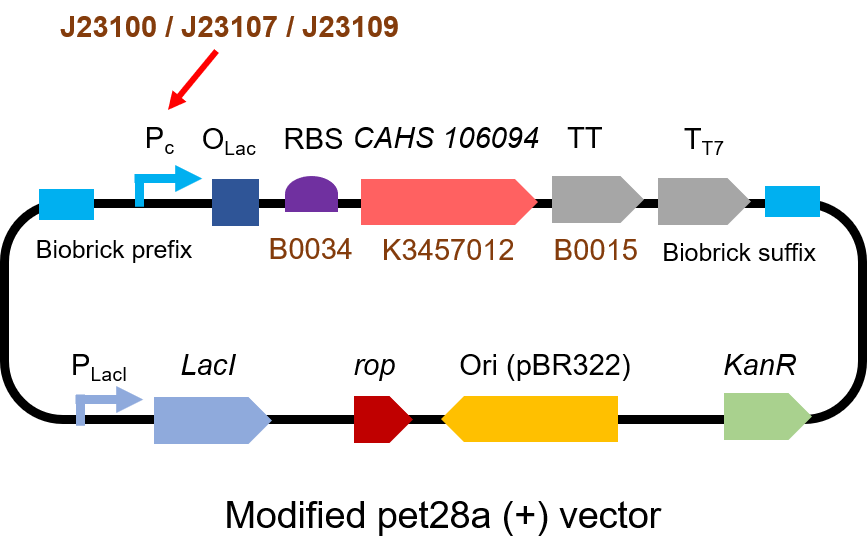
The gene circuit we used is as below:
The protocol is as below:
(1) Pick clones which are in good condition and put them into 500 μL LB medium containing antibiotics. Shake them to
grow at 37℃ for 5~7 hours until the bacteria solution becomes turbid.
(2) Add 2mM iPTG into 3 mL LB medium containing antibiotics. Add 3 μL of the bacteria solution mentioned in step 1
to dilute the bacteria by the ratio of 1:1000. Shake the solution to grow the bacteria at 37℃ overnight.
(3) The bacteria solution was centrifuged and the LB medium was removed. Then the bacteria was resuspended by PBS.
100 μL such solution was put into a well of a 96-well palte. The GFP fluorescence and OD600 were detected
by a microplate readers (Bio-Teck). The parameters are: exciting light: 488 nm, light reception: 520 nm, gain: 50.
(4) The value of PBS was deducted from the result above. GFP / OD600 was calculated.
Result
We set the strehgth of J23109 as 1. The relative strengths of J23107 and J23109 were 4.4 and 12.0. Though they are not the same as the data at the top of this page, they worked well anb the strength order of the three promoters was accordance was consistent with other people's data. The difference may owe to the certain gene circuit and protocol.
Part 2: Measurement with CHAS 106094
Description
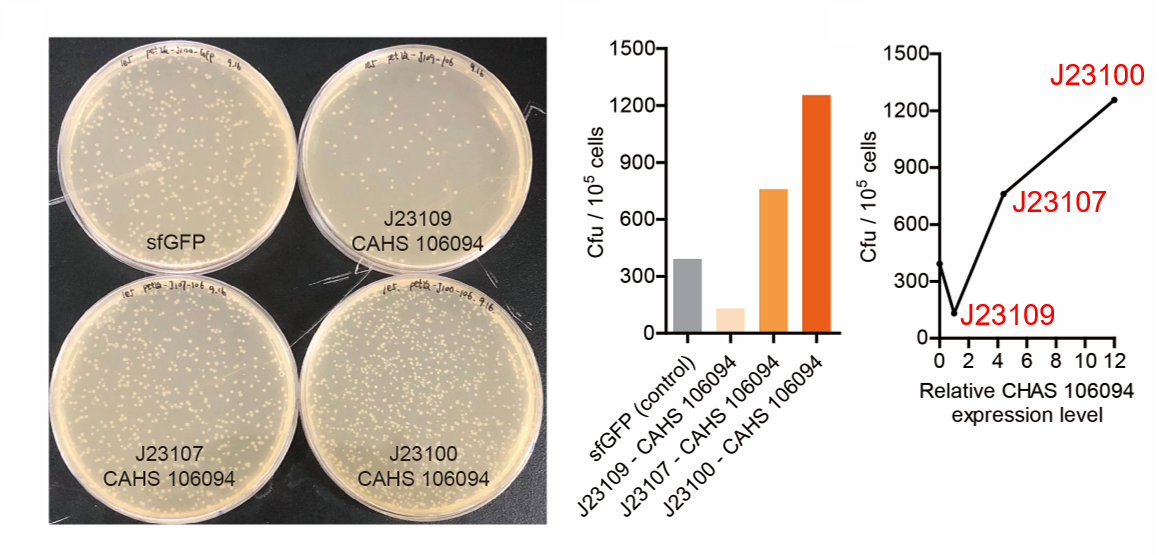
Second, we measured the strength of the promoter by CAHS 106094 BBa_K3457012. This year, we used CAHS 106094 to protect bacteria from freeze-drying and dry storage. We used different promoters to adjust the expression level of CAHS 106094, to study the relationship between the survival rate and CAHS 106094 expression level.
Protocol
The gene circuit we used is as below:
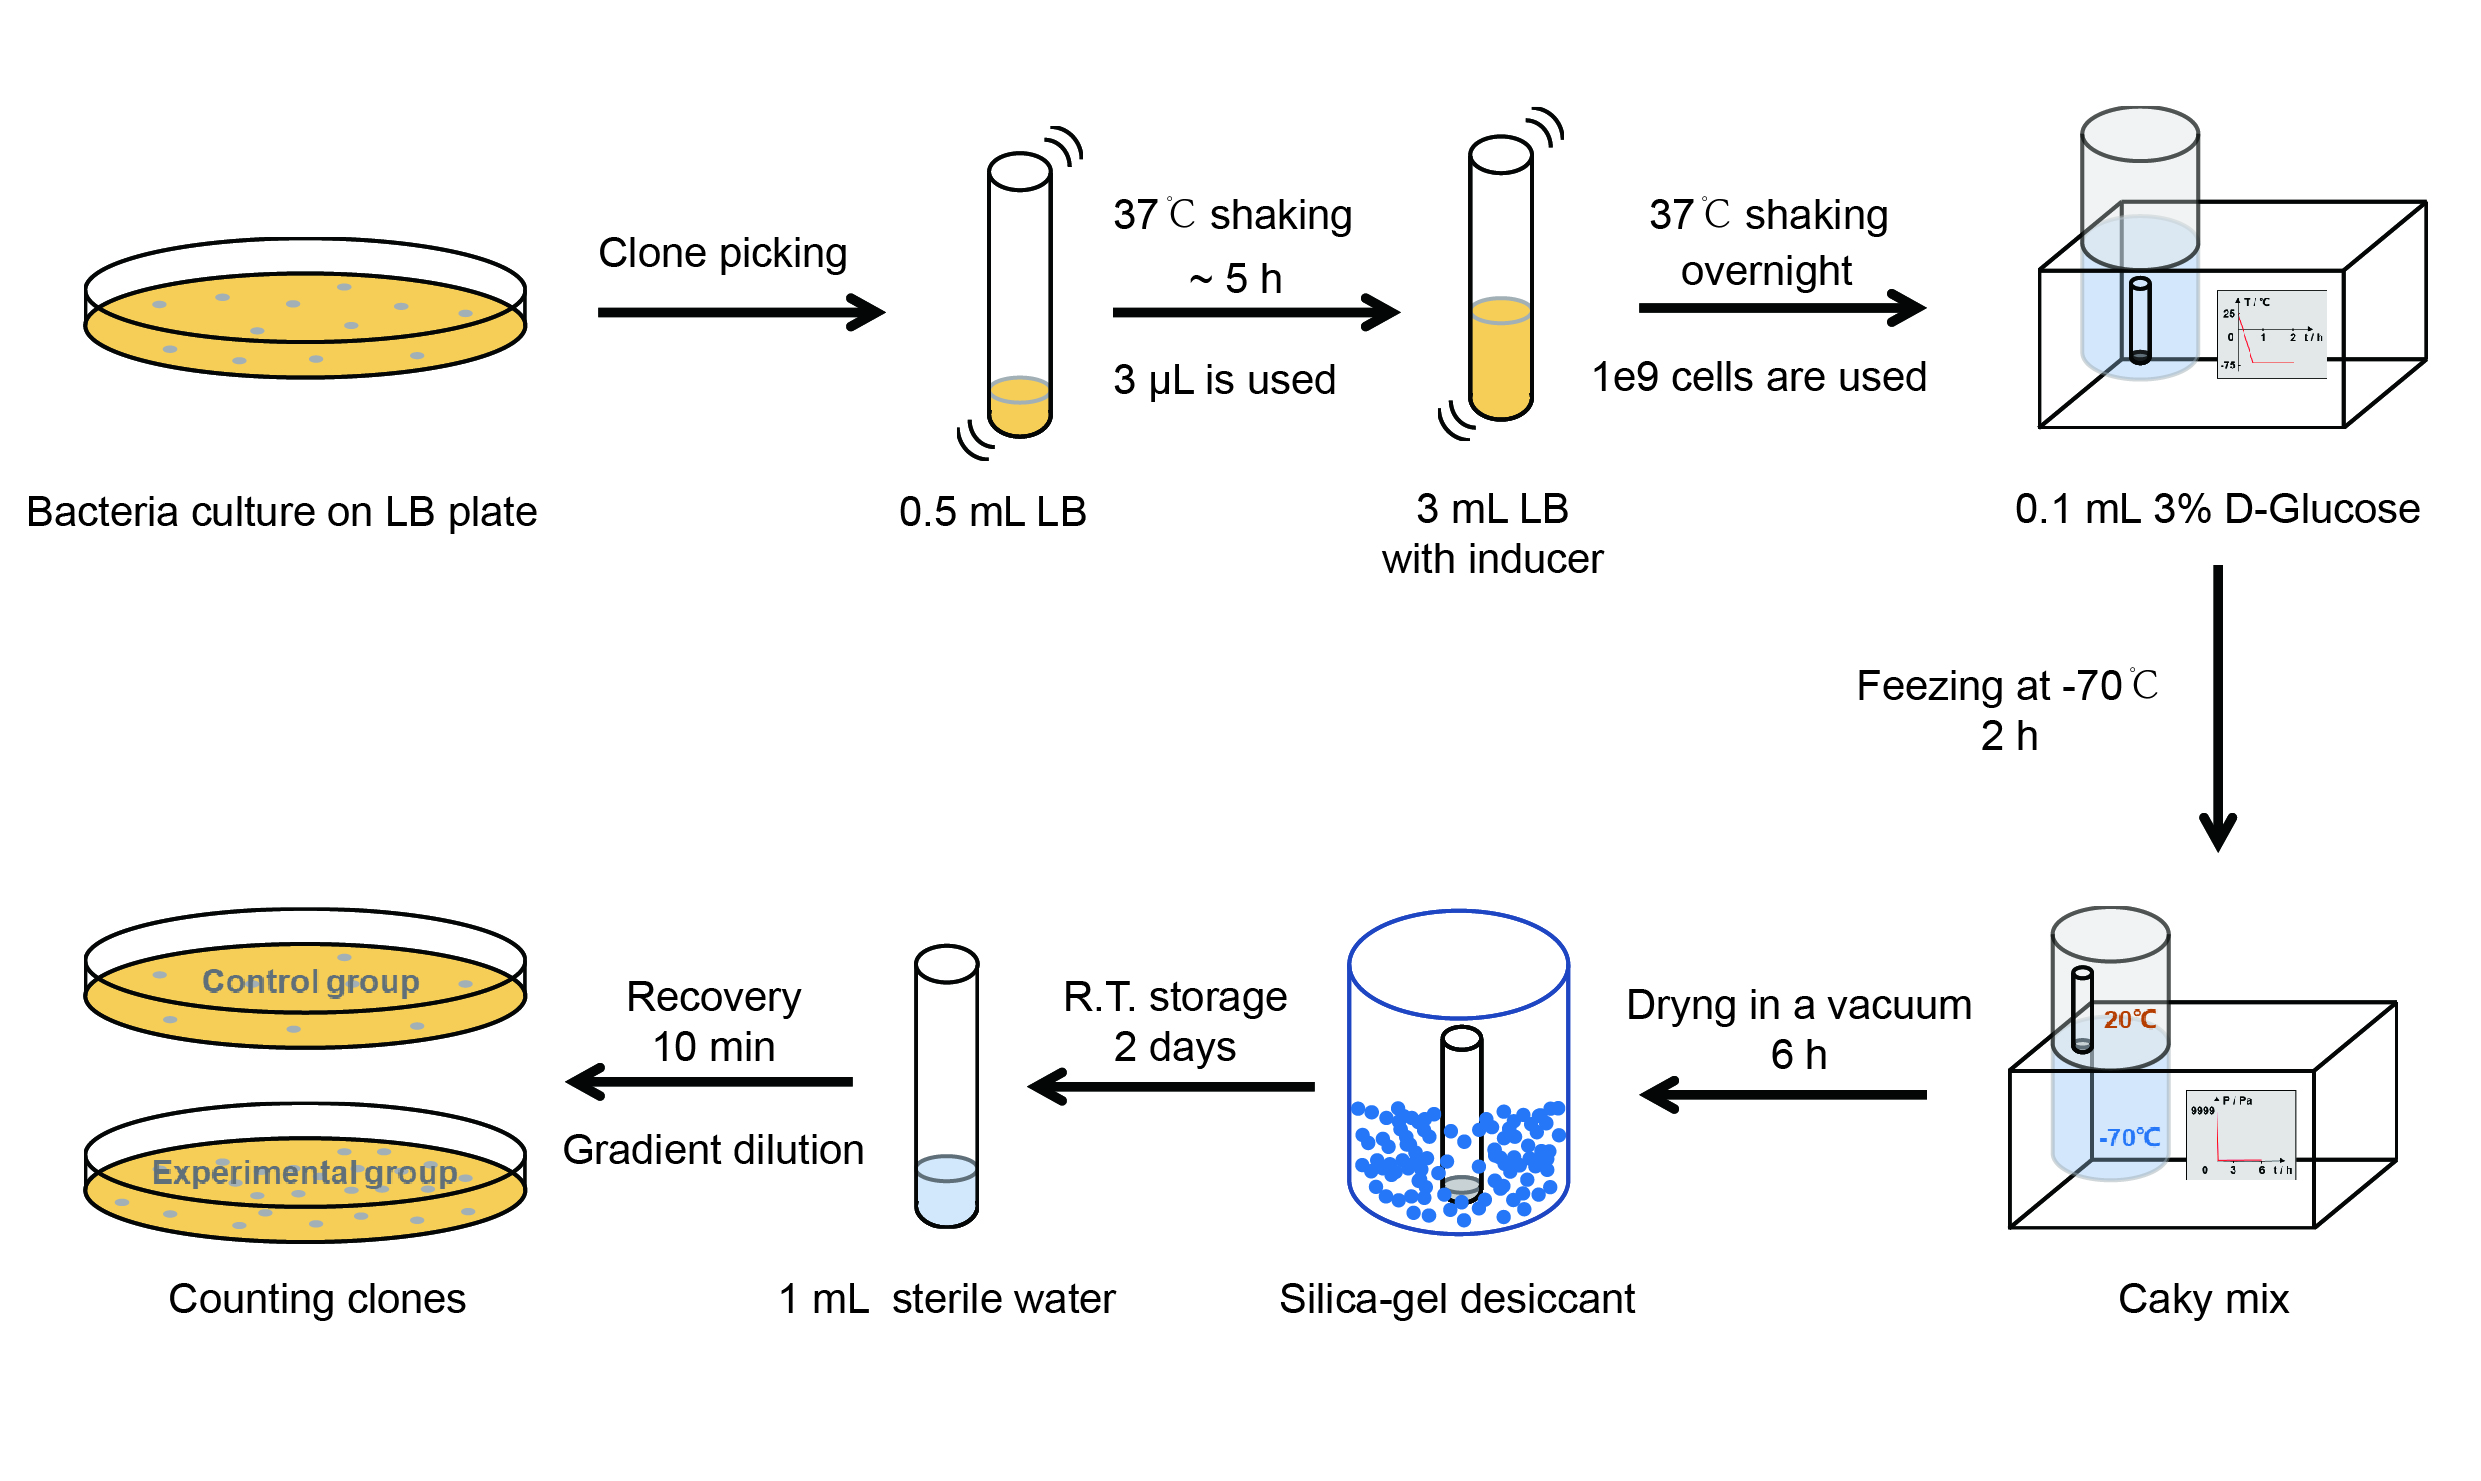
The protocol is as below:
【Day 1】Induction culture
(1) Pick clones which are in good condition and put them into 500 μL LB medium containing antibiotics. Shake them to
grow at 37℃ for 5~7 hours until the bacteria solution becomes turbid.
(2) Add 2mM iPTG into 3 mL LB medium containing antibiotics. Add 3 μL of the bacteria solution mentioned in step 1
to dilute the bacteria by the ratio of 1:1000. Shake the solution to grow the bacteria at 37℃ overnight.
【Day 2】Freeze-dried
(1) If fluorescence induced by the iPTG is detectable in the control group (GFP), continue conducting the
experiment.
(2) Use spectrophotometer to measure the OD600 of the bacteria solution, OD600 = 1 equals to
109 cells. If the OD600 value is between 0.1 and 1, There is a linear relationship between
OD600 and bacterial density. Calculate the volume of bacterial solution for 109 cells by using
the formula V = 100 / (OD600 × Dilution ratio).
(3) Take out a measured amount of 109 cells and centrifuge it at 8000 rpm for 3 min. Then pour out the
supernatant.
(4) Resuspend the bacteria in a 15 mL tube with pre-refrigerated 100 μL 3% glucose solution.
(5) Take off the cover of the tube and put the bacteria into the cold trap. Open the compressor of the
lyophilization machine and freeze the shake tube for 2 h at -70℃.
(6) Put the caky bacteria solution into the drying chamber of the lyophilization machine. Open the vacuum pump to
dry it in vacuum for 6h at 1 Pa vacuum degree.
(7) Turn off the vacuum pump, place it at seal box filled with silica-gel desiccant a for 2 days at room
temperature.
【Day 3】Room temperature storage
【Day 4】Detect the survival rate
(1) Add 1 mL of sterile water to the tube, vortex for 15 s, placed it at room temperature for 10 min.
(2) Adjust the density of the bacteria solution by gradient dilution, then spread 100 μL of the bacteria solution on
the LB plate.
(3) If the density above is not suitable, take 100μL of the solution and spread it on the LB plate after several
gradient dilutions.
(4) Culture the bacteria overnight at 37℃.
【Day 5】Cell Count
(1) Take out the LB plate and take photos to record experimental results.
(2) Use the automatic cell counting function of Image J to count the colone number on the LB plate, then compare the
results between each group.
Result
As expected, J23100 is the strongest promoter and it gave the best survival rate. J23107 is the second and J23109 seemed too weak to express enough CAHS 106094. In conclusion, J23100 and J23107 is effective in this situation, but J23109 is not.
Functional Parameters: Austin_UTexas
Burden Imposed by this Part:

Burden is the percent reduction in the growth rate of E. coli cells transformed with a plasmid containing this BioBrick (± values are 95% confidence limits). This BioBrick did not exhibit a burden that was significantly greater than zero (i.e., it appears to have little to no impact on growth). Therefore, users can depend on this part to remain stable for many bacterial cell divisions and in large culture volumes. Refer to any one of the BBa_K3174002 - BBa_K3174007 pages for more information on the methods, an explanation of the sources of burden, and other conclusions from a large-scale measurement project conducted by the 2019 Austin_UTexas team.
This functional parameter was added by the 2020 Austin_UTexas team.
</center>
NYU Abu Dhabi 2024 Characterization
Group:
NYU-Abu-Dhabi 2024 BBa_J23109 was tested as a promoter driving eYFP expression in bacterial colonies at two temperature conditions: 28°C (ambient) and 37°C (heat stress). The promoter activity was measured over time using fluorescence quantification via a plate reader. According to the data in the promoter activity graph, BBa_J23109 exhibited relatively lower fluorescence compared to the other promoters tested, with a clear distinction in its behavior across temperatures. At 28°C, BBa_J23109 demonstrated moderate activity, which was reduced at 37°C, indicating that this promoter may be more sensitive to heat stress, leading to a decrease in its ability to drive expression at higher temperatures. 
Figure 1. Promoter activity of BBa_J23109 at 28°C and 37°C. </center>
USTC_2009's MEASUREMENT

Characterization in a cell free system - BOKU-Vienna 2020
The main goal of this series of experiments was to compare the expression strength of 3 constitutive promoters when used in a cell free expression system.1 This expression system includes the core RNA polymerase and sigma 70 transcription factor. Three closely related promoters of well documented expression strength controlled by sigma 70, as well as a single terminator (T_B1001) were chosen, as described in the parts section. The promotores are: BBa_J23101 for better readability called “101”, BBa_J23105 “105” and BBa_J23109 “109”. To accurately measure expression strength the fluorescent protein mCherry was utilized as the expressed protein, as one can deduct expression strength based on fluorescence measurements. The complex of promotor, gene and terminator was then assembled via Golden Gate cloning into the Golden Gate backbone 02, which additionally contains an Ampicillin resistance gene as a selection marker:
| Reaction Mix | Master Mix | |
|---|---|---|
| x1 | x5 | |
| [μL] | [μL] | |
| BB2_AB_14 [40 nM] | 1 | 5 |
| BB1_Prom (101/105/109) [40 nM] | 1 | - |
| BB1-mCherry [40 nM] | 1 | 5 |
| BB1-Term [40 nM] | 1 | 5 |
| Cutsmart buffer2 | 2 | 10 |
| ATP | 2 | 10 |
| BbsI - HF [20 U/µL] | 2 | 10 |
| T4 ligase [120 U/µL] | 0.25 | 1.25 |
| H2O | 9.75 | 48.25 |
| total volume | 20 | 95 |
With this assembled plasmid, a transformation was carried out. The transformation was then distributed on Agar plates lazed with Ampicillin as a selection marker. From these plates colonies were picked to prepare liquid overnight cultures, from which the DNA was purified using Miniprep kits.3 The success of the Golden Gate Cloning was then confirmed utilizing restriction digests as well as outsourced sequencing.
Experimental setupDue to the small volume of cell free system expression reactions (~20 µL), it would not have been feasible to take samples over time comparable to a fermentation process. Instead several reactions were set up at different time intervals in order to get an as accurate as possible picture of the fluorescence development over the timeframe in question. To increase the validity of the experiment, doublets were prepared. The reactions consisted of the following components:
| Table 1. Components of assay 1 | Volume [µL] |
|---|---|
| myTXTL® Sigma 70 Master Mix | 9 |
| Plasmid DNA [10,8 nM] | 9 |
| Table 2. Components of assay 2 | Volume [µL] |
|---|---|
| myTXTL® Sigma 70 Master Mix | 15 |
| Plasmid DNA [20 nM] | 5 |
Results
The measured fluorescence is presented in fluorescence units [FU].
Table 3. Fluorescence of mCherry at assay 1:
| Time [h] | 101[FU] | 105[FU] | 109[FU] |
|---|---|---|---|
| 1.3 | 8.0 | 6.5 | 6.0 |
| 2.8 | 7.5 | 6.5 | 6.0 |
| 4.8 | 28.0 | 6.5 | 6.0 |
| 8.0 | 57.0 | 14.0 | 7.0 |

The data clearly shows that the respective expression strength in E. coli (101>105>109) remains the same in this cell free expression system.4 However, the difference between 101 compared to 105 and 109 is far more pronounced than the difference between 105 and 109. To see the differences better, especially between 105 and 109, a second experiment was carried out. For this, plasmid DNA with higher concentration was produced. Through this, a higher concentration of cell free reaction mix was possible. The different parameters can be seen in table 2 compared to table 1.
Table 4. Fluorescence of mCherry at assay 2:
| Time [h] | 101[FU] | 105[FU] | 109[FU] |
|---|---|---|---|
| 3.45 | 534 | 7.5 | 6 |
| 5.03 | 937 | 9.5 | 5.5 |
| 7.45 | 1310.5 | 18.5 | 4.5 |
| 9.45 | 1082 | 19 | 5.5 |

Interestingly, a drop-off in fluorescence past 7.5 hours can be seen for 101. This might be the result of experimental errors and different operators. This seems as a more coherent explanation than a decay of protein. Even though the incubation time was longer and the concentration of the cell free expression system higher, the difference between 105 and 109 is hardly visible. In fact, 109 showed no activity at all as can be seen in table 4.
Conclusion
To produce a notable amount of a protein of interest, the promoter 101 seems to be the best choice. 105 shows some activity compared to 109 which produced no measurable amount of protein. This result seems valid. However, this result is meaningful for this very expression system.
1myTXTL® Sigma 70 Master Mix Kit
250 mM Potassium Acetate, 20 mM Tris-acetate, 10 mM Magnesium Acetate, 100 µg/ml BSA
3Monarch Plasmid Miniprep Kit
4https://parts.igem.org/wiki/index.php?title=Part:BBa_J23101
iGEM 2022 SHSBNU_China, new documentation (For Bronze)
<b>Group: SHSBNU-China iGEM 2022</b>
<b></b>
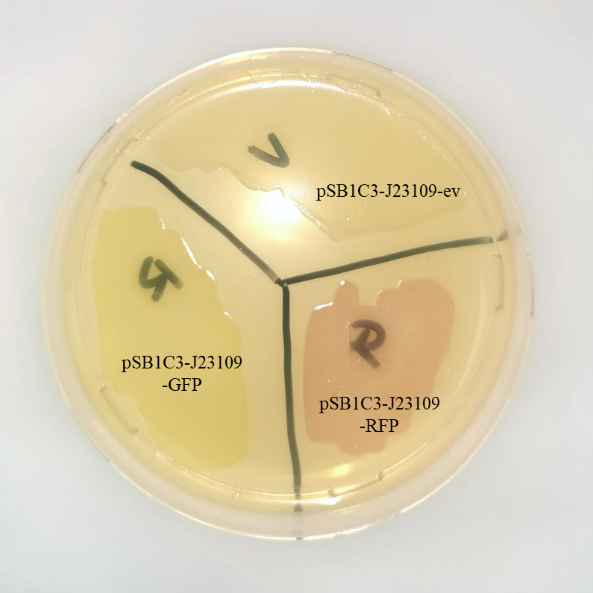
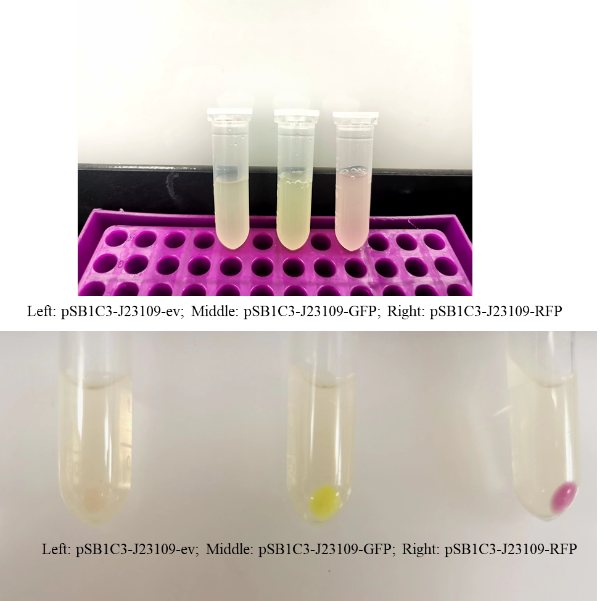
<p> This year, we also studied the expression of J23109 series promoters. According to the sequences submitted by previous teams, we constructed three plasmids, PSB1C3-J23109-EV, PSB1C3-J23109-GFP and PSB1C3-J23109-RFP, respectively. Based on this, the expression effect of constitutive promoter J23109 was detected.</p> <p> We transformed the constructed plasmid into E.coli DH5α and saw colonies with different colors on the plate. Furthermore, we also saw different colors in the liquid system after shaking, which was confirmed in the bacteria precipitation later. Therefore, these results indicate that the J23109 constitutive promoter can initiate the expression of downstream genes in E.coli DH5α. </p>
//direction/forward
//promoter/anderson
//regulation/constitutive
//rnap/prokaryote/ecoli/sigma70
| negative_regulators | |
| positive_regulators |

 1 Registry Star