
 1 Registry Star
Part:BBa_C0171:Experience
This experience page is provided so that any user may enter their experience using this part.
Please enter
how you used this part and how it worked out.
Applications of BBa_C0171
User Reviews
UNIQbea38db66fca13f1-partinfo-00000000-QINU
|
••••
ETH Zurich 2014 |
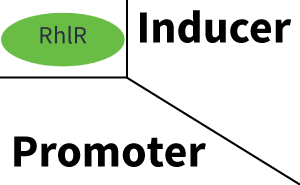
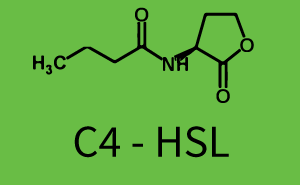
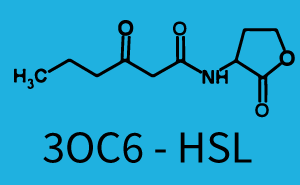
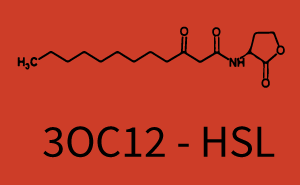
Background informationWe used an E. coli TOP10 strain transformed with two medium copy plasmids (about 15 to 20 copies per plasmid and cell). The first plasmid contained the commonly used p15A origin of replication, a kanamycin resistance gene, and one out of three cell-cell signaling promoters (pLux, pLas, or pRhl) followed by RBS (BBa_B0034) and superfolder green fluorescent protein (sfGFP). In general, for spacer and terminator sequences the parts BBa_B0040 and BBa_B0015 were used, respectively. The second plasmid contained the pBR322 origin (pMB1), which yields a stable two-plasmid system together with p15A, an ampicillin resistance gene, and a strong promoter (BBa_J23100) chosen from the Anderson promoter collection followed by RhlR (BBa_C0179). The detailed construct designs and full sequences (piG0042, piG0058, piG0059,piG0060) are [http://2014.igem.org/Team:ETH_Zurich/lab/sequences available here]. Experimental Set-UpThe above described E. coli TOP10 strains were grown overnight in Lysogeny Broth (LB) containing kanamycin (50 μg/mL) and ampicillin (200 μg/mL) to an OD600 of about 1.5 (37 °C, 220 rpm). As a reference, a preculture of the same strain lacking the sfGFP gene was included for each assay. The cultures were then diluted 1:40 in fresh LB containing the appropriate antibiotics and measured in triplicates in microtiter plate format on 96-well plates (200 μL culture volume) for 10 h at 37 °C with a Tecan infinite M200 PRO plate reader (optical density measured at 600 nm; fluorescence with an excitation wavelength of 488 nm and an emission wavelength of 530 nm). After 200 min we added the following concentrations of inducers (3OC6-HSL, 3OC12-HSL, and C4-HSL): 10-4 nM and 104 nM (from 100 mM stocks in DMSO). Attention: All the dilutions of 3OC12-HSL should be made in DMSO in order to avoid precipitation. In addition, in one triplicate only H2O was added as a control. From the the obtained kinetic data, we calculated mean values and plotted the dose-response-curves for 200 min past induction. Characterization of crosstalkBackground informationHere, we focus on the characterization of crosstalk of regulator RhlR and promoter pRhl with different AHLs and further crosstalk of LasR and inducer 3OC12-HSL with the three promoters - pLux, pLas, and pRhl. Also we describe a combination of the two before mentioned types of crosstalk. First-order crosstalkIn the first order crosstalk section we describe crosstalk of pRhl due to RhlR binding to inducers different from C4-HSL, or pRhl itself binding a regulator-inducer pair different from RhlR-C4-HSL. First Level crosstalk: RhlR binds to different AHLs and activates the promoterIn the conventional system C4-HSL binds to its corresponding regulator, RhlR, and activates the pRhl promoter (Figure 1, green). However, RhlR can potentially also bind other AHLs and then activate pRhl (Figure 1, 3OC6-HSL in light blue and 3OC12-HSL in red).  Figure 1 Overview of possible crosstalk of the RhlR/pRhl system with three different AHLs. Usually, C4-HSL binds to its corresponding regulator, RhlR, and activates the pRhl promoter (green). However, RhlR may also bind 3OC6-HSL (light blue) or 3OC12-HSL (red) and then unintentionally activate pRhl. Second Level crosstalk: RhlR binds to C4-HSL, its natural AHL, and activates promoters different from pRhlIn the conventional system C4-HSL binds to its corresponding regulator, RhlR, and activates the pRhl promoter (Figure 2 right, green). However, RhlR can potentially also bind to additional cell-cell signaling promoters (Figure 2, pLux in light blue and pLas in red) and then activate genes different from the pRhl regulated gene of interest .
 Figure 2 Overview of possible crosstalk of the regulator RhlR with three different cell-cell signaling promoters. Usually, C4-HSL binds to its corresponding regulator, RhlR, and activates the pRhl promoter (green). However, RhlR may also bind pLux (light blue) or pLas (red) and then unintentionally activate 'off-target' gene expression. Second order crosstalk: Combination of both cross-talk levelsThe second order crosstalk describes unintended activation of a cell-cell signaling promoter by a mixture of both the levels described above. The regulator RhlR binds an inducer different from 3OC12-HSL and then activates a promoter different from pRhl. For example, the inducer 3OC6-HSL (light blue), usually binding to the regulator LuxR, could potentially interact with the LasR regulator (red) and together activate the promoter pRhl (green). This kind of crosstalk is explained in Figure 3.
 Figure 3 Overview of possible crosstalk of the pLux promoter with both the regulator and inducer being unrelated to the promoter and each other. Usually, LuxR together with inducer 3OC6-HSL activate their corresponding promoter pLux (light blue). However, pLux may also be activated by another regulator together with an unrelated inducer. For example, the inducer 3OC12-HSL (red) may interact with the RhlR regulator (green) and together activate pLux (light blue). Results
Modeling crosstalkEach experimental data set was fitted to an Hill function using the Least Absolute Residual method.  The fitting of the graphs was performed using the following equation :
| ||||||||||||||||||||||||||||||||||||


|
Antiquity |
This review comes from the old result system and indicates that this part did not work in some test. |
UNIQbea38db66fca13f1-partinfo-00000003-QINU
|
No review score entered. Northwestern 2011 |
The 2011 Northwestern iGEM team used this part as a part of our Pseudomonas Aeruginosa biosensor. We were able to successfully express LasR (C0171) continuously in our system. BBa K575024 |