Regulatory
LasR+PAI

Part:BBa_R0079:Experience

Designed by: Alvin Carter Powers (Fighting Darwins)   Group: Antiquity   (2004-01-27)
Revision as of 14:12, 24 October 2014 by Sumana (Talk | contribs) (First-order crosstalk)

This experience page is provided so that any user may enter their experience using this part.
Please enter how you used this part and how it worked out.

Applications of BBa_R0079

User Reviews

UNIQa9a5d0e5864f84d3-partinfo-00000000-QINU UNIQa9a5d0e5864f84d3-partinfo-00000001-QINU

••••

ETH Zurich 2014

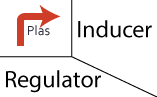
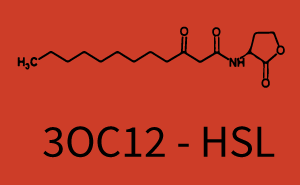
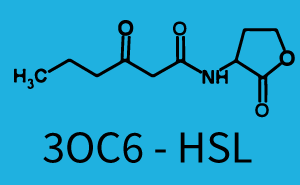
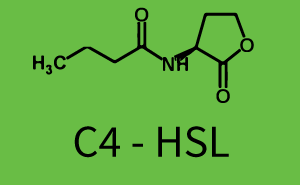
Characterization of two-order crosstalk on the promoter

Background information

The E. coli strain used and the experimental set-up are described above. However, here we focus on the characterization of crosstalk and as a result we used only one, strong promoter (BBa_J23100) controlling the three different regulators (LuxR, LasR, and RhlR) used in the experiments in order to quantify crosstalk with pLas. In the following, we describe all the different levels of crosstalk we have assessed.

First-order crosstalk

In the first order crosstalk section we describe crosstalk of pLas due to LasR binding to inducers different from 3OC12-HSL or pLas itself binding to a regulator-inducer pair different from LasR-3OC12-HSL.

First Level crosstalk: LasR binds to different HSL and activates the promoter

In the conventional system 3OC12-HSL binds to its corresponding regulator, LasR], and activates the pLas promoter (figure 2, red). However, LasR can potentially also bind other AHLs and then activate pLas (figure 2, 3OC6-HSL in light blue and C4-HSL in green).

ETH Zurich 1crosstalkPlas.png

Second Level crosstalk: other regulatory proteins, like LuxR, bind to their natural HSL substrate and activate the promoter

ETH Zurich 2crosstalkPlas.png

Second order crosstalk: Combination of both cross-talk levels

Other regulatory proteins, like LuxR, bind to different HSL and activates the promoter

ETh Zurich 3crosstalkPlas.png

Results

Table 1 Crosstalk matrix for the promoter plas (BBa_R0079)

The promoter of interest in this matrix is pLas. The graph on top left corner shows the induction of pLas by its corresponding inducer (3OC12-HSL) binding the corresponding LasR. The red line shows the model whereas the datapoints shown in red represent the experimental results. The transition can be observed at a concentration of Las-AHL of about 2 nM. 3OC6-HSL binding RhlR does not induce the pLas. For the binding of 3OC12-HSL to RhlR a minor increase of fluorescence can be observed. The same can be observed for 3OC12-HSL binding to the LuxR as this combination is to a small degree inducing pLas. The most significant case of crosstalk when observing pLas is shown in the graph in the center of the matrix. It is clearly shown that 3OC6-HSL (Lux-AHL) binding to the corresponding LuxR regulator is able to induce pLas, resulting in fluorescence values of about 250 a.u.. This is the most severe case of crosstalk observed as the induction of pLas by the corresponding inducer and regulator molecule is not significantly different measured by fluorescence as induction by Lux-AHL binding the LuxR and subsequently pLas. For C4-HSL binding the three regulators LasR, LuxR and RhlR and then the pLas no crosstalk can be observed.

ETH Zurich 2014 qs-table CornerLas.png ETH Zurich 2014 qs-table 3OC12-HSL.png ETH Zurich 2014 qs-table 3OC6-HSL.png ETH Zurich 2014 qs-table C4-HSL.png
ETH Zurich 2014 qs-table LasR.png ETH Zurich 2014 qs-table PlasRef.png ETH Zurich 2014 qs-table PlasLasRLuxAHL.png ETH Zurich 2014 qs-table PlasLasRRhlAHL.png
ETH Zurich 2014 qs-table LuxR.png ETH Zurich 2014 qs-table PlasLuxRLasAHL.png ETH Zurich 2014 qs-table PlasLuxRLuxAHL.png ETH Zurich 2014 qs-table PlasLuxRRhlAHL.png
ETH Zurich 2014 qs-table RhlR.png ETH Zurich 2014 qs-table PlasRhlRLasAHL.png ETH Zurich 2014 qs-table PlasRhlRLuxAHL.png ETH Zurich 2014 qs-table PlasRhlRRhlAHL.png

Modeling crosstalk

Each experimental data set was fitted to an Hill function using the Least Absolute Residual method.

ETHZ HillEq.png

The fitting of the graphs was performed using the following equation :

rFluo = the relative fluorescence (absolute measured fluorescence value over OD)[a.u.]
a = basal expression rate [a.u.](“leakiness”)
b = maximum expression rate [a.u.]("full induction")
n = Hill coefficient (“cooperativity”)
Km = Half-maximal effective concentration (“sensitivity”)
[AHL] = AHL concentration [nM]


Parameters of HillFunction for crosstalk with Plas (with 95% confidence bounds)
3OC12-HSL 3OC6-HSL C4-HSL
LasR a = 5.274 (0, 15.51) [a.u.]
n = 11.67 (0, 3.763e8)
Km = 1.396 (0, 1.504e7) [nM]
b = 189 (162.5, 215.6) [a.u.]
No crosstalk No crosstalk
LuxR No crosstalk a = 3.996 (0, 9.185) [a.u.]
n = 0.5198 (0.2879, 0.7517)
Km = 382.3 (0, 1206) [nM]
b = 261 (155.5, 366.5) [a.u.]
No crosstalk
RhlR No crosstalk No crosstalk No crosstalk


No review score entered. NYMU-Taipei 2009

NYMU 2009-09-29.png We have characterised the strength of the promoters pCI, p22, pLux, pLas relative to pCI. More details are available at the [http://2009.igem.org/Team:NYMU-Taipei/Project/Promoter_Strength_Testing NYMU-Taipei iGEM09 wiki].
;

No review score entered. Northwestern 2011

The Northwestern iGEM team used this part as a unit within our Pseudomonas Aeruginosa biosensor. When this LasR/PAI regulated promoter is induced at varying concentrations of PAI in the presence of excess LasR, we observed GFP fluorescence in accordance with the graph below.


LasR graph.jpg

|};

•••

Tokyo-tech iGEM 2011

Judging from Northwestern iGEM 2011 team's data, in the presence of 3OC12-HSL, fluorescence intensity was about 3-fold higher than that in the absence of 3OC12-HSL.


We improved this part. lasI promoter(BBa_K649000) which we constructed was more successfully regulated by 3OC12-HSL. GFP expression after induction of 3OC12-HSL is 170 times as high as before.

Effect of 3OC12-HSL induction on fluorescence intensity
This work is done by Takuya Tsubaki.


|};


No review score entered. Tsinghua-A 2011

Tsinghua-A 2011 assembled E0840 (BBa_E0840) under the pLas promoter (BBa_R0079) that was contained into K574009 (BBa_K574009). We kept pSB1A2 as the scaffold vector.

K574009 chart.png
From the chart, we can see that cells were hardly induced in the control group, and with the concentration of inducer growing, the intensity of GFP increased by groups. The most efficient concentration of inducer was around 10^-5M, and higher concentration may lead to the expression of GFP decreasing. Additionally, to most groups, the intensity of GFP reached its maxium after 4 hours.
More details are available at the [http://2011.igem.org/Team:Tsinghua-A/Parts Tsinghua-A 2011 Wiki].


•••••

iGEM Dundee 2014

Dundee iGEM 2014 used this lasB promoter region to build a composite part BBa_K1315009. This was designed as a biosensor for Pseudomonas aeruginosa AutoInducer-1 (PAI-1), which was to be used in a bio-electronic device to improve diagnostics for Cystic Fibrosis patients. Details of experimental work are logged on the experience page of BBa_K1315009.