
Difference between revisions of "Part:BBa J23119"
| Line 134: | Line 134: | ||
<center style="text-align:left;"> | <center style="text-align:left;"> | ||
| + | |||
| + | |||
| + | |||
| + | |||
| + | |||
| + | |||
| + | |||
| + | |||
| + | |||
| + | |||
| + | |||
| + | |||
| + | |||
| + | |||
| + | |||
| + | |||
| + | |||
| + | |||
| + | |||
| + | |||
| + | |||
| + | |||
| + | |||
| + | |||
| + | |||
| + | |||
| + | |||
| + | |||
| + | |||
| + | |||
| + | |||
| + | |||
| + | |||
| + | |||
| + | |||
| + | |||
| + | |||
| + | |||
| + | |||
| + | |||
| + | |||
| + | |||
| + | |||
| + | |||
| + | |||
| + | |||
| + | |||
| + | |||
| + | |||
| + | |||
| + | |||
| + | |||
| + | |||
| + | |||
| + | |||
| + | |||
| + | |||
| + | |||
| + | |||
| + | |||
| + | |||
| + | |||
| + | |||
| + | |||
Revision as of 21:38, 21 October 2019
constitutive promoter family member
|
|
Variant RFP (au) J23112 1 J23103 17 J23113 21 J23109 106 J23117 162 J23114 256 J23115 387 J23116 396 J23105 623 J23110 844 J23107 908 J23106 1185 J23108 1303 J23118 1429 J23111 1487 J23101 1791 J23104 1831 J23102 2179 J23100 2547 |


Constitutive promoter family
Parts J23100 through J23119 are a family of constitutive promoter parts isolated from a small combinatorial library. J23119 is the "consensus" promoter sequence and the strongest member of the family. All parts except J23119 are present in plasmid J61002. Part J23119 is present in pSB1A2. This places the RFP downstream of the promoter. Reported activities of the promoters are given as the relative fluorescence of these plasmids in strain TG1 grown in LB media to saturation. See part BBa_J61002 for details on their use.
These promoter parts can be used to tune the expression level of constitutively expressed parts. The NheI and AvrII restriction sites present within these promoter parts make them a scaffold for further modification. JCAraw
Usage and Biology
iGEM16-CLSB-UK:The consensus promoter Part:BBa_J23119 was assembled with AmilCP blue-purple chromoprotein Part:BBa_K592025. The construct Part:BBa_K2078002 was carried on the pSB1C3 plasmid for expression and amplification in E-Coli.

GreatBay_China 2018:
Team GreatBay_China 2018 characterized J23119, Part:BBa_J23105, and Part:BBa_J23101 by assembling them with Part:BBa_B0034 and a sfGFPPart:BBa_I746916 on three vectors: pUC20 (copy number about 500/cell), pR6K (copy number about 15/cell), pSC101 (copy number about 2/cell). Then we measured the fluorescence by Flow Cytometry as a reference for the TALE stabilized promoter library.

The result indicate that the strength of J23119, J23105, and J23101 are about the same as described by team iGEM2006_Berkeley, and the fluorescence increases as the copy number of the vector increases
GreatBay_China have made two improved parts based on J23119.
UP119 is modified by addition of an up-element. (Part:BBa_K2753055)
TALE2 sp6 is a TALE stabilized variant of J23119. (Part:BBa_K2753023)
Sequence and Features
- 10COMPATIBLE WITH RFC[10]
- 12INCOMPATIBLE WITH RFC[12]Illegal NheI site found at 7
Illegal NheI site found at 30 - 21COMPATIBLE WITH RFC[21]
- 23COMPATIBLE WITH RFC[23]
- 25COMPATIBLE WITH RFC[25]
- 1000COMPATIBLE WITH RFC[1000]
>Internal Priming Screening Characterization of BBa_J23119: Has no possible internal priming sites between this BioBrick part and the VF2 or the VR primer.
The 2018 Hawaii iGEM team evaluated the 40 most frequently used BioBricks and ran them through an internal priming screening process that we developed using the BLAST program tool. Out of the 40 BioBricks we evaluated, 10 of them showed possible internal priming of either the VF2 or VR primers and sometime even both. The data set has a range of sequence lengths from as small as 12 bases to as large as 1,210 bases. We experienced the issue of possible internal priming during the sequence verification process of our own BBa_K2574001 BioBrick and in the cloning process to express the part as a fusion protein. BBa_K2574001 is a composite part containing a VLP forming Gag protein sequence attached to a frequently used RFP part (BBa_E1010). We conducted a PCR amplification of the Gag-RFP insert using the VF2 and VR primers on the ligation product (pSB1C3 ligated to the Gag + RFP). This amplicon would serve as template for another PCR where we would add the NcoI and BamHI restriction enzyme sites through new primers for ligation into pET14b and subsequent induced expression. Despite gel confirming a rather large, approximately 2.1 kb insert band, our sequencing results with the VR primer and BamHI RFP reverse primer gave mixed results. Both should have displayed the end of the RFP, but the VR primer revealed the end of the Gag. Analysis of the VR primer on the Gag-RFP sequence revealed several sites where the VR primer could have annealed with ~9 - 12 bp of complementarity. Internal priming of forward and reverse primers can be detrimental to an iGEM project because you can never be sure if the desired construct was correctly inserted into the BioBrick plasmid without a successful sequence verification.
Thessaly 2019 Characterization
Thessaly 2019 sought to characterize the coding sequence of TEM-optimized β-lactamase (BBa_I757010) under the regulation of the constituve Anderson Family promoters BBa_J23100, BBa_J23105, BBa_J23106, BBa_J23119. β-lactamase is an enzyme that hydrolyses β-lactams (e.g. ampicillin) and is naturally found in prokaryotic cells. A colorimetric assay has been developed using nitrocefin as a substrate which after hydrolysis from β-lactamase changes the reaction color, from yellow (380nm) to red (490nm).
To achieve that, the coding sequence was assembled with each promoter, a universal RBS (BBa_B0034) and a double terminator(BBa_B0015). The parts were cloned in pSB1C3 and pSB1K3 and transformed into E. coli DH5a competent cells.
In the photo below you can see the results of the primer addition using overhang PCR:
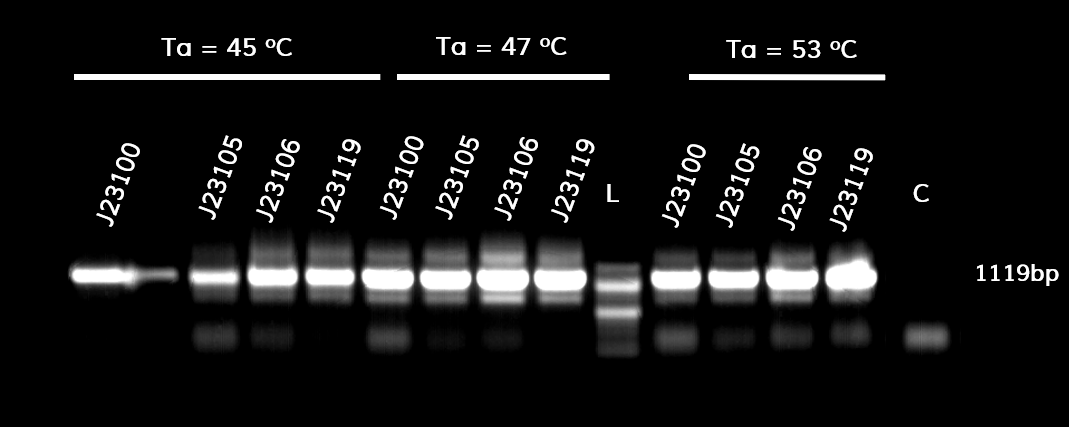
Figure 1. The results obtained after the PCR with the overhang primers for the different promoters of the Anderson family. We tested different annealing temperatures (45, 47 & 53℃) aiming for clear results. The expected band is at 1119bp and the ladder used was the 100bp DNA ladder by NEB.
For protein expression, the plasmids were transformed into E. coli BL21 (DE3) competent cells.
For the beta-lactamase assay, we set up the following experimental design:
1. Grow BL21 (DE3) pre-culture overnight in 5ml LB (~16h) at a shaking incubator, 37 degrees C / 210rpm
2. The following morning, measure the OD600 of overnight cultures
3. Dilute all cultures to OD600¬ = 0.05 in M9 minimal medium
4. Grow cells 37 degrees C /210 RPM until OD600=0.4-0.6 (~2h)
5. Dilute all cells to the same OD600 (e.g. 0.4)
6. Load 160 of culture in a 96-well plate (do triplicates). Add 40 ul 0.5 uM nitrocefin for a final concentration of 100nM
7. Measure the absorbance at 490nm (for nitrocefin hydrolysis) and 600nm (for cell growth) every 30 seconds for 2 hours in a microplate reader. Shake between readings. Because plateau was reached within the first 30 minutes of the reaction, only those are depicted in the graph.
To ensure that the absorbance shown corresponds only to enzymatic activity by β-lactamase, we included 3 controls in the experiment. The first control has M9 medium only (no cells) and nitrocefin, the second has empty BL21 (DE3) cells (no plasmid) and nitrocefin, while the third has BL21 (DE3) cells containing the plasmid but not the part (empty plasmid). To obtain comparable results, we normalized all values by dividing OD490 by OD600.
The results are shown in the graph below

Figure 2. The hydrolysis of nitrocefin enabled by the expression of the β-lactamase gene, under the control of different promoters (J23100, J23105, J23106 & J23119) of the Anderson family. The substrate (nitrocefin) hydrolysis (490nm) is divided by cell growth (600nm), in order to normalize all values.
The maximum expression of β-lactamase was observed under control of the J23119 (brown line) which is the wild type promoter of the Anderson family. The expression is reduced with the J23100 and J23106 (yellow and purple line respectively), while the lowest expression levels were observed with the J23105 promoter (blue line). These results are in accordance with those from previous teams that measured fluorescence and the same pattern is observed. The controls conditions (pSB1C3 and BL21, or light purple and light blue respectively) confirm that the absorbance measured derives from β-lactamase activity only, both quantitatively and visually.
Below you can see the 96-well plate of the assay:

Figure 3.The observed color change due to the hydrolyzation of nitrocefin due to the production of β-lactamase, after a 2-hour enzymatic assay.
Note that the picture was taken after the plate-reader assay was completed and all conditions had reached a plateau, except the controls.
Characterization of combination of J23119 and strong RBSes
Our team tested several constitutive promoters and rbs combinations for the continuous expression of PET degradation enzymes in E. coli. The J23100 promoter did not work under our experimental conditions. So we found another promoter and J23119 was one of the constitutive promoter candidates. We combined three strong RBSs with this promoter and measured the expression of mScarlet. E. coli transformed with each plasmid was grown under the same conditions and harvested. Escherichia coli expressing mScarlet was sonicated in sonication buffer and the supernatant was transferred to a new e-tube after centrifugation at 4 ° C for 5 min at maximum speed. We measured the absorbance at 569 nm, the maximum absorption wavelength of mScarlet, and at 280 nm for total protein quantification using nanodrops. The experiment was repeated three times and plotted using prism. These results show that RBS derived from the pDawn vector is important for the expression of mScarlet.


RBS
After an attempt to clone this promoter upstream of the Citrine reporter gene yielded poor expression, the Yale iGEM teaminspected the Ribosome Binding Site used with the promoters and realized that it would need to be improved. We used the Salis Lab Ribosome Binding Site Calculator to design a stronger Ribosome Binding Site.

Below, we demonstrate that the newly designed Ribosome Binding Site is appropriately compatible with the Anderson Promoter collection.


Characterization: Jilin_China 2019
Group:
Jilin_China 2019
We hope that when we use an unrepresentated promoter, we can easily and accurately get its relative strength in the already characterized promoter family.
Therefore, we constructed the promoter strength measurement vector BBa_K3078100 and characterized the promoter with a large intensity gradient of the Anderson promoter family, BBa_J23119, BBa_J23104, BBa_J23108, BBa_J23105, BBa_J23114, and it is expected to establish a standard curve with fluorescence intensity.

Figure 1. The fluorescence of each promoter changes with time (fluorescence / OD600). Different elements are connected to the same measurement carrier, cultured overnight, diluted to OD = 0.02 the next day, and the fluorescence at absorption wavelength 528nm was measured under excitation wavelength 485nm light.
Table 1. Reported relative expression and corrected relative expression. We calculated the relative fluorescence intensity of each promoter for it based on J23119.
