
 1 Registry Star
Part:BBa_J23105
constitutive promoter family member
|
|
Variant RFP (au) J23112 1 J23103 17 J23113 21 J23109 106 J23117 162 J23114 256 J23115 387 J23116 396 J23105 623 J23110 844 J23107 908 J23106 1185 J23108 1303 J23118 1429 J23111 1487 J23101 1791 J23104 1831 J23102 2179 J23100 2547 |


Constitutive promoter family
Parts J23100 through J23119 are a family of constitutive promoter parts isolated from a small combinatorial library. J23119 is the "consensus" promoter sequence and the strongest member of the family. All parts except J23119 are present in plasmid J61002. Part J23119 is present in pSB1A2. This places the RFP downstream of the promoter. Reported activities of the promoters are given as the relative fluorescence of these plasmids in strain TG1 grown in LB media to saturation. See part BBa_J61002 for details on their use.
These promoter parts can be used to tune the expression level of constitutively expressed parts. The NheI and AvrII restriction sites present within these promoter parts make them a scaffold for further modification. JCAraw
Manchester 2017 used this part to create part LowPromoter_PduD(1-20)_mCherry (BBa_K2213006). This promoter was combined with PduD(1-20) to create a tag with lower expression levels. The mCherry tagged PduD(1-20) localisation tag displayed lower fluorescence levels under the low promoter as compared to under medium (BBa_K2213007) and high strength (BBa_K2213008) promoters, demonstrating correct function.
More information can be found here: https://parts.igem.org/Part:BBa_K2213006

GreatBay_China 2018:
Team GreatBay_China 2018 characterized J23119, Part:BBa_J23105, and Part:BBa_J23101 by assembling them with Part:BBa_B0034 and a sfGFPPart:BBa_I746916 on three vectors: pUC20 (copy number about 500/cell), pR6K (copy number about 15/cell), pSC101 (copy number about 2/cell). Then we measured the fluorescence by Flow Cytometry as a reference for the TALE stabilized promoter library.

The result indicate that the strength of J23119, J23105, and J23101 are about the same as described by team iGEM2006_Berkeley, and the fluorescence increases as the copy number of the vector increases
Thessaly 2019 Characterization
Thessaly 2019 sought to characterize the coding sequence of TEM-optimized β-lactamase (BBa_I757010) under the regulation of the constituve Anderson Family promoters BBa_J23100, BBa_J23105, BBa_J23106, BBa_J23119. β-lactamase is an enzyme that hydrolyses β-lactams (e.g. ampicillin) and is naturally found in prokaryotic cells. A colorimetric assay has been developed using nitrocefin as a substrate which after hydrolysis from β-lactamase changes the reaction color, from yellow (380nm) to red (490nm).
To achieve that, the coding sequence was assembled with each promoter, a universal RBS (BBa_B0034) and a double terminator(BBa_B0015). The parts were cloned in pSB1C3 and pSB1K3 and transformed into E. coli DH5a competent cells.
In the photo below you can see the results of the primer addition using overhang PCR:
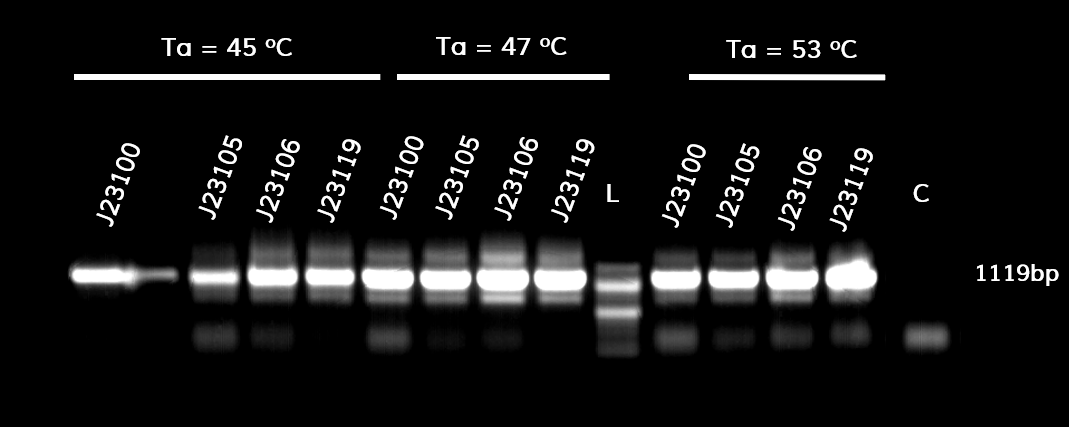
Figure 1. The results obtained after the PCR with the overhang primers for the different promoters of the Anderson family. We tested different annealing temperatures (45, 47 & 53℃) aiming for clear results. The expected band is at 1119bp and the ladder used was the 100bp DNA ladder by NEB.
For protein expression, the plasmids were transformed into E. coli BL21 (DE3) competent cells.
For the β-lactamase assay, we set up the following experimental design:
1. Grow BL21 (DE3) pre-culture overnight in 5ml LB (~16h) at a shaking incubator, 37℃ / 210rpm
2. The following morning, measure the OD600 of overnight cultures
3. Dilute all cultures to OD600¬ = 0.05 in M9 minimal medium
4. Grow cells 37℃ /210 RPM until OD600=0.4-0.6 (~2h)
5. Dilute all cells to the same OD600 (e.g. 0.4)
6. Load 160 of culture in a 96-well plate (do triplicates). Add 40 ul 0.5 uM nitrocefin for a final concentration of 100nM
7. Measure the absorbance at 490nm (for nitrocefin hydrolysis) and 600nm (for cell growth) every 30 seconds for 2 hours in a microplate reader. Shake between readings. Because plateau was reached within the first 30 minutes of the reaction, only those are depicted in the graph.
To ensure that the absorbance shown corresponds only to enzymatic activity by β-lactamase, we included 3 controls in the experiment. The first control has M9 medium only (no cells) and nitrocefin, the second has empty BL21 (DE3) cells (no plasmid) and nitrocefin, while the third has BL21 (DE3) cells containing the plasmid but not the part (empty plasmid). To obtain comparable results, we normalized all values by dividing OD490 by OD600.
The results are shown in the graph below

Figure 2. The hydrolysis of nitrocefin enabled by the expression of the β-lactamase gene, under the control of different promoters (J23100, J23105, J23106 & J23119) of the Anderson family. The substrate (nitrocefin) hydrolysis (490nm) is divided by cell growth (600nm), in order to normalize all values.
The maximum expression of β-lactamase was observed under control of the J23119 (brown line) which is the wild type promoter of the Anderson family. The expression is reduced with the J23100 and J23106 (yellow and purple line respectively), while the lowest expression levels were observed with the J23105 promoter (blue line). These results are in accordance with those from previous teams that measured fluorescence and the same pattern is observed. The controls conditions (pSB1C3 and BL21, or light purple and light blue respectively) confirm that the absorbance measured derives from β-lactamase activity only, both quantitatively and visually.
Below you can see the 96-well plate of the assay:

Figure 3.The observed color change due to the hydrolyzation of nitrocefin due to the production of β-lactamase, after a 2-hour enzymatic assay.
Note that the picture was taken after the plate-reader assay was completed and all conditions had reached a plateau, except the controls.
Baltimore Biocrew 2019 Characterization
Goal
We, the Baltimore Biocrew, decided to characterize some of the Anderson promoters. These promoters are highly used by iGEM but the relative expression of these promoters have been routinely determined by measuring the fluorescence of a reporter protein. However, the function of a promoter is to start transcription of a gene so it may be more informative to measure the amount of RNA (instead of protein) produced by a reporter gene. Therefore, we decided to further characterize a selection of the Anderson promoters (J23100, J23101, J23103, J23105, J23118) by measuring RNA using reverse-transcription quantitative Polymerase Chain Reaction (qPCR).
Results
We set up samples for qPCR with three or four technical replicates per promoter and no template control samples to measure DNA contamination. We did data analysis using the Livak Method (a standard, comparative method) to determine the relative strength of the promoters from the qPCR data using rrSD as our reference gene, RFP as our target gene, and J23100 as our calibrator sample.
Example:
ΔCT(J23101) = CT(RFP, J23101) – CT(rrSD, J23101)
ΔΔCT(J23101) = ΔCT(J23101) – ΔCT(J23100)
2^(–ΔΔCT) = relative expression ratio
In our first trial of qPCR (8/03/19), we were able to measure the relative strengths for J23100, J23101, J23103, and J23105 which were 1.00, 0.00, 0.81, and 1.93, respectively. Since these strengths did not match the relative expression levels reported by iGEM2006_Berkeley from protein level measurements, we repeated the qPCR (8/10/19) with the same cDNA. The strengths from this second trial were 1.00, 0.00, 0.37, and 0.20. We repeated it again and the relative strengths that we got on 10/12/19 for J23100, J23101, J23103, and J23103 were 1, 0, 2.91, and .32. Next, we made new cDNA by growing new liquid cultures, extracting RNA again, and repeating reverse transcription. From the new cDNA, we repeated the qPCR procedure two more times. The relative strengths for that we got on 9/28/19 for J23100, J23101, J23103, J23105, and J23118 were 1, 24.63, .36, 1.76, and .25. The relative strengths that we got on 10/12/19 for J23100, J23101, J23103, and J23105 were 1, 45.97, 3.20, and 1.26. In addition we measured promoter J23118 twice and got the strengths 1.13 and 1.32.
Here is the relative promoter strengths that we got from the qPCR. Baltimore BioCrew measurements in orange compared to the 2006 Berkeley iGEM, who determined relative strengths from measurements at the protein level, in blue.

To support our RNA measurements we also measured fluorescence of the liquid cultures we used to extract RNA. The cultures were grown overnight so we expected the bacteria to be at the stationary phase, but we measured OD to normalize any differences in growth.
| Promoter | OD | fluorescence | fluorescence divided by OD | corrected relative expression | reported relative expression |
|---|---|---|---|---|---|
| BBa_J23100 | 0.876 | 250 | 285.38 | 1 | 1 |
| BBa_J23101 | 0.674 | 255 | 378.33 | 1.33 | 0.7 |
| BBa_J23103 | 1.1 | 230 | 209.09 | 0.73 | 0.01 |
| BBa_J23105 | 1.08 | 215.74 | 209.09 | 0.76 | 0.24 |
| BBa_J23118 | 1.04 | 238 | 228.84 | 0.80 | 0.56 |
After redoing our protocol many times and trying to compare our results to 2006 Berkeley iGEM team we concluded that our data doesn’t quite match theirs. The different results in strengths could be caused by many different factors while doing our protocols. However, we have succeeded in characterizing the different strength Andersons promoters (J23100, J23101, J23103, J23105, J23118) by measuring RNA using Quantitative Polymerase Chain Reaction (qPCR). In conclusion, we successfully reached our goal in bringing new data to the characterizations of 5 different Andersons Promoters. In the future, it would be good for other iGEM teams to try to measure RNA as well so there will be a standard qPCR protocol for iGEM.
To see more detailed methods and our protocols, visit our wiki
https://parts.igem.org/Part:BBa_J23101
Added by KEYSTONE_A 2020 Team
J23105 can be used as constitutive promoter in bacterial cellulose producing strain K. rhaeticus iGEM, whose strength is of low-medium level.

Figure above: Constitutive promoter average strengths in K. rhaeticus iGEM and E. coli, normalized against J23104. Although all promoters are functional, their relative strengths differ between K. rhaeticus and E. coli. For K. rhaeticus, data is shown as grey bars, with standard deviation of N=3 biological replicates, characterized in liquid HS-medium containing cellulase, measured 3 h post-inoculation. Relative promoter strengths in E. coli are superimposed as black stripes.
References:
Florea, M., Hagemann, H., Santosa, G., Abbott, J., Micklem, C. N., Spencer-Milnes, X., ... & Chughtai, H. (2016). Engineering control of bacterial cellulose production using a genetic toolkit and a new cellulose-producing strain. Proceedings of the National Academy of Sciences, 113(24), E3431-E3440.
|
•••••
University of Texas at Austin iGEM 2019 |
UT Austin iGEM 2019: Characterization of metabolic burden of the Anderson SeriesDescriptionThe 2019 UT Austin iGEM team transformed the Anderson Series promoters into our 'burden monitor' DH10B strain of E. coli, which contains a constitutive GFP cassette in the genome of the cell. GFP expression fluctuates depending on the number of ribosomes available. Using this strain, we characterized the relative burden (percent reduction in growth rate) of each Anderson Series part. Our results showed a range of growth rate reductions for each of these parts due to ribosomal reallocation from the genome of the host cell, towards the expression of RFP. Anderson Series parts with strong promoters are depicted with darker red colors and Anderson Series parts with weak promoters are depicted with lighter pink colors to show relative RFP expression. We saw a positive correlation between relative promoter strength and metabolic burden; parts with stronger promoters expressed less GFP and had a lower growth rate than parts with weaker promoters. The regression line for the graph below was constructed by measuring the burden of 5 parts that were created by the 2019 UT Austin iGEM team that each contained an Anderson Series promoter (BBa_J23104 or BBa_J23110), an RBS of varying strength, and a BFP reporter. For more information on characterization of these parts through the burden monitor, visit our team’s wiki page: [1]
Importance of Characterizing BurdenAlthough often we cannot avoid using a specific burdensome part, knowing in advance that it is burdensome, and that it has a high chance of mutating into a non-functional genetic device, can help with troubleshooting and coming up with alternatives. In the specific case of fluorescent protein-expressing devices, Fluorescence-activated cell sorting (FACS) can be used to filter out individual cells that meet a certain fluorescence threshold. This way, the cells expressing lower levels of the fluorescent protein are weeded out of the population. </table> |


Characterization: Jilin_China 2019
Group:
Jilin_China 2019
We hope that when we use an unrepresentated promoter, we can easily and accurately get its relative strength in the already characterized promoter family.
Therefore, we constructed the promoter strength measurement vector BBa_K3078100 and characterized the promoter with a large intensity gradient of the Anderson promoter family, BBa_J23119, BBa_J23104, BBa_J23108, BBa_J23105, BBa_J23114, and it is expected to establish a standard curve with fluorescence intensity.

Figure 1. The fluorescence of each promoter changes with time (fluorescence / OD600). Different elements are connected to the same measurement carrier, cultured overnight, diluted to OD = 0.02 the next day, and the fluorescence at absorption wavelength 528nm was measured under excitation wavelength 485nm light.
Table 1. Reported relative expression and corrected relative expression. We calculated the relative fluorescence intensity of each promoter for it based on J23119.

The fluorescence data showed the intensity of BBa_J23104 and BBa_J23119 is much too high to constitute a linear relationship with the other three promoters. The reason of which might be the fusion genes influenced the relatve expression level of the promoter.
We invited JiangnanU_China to repeat, and the result of its characterization was not consistent with reported relative expression .Therefore, we speculated that the relative strength might be affected by experimental strains, plasmids and other factors. Under our experimental conditions, the relative strength of Anderson promoter was not consistent with reported relative expression.
Characterization in a cell free system - BOKU-Vienna 2020
The main goal of this series of experiments was to compare the expression strength of 3 constitutive promoters when used in a cell free expression system.1 This expression system includes the core RNA polymerase and sigma 70 transcription factor. Three closely related promoters of well documented expression strength controlled by sigma 70, as well as a single terminator (T_B1001) were chosen, as described in the parts section. The promotores are: BBa_J23101 for better readability called “101”, BBa_J23105 “105” and BBa_J23109 “109”. To accurately measure expression strength the fluorescent protein mCherry was utilized as the expressed protein, as one can deduct expression strength based on fluorescence measurements. The complex of promotor, gene and terminator was then assembled via Golden Gate cloning into the Golden Gate backbone 02, which additionally contains an Ampicillin resistance gene as a selection marker:
| Reaction Mix | Master Mix | |
|---|---|---|
| x1 | x5 | |
| [μL] | [μL] | |
| BB2_AB_14 [40 nM] | 1 | 5 |
| BB1_Prom (101/105/109) [40 nM] | 1 | - |
| BB1-mCherry [40 nM] | 1 | 5 |
| BB1-Term [40 nM] | 1 | 5 |
| Cutsmart buffer2 | 2 | 10 |
| ATP | 2 | 10 |
| BbsI - HF [20 U/µL] | 2 | 10 |
| T4 ligase [120 U/µL] | 0.25 | 1.25 |
| H2O | 9.75 | 48.25 |
| total volume | 20 | 95 |
With this assembled plasmid, a transformation was carried out. The transformation was then distributed on Agar plates lazed with Ampicillin as a selection marker. From these plates colonies were picked to prepare liquid overnight cultures, from which the DNA was purified using Miniprep kits.3 The success of the Golden Gate Cloning was then confirmed utilizing restriction digests as well as outsourced sequencing.
Experimental setupDue to the small volume of cell free system expression reactions (~20 µL), it would not have been feasible to take samples over time comparable to a fermentation process. Instead several reactions were set up at different time intervals in order to get an as accurate as possible picture of the fluorescence development over the timeframe in question. To increase the validity of the experiment, doublets were prepared. The reactions consisted of the following components:
| Table 1. Components of assay 1 | Volume [µL] |
|---|---|
| myTXTL® Sigma 70 Master Mix | 9 |
| Plasmid DNA [10,8 nM] | 9 |
| Table 2. Components of assay 2 | Volume [µL] |
|---|---|
| myTXTL® Sigma 70 Master Mix | 15 |
| Plasmid DNA [20 nM] | 5 |
Results
The measured fluorescence is presented in fluorescence units [FU].
Table 3. Fluorescence of mCherry at assay 1:
| Time [h] | 101[FU] | 105[FU] | 109[FU] |
|---|---|---|---|
| 1.3 | 8.0 | 6.5 | 6.0 |
| 2.8 | 7.5 | 6.5 | 6.0 |
| 4.8 | 28.0 | 6.5 | 6.0 |
| 8.0 | 57.0 | 14.0 | 7.0 |

The data clearly shows that the respective expression strength in E. coli (101>105>109) remains the same in this cell free expression system.4 However, the difference between 101 compared to 105 and 109 is far more pronounced than the difference between 105 and 109. To see the differences better, especially between 105 and 109, a second experiment was carried out. For this, plasmid DNA with higher concentration was produced. Through this, a higher concentration of cell free reaction mix was possible. The different parameters can be seen in table 2 compared to table 1.
Table 4. Fluorescence of mCherry at assay 2:
| Time [h] | 101[FU] | 105[FU] | 109[FU] |
|---|---|---|---|
| 3.45 | 534 | 7.5 | 6 |
| 5.03 | 937 | 9.5 | 5.5 |
| 7.45 | 1310.5 | 18.5 | 4.5 |
| 9.45 | 1082 | 19 | 5.5 |

Interestingly, a drop-off in fluorescence past 7.5 hours can be seen for 101. This might be the result of experimental errors and different operators. This seems as a more coherent explanation than a decay of protein. Even though the incubation time was longer and the concentration of the cell free expression system higher, the difference between 105 and 109 is hardly visible. In fact, 109 showed no activity at all as can be seen in table 4.
Conclusion
To produce a notable amount of a protein of interest, the promoter 101 seems to be the best choice. 105 shows some activity compared to 109 which produced no measurable amount of protein. This result seems valid. However, this result is meaningful for this very expression system.
1myTXTL® Sigma 70 Master Mix Kit
250 mM Potassium Acetate, 20 mM Tris-acetate, 10 mM Magnesium Acetate, 100 µg/ml BSA
3Monarch Plasmid Miniprep Kit
4https://parts.igem.org/wiki/index.php?title=Part:BBa_J23101
//direction/forward
//promoter/anderson
//regulation/constitutive
//rnap/prokaryote/ecoli/sigma70
| negative_regulators | |
| positive_regulators |