
Part:BBa_I746916
superfolder GFP coding sequence
This is the coding sequence of superfolder GFP (Pedelacq et al (2006): "Engineering and characterization of a superfolder green fluorescent protein", Nature Biotech 24 (1) January 2006).
More information about the properties of this GFP in relation to the currently used mut3GFP can be found at: http://openwetware.org/wiki/IGEM:Cambridge/2008/Improved_GFP.
It carries the following amino acid changes with respect to mut3 GFP (E0040), the currently most commonly used GFP in the registry:
S30R, Y39N, F64L, G65T, F99S, N105T, Y145F, M153T, V163A, I171V, A206V
Its in-vivo properties are considerably improved with respect to mut3 - it develops fluorescence about 3fold faster than mut3 GFP and reaches 4fold higher absolute fluorescence levels. Fluorescenct colonies can be identified with the naked eye even without UV or blue light illumination (that is to say the amount of blue light in normal daylight or lablight is sufficient). Additionally it is more stable in vitro and refolds faster after in vitro denaturation with respect to mut3 GFP.
Note: Superfolder GFP is available in constructs driven by the pBAD and T7 promoters: part numbers I746908 and I746909 respectively. Additionally 6-his tagged versions for protein purification exist: I746914 (pBAD driven) and I746915 (T7 driven).
Contribution: Wego_Taipei iGEM2022 on BBa I746916
Wet Lab Contribution: BBa_K4271008
In order to detect the degree of paraoxon degradation by our target protein OPH into p-nitrophenol (pNP), we designed a biosensor based on the existing part: superfolder GFP coding sequence. Our construct design, BBa_K4271008 , is based on a research paper published in Nucleic Acids Research (Jha, Ramesh K., et al.). The pNP sensor indicates the amount of pNP produced during OPH hydrolysis via GFP fluorescence.


After cultivating normal E.coli colonies and E.coli engineered with the biosensor in the absence and presence of pNP, the result we acquired from the experiment was not consistent with the data published in the paper (Jha et al., 2016). The observed differences between the levels of GFP fluorescence before and after adding 125 µM of pNP were not significant enough to prove the effectiveness of the biosensor.
| Groups | Fluorescence |
| Dh5alpha | 24970 |
| Dh5alpha + pNP | 20650 |
| DH5alpha-sensor | 46867 |
| Dh5alpha-sensor + pNP | 50783 |

Since the genetic organization and sequence of our pNP sensor is identical to the plasmid design in the research paper, we concluded that there might be an error in the biosensor design. We believe this discovery would benefit and contribute to future research related to the application of the pNP biosensor.
For more information about the pNP biosensor design and experiments, please visit our <a href: "https://2022.igem.wiki/wego-taipei/engineering"> Engineering Success Page</a>.
References
Ramesh K. Jha, Theresa L. Kern, Youngchang Kim, Christine Tesar, Robert Jedrzejczak, Andrzej Joachimiak, Charlie E. M. Strauss, A microbial sensor for organophosphate hydrolysis exploiting an engineered specificity switch in a transcription factor, Nucleic Acids Research, Volume 44, Issue 17, 30 September 2016, Pages 8490–8500, https://doi.org/10.1093/nar/gkw687
LINKS_China 2021 Characterization of Ma-sfGFP-CBM3
Author: Aaron Zhexuan Zhang
Designer: Zixiang Zhou
Part of our project is about modifying bacterial cellulose membrane's (BCM) properties through binding proteins fused with cellulose binding matrixes. Here, we secreted sfGFP-CBM3 in S. cerevisiae cells.
To enable secretion of proteins in yeast, we attached a short signal peptide called maturation factor alpha (Ma) to our protein. Aza et al have already characterized Mα and mutated it to become more efficient at protein secretion. For our project, we selected Ma A9D; A20T; Q32H; F48S; G62D (referred to as Ma_Mut) as it had one of the highest secretion rates. We constructed two plasmids, Ma-sfGFP-CBM3 and Ma-CBM3-2Rep-CBM3 (Fig. 1B), and transformed both plasmids into yeast (Fig. 1A).
On YPD plates, secretion of Ma-sfGFP-CBM3 can be seen by the green halo surrounding each individual colony (Fig. 1D). After culturing Ma-sfGFP-CBM3 and Ma-CBM3-2Rep-CBM3 yeast in liquid YPD (Fig. 1E), we performed SDS-PAGE analysis on both the whole cell and growth media (Fig. 1C). We discovered that only a small portion of the expressed proteins were found in the media for Ma-sfGFP-CBM3, and an unobservable amount of secreted protein was found in the Ma-CBM3-2Rep-CBM3 media. This meant that most likely, only a small amount of CBM3-2Rep-CBM3 will be secreted, not enough to significantly alter the characteristics of the resulting BCM. As a proof of concept, we cultured SCOBY using Ma-sfGFP-CBM3 (Fig. 1F). In the future, we hope to increase the expression of secretion rate of Ma-sfGFP-CBM3 and Ma-CBM3-2Rep-CBM3 to achieve in situ modification of BCM (Mohammadi et al, 2019).

Contribution: GIFU TOKAI 2019
Group: GIFU TOKAI 2019
Author: Ryo NIWA
Documentation:
First, plasmid DNA of BBa_I746916 was amplified with Cont_For primer, Cont_Rev primer. The PCR product was re-amplified with T7 SD PRO primer and Cont_Rev primer. The PCR product was electrophoresed by 1.5% agarose gel and dyed by ethidium bromide for 20 minutes. After confirming the single band, the DNA was purified by FastGene Gel/PCR Extraction Kit (NIPPON Genetics, Tokyo, Japan). Then, following the instruction of PUREfrex2.0 and, it expressed sfGFP. At this time, we used water as a negative control instead of template DNA. sfGFP expressed by the cell-free system was analyzed by its fluorescence and western blotting. In PURE system, BBa_I746916 was successfully expressed and, the expressed sfGFP was turned into green under the UV. The figure.1 shows the sfGFP under UV exposure. We also perfomred western blotting and confirmed the band of sfGFP around 27 kDa. Using Microplate Reader, we also performed the quntification of sfGFP. We used Fluorescein from the measurement kit to make calibration. The result is shown in the graph.
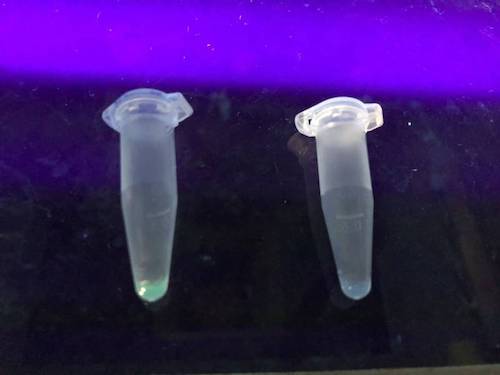
Figure.1 Expression in PURE system
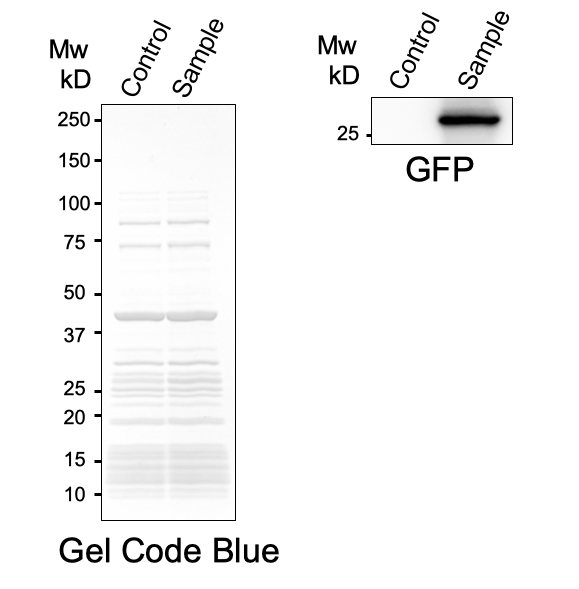
Figure.2 Western Blotting Analysis (Control: Water, Sample: BBa_I746916)
Contribution: GreatBay_SZ 2019
Group: GreatBay_SZ 2019
Author: Xinyou Chang
Introduction & Design: Xinyou Chang
Documentation:
2Rep-sfGFP is the recombinant chromoprotein that can mix with the NT-2Rep-CT spidroin in certain ratio to be artificially spun into the continuous and high function spider silk with green fluorescence property.
This year we synthesized the part NT-2Rep-CT, to for artificial silk spinning, is the common architecture in two main types of spider silk proteins: major ambulate spidorins(MaSps) and minor ampullate spidorins (MiSps): A non-repetitive N-terminal domain (NT), as well as the C-terminal domain (CT). In between them is an extensive repetitive region (Rep). We believe this part can realize the approach of producing recombinant spidroins (silk proteins) from other chassis and spin them into silk to fulfill the demand of spider silks. However, this part is only responsible for to form continuous silk that are colorless.
In order to maintain and stability of color and silk spinning, stead of mixing pure sfGFP with our spidroin, we added two repetitive region in front of sfGFP, with the assumption that 2Rep can assist the NT-2Rep-CT extensive region’s transition into beta-sheet formation as the 2Rep regions can lie parallel to each other and be formed into beta-sheet structure cohesively. And do not disrupt the dimer formation at NT or the unfolding at CT during the silk spinning process.
Purification and SDS PAGE


In order to detect whether protein expression was induced by adding isopropylthiogalactoside (final concentration 0.3mM), we used SDS-page(10%) to determine the presence of target protein. Target protein after purification by Ni-NTA method was compared to their original chromoprotein only. Result showing the size chromoprotein only, 2Rep-sfGFP, and NT-2Rep-sfGFP are in an increasing trend as regions are added, this result is constant in all three of our chromoprotein. This suggests that our 2Rep protein domain is successfully added on to our pure chromoprotein and well induced. 2Rep-sfGFP under white light source have the most opacity in their own group of chromoprotein of same color.
Fiber spinning of NT2RepCT with recombinant chromoprotein 2Rep-sfGFP

Recombinant chromoprotein 2Rep-chromoprotein concocting with NT-2Rep-CT spidroin in the suitable ratio can form the most continuous and stable silk when spinning into 100%isopropanol comparing with the silk spun by replacing 2Rep-chromoprotein with chromoprotein only or NT-2Rep-chromoprotein. It’s also the most transmittance The stable feature of this particular silk spun supports our assumption to let the 2Rep region bounded to the chromoprotein assist the NT-2Rep-CT extensive region’s transition into beta-sheet formation as the 2Rep regions can lie parallel to each other and be formed into beta-sheet structure cohesively without disruption to the dimer forming at NT or the amyloid-like fibril forming at CT when carrying out artificial silk spinning at low pH or in 100% isopropanol.
Scanning electron microscopy of fibers

Aiming to verify the distribution uniformity of the mixture of recombinant chromoprotein and spidroin after spinning into fiber, we looked at our artificial spun silks under electron microscope. We randomly selected the cross section in our continuous silk, it has clearly shown that the fiber circularity is qualified as a uniformly distributed silk. For sfGFP, when 2Rep is added to the front of chromoprotein, the silk formed is has the smallest diameter among all the silks in the chromoprotein same group.
References:
[1] Andersson, Marlene, et al. “Biomimetic Spinning of Artificial Spider Silk from a Chimeric Minispidroin.” /Nature Chemical Biology/, vol. 13, no. 3, Sept. 2017, pp. 262–264., doi:10.1038/nchembio.2269.
Characterization: Freiburg 2019
Group: Freiburg 2019
Author: Fabian Bäzner
Summary: We demonstrated the non-peptide guided auto-secretion of sfGFP (BBa_I746916) into the medium. sfGFP can thereby be used as a carrier for proteins linked to its carboxyl end which we analyzed with different induction conditions to reach optimal secretion.
Documentation:
<p align="justify">
Secretion of proteins can have various benefits. The secretory production of recombinant proteins leads to simpler purification, avoidance of protease attack and a better chance of correct protein folding1. Due to its fluorescent properties, sfGFP represents a secretion tag for easy extracellular signal validation.

Expression system:
Backbone: pET302
Promoter: T7 promoter
Terminator: T7 terminator
RBS: T7 RBS (BBa_K1362090)
E.coli strain: BL21(DE3)
We induced the sfGFP-CInt-TRX construct in 20 mL E. coli cultures under different temperatures (37, 30, 25°C), IPTG concentrations (1, 0.5, 0.1 mM, ctrl.), media (LB-medium, auto-induction medium) and took samples of each culture after 16, 24 or 48 hours. The samples were subsequently centrifuged at 21000 xg and the fluorescence of the supernatant was measured with a plate reader (excitation: 495 nm; emission: 515 nm) (Figure 2).

The induction with 0.1 mM IPTG at 37°C in LB-medium showed the highest relative fluorescence. This condition was used for a 50 mL culture and the secretion was analyzed over time. We measured the OD600 and obtained samples of the culture every 2 hours. Samples were centrifuged at 21000 xg and the fluorescence of the supernatant was measured with the plate reader (excitation: 495 nm; emission: 515 nm)(Figure 3).

After 6 hours, the fluorescence in the medium increases, while the cells are still in the growth phase. These results were confirmed by Western Blot analyses of the supernatant, using an antibody against TRX (Figure 4). Expression of CInt-TRX in another 50 mL culture of E. coli BL21(DE3) under the same conditions did not show secretion of TRX (figure 4, 8 h / 10 h). This indicates the increase of fluorescence in the medium is based on the secretion of sfGFP-CInt-TRX and not on lysis of cells and sfGFP is carrying CInt-TRX into the medium.

Altogether we demonstrated the auto-secretion of sfGFP, analyzed different conditions for the secretion and measured the secretion over time.
References:
[1] Choi J. H. et al., Secretory and extracellular production of recombinant proteins using Escherichia coli (2004). Appl. Microbiol. Biotechnol. 64, 625–635
[2] Zhang Z. et al., Non-peptide guided auto-secretion of recombinant proteins by superfolder green fluorescent protein in Escherichia coli (2017). Scientific Reports. 7, 6990
Contribution: QHFZ-China 2019
Group: QHFZ-China iGEM 2019
Author: Cheng Li
Introduction & Design:

BBa_I746916 is a fluorescent protein. This year, we used it in our system to report whether there was uric acid in the environment.
This year we use BBa_K3007036 to express sfGFP. The part is equal to BBa_I746916. However, BBa_I746916 has two tandem termination codon (TGA) at the 3' end of the part. We retained only one termination codon (TGA) in BBa_K3007036.
Documentation:
We charactered sfGFP part in the part BBa_K3007010 (https://parts.igem.org/Part:BBa_K3007010). Fig.4 and Fig. 5 showed the result related to sfGFP, Fig. 1-3 showed the process that we constructed the part.
This year, QHFZ-China designed a UA monitor system in Escherichia coli (E. coli). The original version is shown in Fig. 1. Pc is a constitutive promoter, Pcp6 promoter, and it promotes the expression of HucR and YgfU. When uric acid is absent, HucR can bind to PhucR, which suppresses dsRed expression. If uric acid presents in high concentration, HucR will release from PhucR and the expression of dsRed will recover from the inhibition [2].

Two clones with the UA detection system were tested. The original gene circuit was able to response to UA in a range of 0 to 200 μM (Fig. 2A). The clone 1 showed much better dynamics than the other (Fig. 2B). Time course experiments showed that the fluorescence intensity became quite strong at 4 to 6 hours after UA induction, and became stable at 10 to 12 hours (Fig. 2C). Even if we removed UA by replacing fresh LB medium, after 48 hours of shaking, the fluorescence would still be notable (Fig. 2D) and there was no significant difference between dsRed fluorescence / OD600 before and after UA removing (Fig. 2E). All the data meant that our design could detect high UA concentration quickly and stably.

However, through our human practices, we found that the sensitivity and responding time of the original design were not good enough. In the next generation of design, we introduced RinA_p80α - PrinA_p80a system to enhance the sensitivity. Meanwhile, we changed dsRed to sfGFP, whose maturation time is much shorter, to shorten the waiting time. The new version of the uric acid detector was shown in Fig. 3. If UA presented, RinA_p80α would express and active transcription of sfGFP which was under control of PrinA_p80α. We called this as Version 2.

We tested the sfGFP production of Version 2 under different concentration of extracellular UA. The curve in Fig. 4A showed the fluorescence was saturated under only 15 μM UA induction, while the old version needed about 100 μM UA to get saturated (Fig. 2B). To test if sfGFP could shorten the reaction time, we used the same construct only except reporter genes, called PRinA_p80α – sfGFP and PRinA_p80α – dsRed, respectively. After adding 20 μM UA into the reaction system, the curve of PRinA_p80α – sfGFP climbed much faster than PRinA_p80α – dsRed, which suggested our new design had a great induction performance, and fitted our predictions very well (Fig. 4B).

At last, we took a photo to show the green fluorescence released by E. coli expressing sfGFP.

References:
[1] Wan, X., Volpetti, F., Petrova, E., French, C., Maerkl, S. J., & Wang, B. (2019). Cascaded amplifying circuits enable ultrasensitive cellular sensors for toxic metals. Nature chemical biology, 15(5), 540.
[2] Liang C., Xiong D., Zhang Y., Mu S. and Tang S. (2015). Development of a novel uric-acid-responsive regulatory system in Escherichia coli. Appl. Microbiol. Biotechnol. 99, 2267–2275.
Contribution: WHU-China 2019
Group: WHU-China 2019
Authors: Jiongyi He
Summary: We confirmed that sfGFP (BBa_I746916) is available in constructs driven by the pR (BBa_R0051) and determined the relationship between sfGFP protein concentration and fluorescence intensity. Besides, we made a comparison of fluorescence intensity between BBa_K3098015 and BBa_I746916.
Documentation:

We constructed a recombined plasmid composed of pR (BBa_R0051)+RBS (BBa_B0030)+sfGFP (BBa_I746916)+6xHis-tag to express the sfGFP (BBa_I746916). By the way, there was no repressor CI of pR in the expression system.

We also constructed a recombined pet28a plasmid composed of T7 promoter and sfGFP BBa_K3098015 to express the sfGFP with avi-tag.

After purification by Ni resin, we made it a series of gradient dilutions of BBa_K3098015 and BBa_I746916 respectively. Then we measured the sfGFP protein concentration by Bradford method and the fluorescence intensity under 475nm as emission wavelength and 545nm as excitation wavelength.


Then we fit data into a straight line: y=kx+b. Due to the fluorescence intensity of blank group without any sfGFP is 113 A.U., the ordinate at the origin should be 113. So the b should be 113. It is easy to understand that the higher the value of k is, the stronger the sfGFP fluorescence is.
Therefore, we draw following conclusions:
(1) sfGFP (BBa_I746916) is available in constructs driven by the pR(BBa_R0051);
(2)According to the k of relationship(y=kx+113) between protein concentration and fluorescence intensity through our measurements, the fluorescence of sfGFP-Avitag (BBa_K3098015) is stronger than sfGFP (BBa_I746916).

Contribution: Valencia_UPV iGEM 2018
Group: Valencia_UPV iGEM 2018
Author: Adrián Requena Gutiérrez
Summary: We have adapted the part to be able to assemble transcriptional units with the Golden Gate method and we have done the characterization of this protein.
Documentation:
We adapted the CDS BBa_I746916 to be used to assemble composite parts using the Golden Gate method creating BBa_K2656013. Then we made the characterization of the part:
The characterization of this protein (and by extension of all the other part that codify for the sfGFP) was performed with our transcriptional unit BBa_K2656101.
This transcriptional unit was assembled in a [http://2018.igem.org/Team:Valencia_UPV/Design Golden Braid alpha 1 plasmid] including the following parts:
- BBa_K2656004: the J23106 promoter in its Golden Braid compatible version from our [http://2018.igem.org/Team:Valencia_UPV/Part_Collection Part Collection]
- BBa_K2656009: the B0030 ribosome biding site in its Golden Braid compatible version from our [http://2018.igem.org/Team:Valencia_UPV/Part_Collection Part Collection]
- BBa_K2656013: This part.
- BBa_K2656026: the B0015 transcriptional terminator in its Golden Braid compatible version from our [http://2018.igem.org/Team:Valencia_UPV/Part_Collection Part Collection]
In order to carry out a correct characterization of the protein and to be able to use it to make measurements of the different transcriptional units that we have assembled with it, we have obtained the emission and excitation spectra in the conditions of our equipment. By using this [http://2018.igem.org/Team:Valencia_UPV/Experiments#spectra protocol] with the parameters of Table 1, Figure 1 has been obtained.
| Table 1. Parameters used to obtain the spectra | |||
| Parameter | Value | ||
| Number of samples | 6 | ||
| Excitation Wavelength measurement range (nm) | [420-525] | ||
| Emission wavelenght (nm) | 545 | ||
| Emission Wavelength measurement range (nm) | [470-580] | ||
| Excitation wavelenght (nm) | 450 | ||
| Gain (G) | 50 | ||

Improvement
Group: iGEM2018_Jilin_China
Author:Zihao Wang
Summary: This year our team registered the superfolder GFP designed by Overkamp W et al with a BBa_K2541400 (sfGFP_optimism, https://parts.igem.org/Part:BBa_K2541400). Compared with superfolder GFP(BBa_I746916), sfGFP_optimism (BBa_K2541400) is BbsI restriction site free, so it can be used in Golden Gate assembly to achieve efficient and rapid assembly of gene fragments.
Document:
1. Usage and Biology
Green fluorescent protein (GFP) exhibits intrinsic fluorescence and is commonly used as a reporter gene in intact cells and organisms [1]. Many mutants of the protein with either modified spectral properties, increased fluorescence intensity, or improved folding properties have been reported [2].
GFP often misfolds when expressed as fusions with other proteins, while a robustly folded version of GFP, called superfolder GFP (sfGFP), was developed and described by Pédelacq et al at 2006[3] that folds well even when fused to poorly folded polypeptides. We decided to use sfGFP as our reporter protein due to its faster folded feature and higher fluorescence intensity. The superfolder GFP had been registered in iGEM BBa_I746916. There is another superfolder GFP designed by Overkamp W et al at 2013[4], which is a codon optimized sfGFP. It was be used in Escherichia coli by Segall-Shapiro T H et al at 2018[5].
This year our team registered the superfolder GFP designed by Overkamp W et al with a BBa_K2541400 (called sfGFP_optimism) and BBa_K2541401(called sfGFP(BbsI free)).
Compared with superfolder GFP (BBa_I746916), sfGFP_optimism (BBa_K2541400) and sfGFP(BbsI free)(BBa_K2541401) are BbsI restriction site free, and the BbsI restriction endonuclease is an economical and efficient enzyme used in Golden Gate assembly, so sfGFP_optimism and sfGFP(BbsI free) can be used in Golden Gate assembly to achieve efficient and rapid assembly of gene fragments.

Figure 1. Expression of three types of sfGFP(BBa_I746916, BBa_K2541401, BBa_K2541400), cultivated overnight.
2. Characterization
We constructed sfGFP_optimism (BBa_K2541400) sequence and superfolder GFP (BBa_I746916) on the pSB1C3 vector. The BbsI recognition site free was confirmed by nucleic acid electrophoresis (Figure 2). The sfGFP_optimism can not be digested by BbsI. And the length of these sequences are correct.

Figure 2. L1: 1kb DNA marker; L2: BBa_I746916; L3: BBa_I746916+BbsI; L4: BBa_K2541401; L5: BBa_K2541401+BbsI; L6: BBa_K2541400; L7: BBa_K2541400+BbsI; L8: 1kb DNA marker.
We got the emission and excitation spectra of two type sfGFP: sfGFP_optimism (BBa_K2541400), sfGFP(BbsI free)(BBa_K2541401) and superfolder GFP (BBa_I746916) (Figure 3).


Figure 3. Emission and Excitation Spectra of sfGFP_optimism(BBa_K2541400) and sfGFP(BBa_I746916)
For further characterization, we detected the expression intensity of these two types of sfGFP. According to the results (Figure 4), we found out that the fluorescence intensity of sfGFP_optimism (BBa_K2541400) is nearly 2.6 times higher than superfolder GFP (BBa_I746916).

Figure 5. The expression of three types of sfGFP in E.coli. The grey line represents fluorescent expression of sfGFP_optimism (BBa_K2541400), the orange line represents fluorescent expression of sfGFP(BbsI free) (BBa_K2541401), the blue line represents fluorescent expression of superfolder GFP (BBa_I746916) and the yellow line represents fluorescent expression of negative control (BBa_J364007).
3. Conclusion
We have made an improvement on the superfolder GFP (BBa_I746916). Our sfGFP_optimism (BBa_K2541400) is BbsI restriction site free, which can be used in Golden Gate assembly to achieve efficient and rapid assembly of gene fragments. And its fluorescence intensity is higher than superfolder GFP (BBa_I746916).
Contribution:UCAS-China 2019
Group:UCAS-China
We inserted different number of TAG codon to sfGFP at different site to see the effect of TAG codon to the expression of sfGFP. Figure 1 shows that TAG codon can inhibit the transcription of sfGFP effectively.

Usage and Biology
Contribution: Linköping_Sweden 2019
Author: Andreas Holmqvist and Leo Juhlin
- BBa_B0034Ribosome binding site
- [http://https://parts.igem.org/Part:BBa_I719005 BBa_I719005]T7 promotor
Fluorescence in BL21 (DE3)
To verify the fluorescence of sfGFP (BBa_I746916), BL21 (DE3) containing CBD-sfGFP was grown in 1 liter LB-miller with 25 µg/ml chloramphenicol. Isopropyl β-d-1-thiogalactopyranoside (IPTG) was used to induce the culture at a final concentration of 1 mM and the culture was incubated O.N. in 37 °C after the induction. Thereafter, the CBD-sfGFP expressing bacteria was placed on an UV-table emitting light 302 nm (Figure 5). The picture shows CBD-sfGFP´s strong fluorescence at 302 nm UV-light.

Compatibility in Vibrio natriegens
In order to see if sfGFP worked in Vibrio natriegens using the strain Vmax, CBD-sfGFP (BBa_K3182108) and CBD-pCons-Aspink (BBa_K3182100) was ligated into the pUC19 vector and heat shocked into Vmax.Thereafter, the bacteria was spread onto LB-miller V2 agar dishes with 200 µg/ml carbenicillin and incubated in 37 °C for 16 hours. Both plates was put on an UV-table and illuminated in 302 nm (Figure 6). The picture below shows that the CBD-sfGFP bacteria, in comparison to the control CBD-pCons-AsPink, displays a strong green fluorescent color which verified that pUC19-CBD-sfGFP could successfully be heat shocked and expressed in Vmax.

To measure the protein expression of T7-CBD-sfGFP in different bacteria and carbenicillin concentrations. BL21 (DE3) and Vibrio natriegens , using the strain Vmax, was grown in Falcon tubes to 0.5 OD600. Vmax was grown with two different carbenicillin concentrations, 200 and 600 µg/mL, while BL21 (DE3) had the same carbenicillin concentration of 100 µg/mL carbenicillin. The bacteria was induced with 1 mM IPTG and placed in a 96-well plate in 4 replicates with 200 µL per well. A spectrometry experiment was conducted and measured the fluorescence (excitation 470 nm,emission 550 nm) intensity during 16 hours in 37 °C. The results seen below (Figure 7) shows that expression in Vmax with 600 µg/mL carbenicillin gave the highest protein yield. The most probable explanation for the increased protein yield for Vmax at 600 µg/mL carbenicillin is partially caused by the higher protein production of Vmax compared to BL21 (DE3). Another important factor was the use of an optimal concentration of carbenicillin (600 µg/mL) for Vmaxwhich retained the plasmid more efficiantly than Vmax at 200 µg/mL carbenicillin.

Contribution: Sydney_Australia 2019
Group: Sydney_Australia
Authors: Fahad Ali and Isobel Magrath
Summary: We tested the thermal stability of sfGFP, by measuring fluorescence at 494 nm over the range 60-95°C using a qPCR machine.
Documentation: In order to better characterise the thermal stability of sfGFP, we conducted a melting curve analysis, with comparison to our new fluoroprotein VVD36-C73A-CH4-M130I (Part:BBa_K3140010). We prepared 50 mL overnight cultures of pK18:sfGFP and pK18:VVD36-C73A-CH4-M130I. Following culture, cells were pelleted by centrifugation and resuspended in 1mL of Zietkiewicz buffer (40mM Tris-HCl, pH 7.8; 50mM NaCl: 20mM KCl; 20mM MgCl2; 5mM b-mercapto-ethanol; 10% glycerol). Cells were then lysed through bead-beating, and then centrifuged to remove supernatant. Serial dilutions of cell lysate were prepared in a 96-well PCR plate. We then used a qPCR machine with a 6-carboxy-fluorescein (FAM) filter to measure excitation and emission at 494 and 518 nm, respectively, at an initial temperature of 60°C for one minute before increasing by 0.3 degrees per second up to 95°C.
Results are summarised in Fig. 1.

From the results of the derivative curve, we observe that sfGFP is less thermostable than C73A-CH4-M130I.
Contribution: UniGE-Geneva
Group: UniGE-Geneva
Authors: Grégory Segala and Bryan Bourrat
Summary: In the list of Parts assigned to our team, we decided to characterize the fluorescent protein : sfGFP (BBa-I746916). Our goal was to observe the evolution of the intensity of fluorescence emitted by this protein, after induction by IPTG (Isopropyl -D-1-thiogalactopyranoside), varying two parameters: temperature and pH.
Documentation:


Conclusion: There is no variation in the intensity of fluorescence, for the GFP, depending on whether you are in an acidic, neutral or alkaline pH environment. It is also observed that there is no variation in fluorescence intensity even though temperature increases. Thus, sfGFP seems more stable than the other fluorescent protein we characterized (mCherry RFP : BBa-J18932).
Contribution: iGEM Athens 2020
Group: iGEM_Athens
Authors: Ö.Can, A.Doğa Yücel, A.B.Pekşen, E.Turksever, S.Özcengiz, O.Göcenler, I.B. Altay, G. Broutzakis, M. Ioannidou, S. Kanellopoulos, K. Pylarinou
Summary: A codon optimized version of this part was constructed in collaboration with iGEM KU Instanbul for Flavobacteria. iGEM Instanbul 2020 aims to create a biolaser system that utilizes GFP as gain medium and reflectin as a resonator. The codon optimized sequence for the strain Flavobacterium johnsoniae can be found in the following accession: BBa_K3520010
Further information for this part in Flavobacteria will be added during the second phase of the competition (2021).
Contribution: UPF_Barcelona 2020
Group: UPF_Barcelona
Authors: T.Berjaga, Q. Marti & J.Puig
Summary: The ASV tag was added into the sfGFP in order to increase the protein degradation rate, thus having faster system responses. The effect of the ASV tag in the sfGFP degradation rate was characterized.
If there is a need for faster responses in the system, and in consequence, for faster recoveries, we must increase the protein degradation rate. However, we must consider that a strong increase on the degradation rate will imply a loss of accuracy on the reported measurements, as the range will become narrower. Therefore, the addition of the ASV tag becomes ideal as it is supposed to be weak [1].
This ASV tag addition can be seen as an improvement of an existing part as it will make a difference for any kind of system that needs faster continuous measurements.
The characterization of this protein was done combining a constitutive promoter (BBa_J23100), a RBS32 (BBa_B0032) and a double terminator (BBa_B0015) followed by the sfGFP with the ASV degradation tag (This reporter sequence BBa_K3484006) . A control with the original sequence (BBa_I746916), with the same promoter, double terminator and RBS, was done to see how the tag affected the final fluorescence.

[1] Andersen, J.,Sternberg, C., Poulsen, L. K., Bjørn, S. P., Givskov, M. New Unstable Variants of Green Fluorescent Protein for Studies of Transient Gene Expression in Bacteria. Applied and environmental microbiology, June 1998, p. 2240–2246
Model Characterization
In order to quantify how the ASV tag affected the degradation rate of the sfGFP, a simple mathematical model was developed. The following model is exactly the same for the two scenarios, and consists of a constitutive expression minus a degradation rate (Equation.1). As both systems are constitutively regulated by the same promoter, the PJ23100 (BBa_J23100), the production rate will be the same in the two systems. In addition, the equations representing the steady-state (dy/dx=0) of the system were calculated (Equation.2).


With the Steady-State equations we are able to look for the relationship between the two degradation rates (δ) as the production rate is the same(Equation.3).

In the relation between the degradation rates (Equation 3.) we can clearly see that the ASV tag has an impact on the degradation rate. Mathematically it has been proved that the degradation rate is increased, approximately, 25% when the ASV tag is added on the sfGFP gene sequence. All in all, it has been demonstrated that the addition of the ASV tag increases the degradation rate. Therefore, the introduction of an ASV tag is a good approach to reduce the recovery system time without losing effectiveness of measurement, which is interesting for any kind of biosensor or feedback loop application.
Characterization experiments
For the characterization a Plate-Reader analysis was made. All the information on the experimental conditions and parameters used are described on the table below (Table 1).
| Table 1. Plate-Reader Parameters for the characterization of the effects of ASV tag in sfGFP | |||
| Parameters | Value | ||
| Plate-Reader model | Synergy HTX | ||
| Plate type | Thermo Fischer 96-well microplates black-walled clear bottom | ||
| Cell medium | LB | ||
| Time | 24 hours | ||
| Shake | Linear: Continuous, Frequency: 567 rpm (3mm) | ||
| Temperature | 37C | ||
| Gain | 50 | ||
| Optical Density (OD) measurement (absorbance) | 660nm | ||
| GFP excitation wavelength | 485nm | ||
| GFP emission wavelength | 528nm | ||
Contribution: iGEM Vilnius-Lithuania 2021
Group: Vilnius-Lithuania
Author: Rimvydė Čepaitė
Summary: Our team characterized the dynamics of sfGFP expression under variety of different promoters in Escherichia coli Nissle 1917 strain for sfGFP protein in expression construct alone and when fused with tyrosine ammonia lyase (TAL). In addition to that, we also introduced an mRNA cyclization system to this project. The circularization of mRNA molecules improves the fraction of full-length proteins among synthesized polypeptides by selectively translating intact mRNA and reducing abortive translation [1].
SfGFP expression rates under different promoters was estimated by measuring fluorescence intensity and dividing the intensiveness of the signal by the OD600 of the medium during the course of 6 hours (Figure 1). The greater ratio would indicate the stronger expression (Table 1). The same evaluation strategy was applied to measure the effectiveness of mRNA cyclization system, which in our particular case did not show the expected potential to improve the efficiency of our system (Figure 2)[1].

Figure 1: first graph - comparison of the sfGFP expression strength of under all target promoters; second graph - the expression strength under all target promoters compared to p-slpA.
Table 1: the evaluation results of the promoters without mRNA cyclization system.
| Promoter | Absolute value of fluorescence/OD600 at the midpoint of growth | Promoter strength in comparison to p-slpA |
|---|---|---|
| BBa1033225 | 383.99 | 0.76 |
| BBa1033222 | 227.79 | 0.45 |
| BBa1033220 | 295.25 | 0.58 |
| P-slpA | 508.22 | 1.00 |
| J23118 | 176.43 | 0.35 |
| J23117 | 155.74 | 0.31 |
| J23115 | 135.46 | 0.27 |
| J23114 | 175.06 | 0.34 |
| J23113 | 180.56 | 0.36 |
| J23107 | 253.16 | 0.50 |
| J23106 | 237.59 | 0.47 |
| J23103 | 178.62 | 0.35 |
| J23102 | 187.82 | 0.37 |
| J23101 | 226.14 | 0.44 |

Figure 2: comparison of general promoter strength with and without mRNA cyclization system.
The ability of the mRNA cyclization system to improve sfGFP expression while fused with another protein was estimated by measuring how intensively the nissle transformants can produce sfGFP fused together with tyrosine ammonia lyase (TAL) under the different promoters. Fluorescence intensity was evaluated by dividing the intensiveness of the signal by the OD600 during the course of 7 hours. Results in our particular case did not show the expected potential to improve the efficiency of our system (Figure 3).

Figure 3: comparison of expression strength of sfGFP fused together with TAL under different promoters with and without mRNA cyclization system.
Contribution: SUSTech Shenzhen 2022
We apply a directed evolution approach called CPR which based on gene circuits to select positive clones from library that leads to the production of a thermostable polymerase Taq by emulsion PCR. Designed circuits are divided into positive selection and negative selection to select trp repressor that can bind to trp and can not bind to 6-Br-trp respectively. We construct plasmid pTrpR, pPOS and pNEG. pTrpR is induced to express muted trp repressors. Active trp repressors with its ligand can induce pPOS to express Taq polymerase and inactive trp repressors or trp repressor without its ligand can induce pNEG to express Taq polymerase.

The expression of Taq polymerase cannot be monitored easily, we apply GFP assay to use GFP production to analyzing the gene circuits function. We also construct pNEG-sfGFP and pPOS-sfGFP which replace Taq polymerase gene with sfGFP to characterize the expression of Taq polymerase. We transform pTrpR which express wild type trp repressor into competent cells that have been transformed with plasmid pNEG-sfGFP or pPOS-sfGFP. Then we culture and induce with different concentration of trp and 1mM IPTG to induce expression of sfGFP. We expect that as trp concentration increases, the expression of sfGFP (RPU/OD600) in pNEG-sfGFP gradually decreases, and the expression of sfGFP (RPU/OD600) in pPOS-sfGFP gradually increases

In addition to GFP test, we also perform a mock selection to confirm the designed gene circuit function can actually select positive clone. At first, we mix culture with strains that has been induced to express sfGFP and oil mix to check the quality of emulsion droplet. We measure the diameter of droplet with a phase contrast microscopy. We found that the diameter of emulsion droplets are range about 2~10μm and less than 20% emulsion droplets contain a GFP-expression cell. Thus, we have checked any emulsion droplet can only contain a single cell.

Sequence and Features
- 10COMPATIBLE WITH RFC[10]
- 12COMPATIBLE WITH RFC[12]
- 21COMPATIBLE WITH RFC[21]
- 23COMPATIBLE WITH RFC[23]
- 25COMPATIBLE WITH RFC[25]
- 1000INCOMPATIBLE WITH RFC[1000]Illegal SapI.rc site found at 13
References
- Yang, J., Han, Y.H., Im, J. et al. Synthetic protein quality control to enhance full-length translation in bacteria. Nat Chem Biol 17, 421–427 (2021). https://doi.org/10.1038/s41589-021-00736-3
| None |