
Part:BBa_K1073022
Constitutively expressed chromoprotein eforRed
This device is an enhanced construct of 2012 Uppsala's BBa_K592012. It consists of a strong promoter (BBa_J23100) combined with a RBS (BBa_B0032) and the encoding region of the chromoprotein eforRed (BBa_K592012). This results in a constitutively high expression of eforRed.
Usage and Biology
During cultivation, the chromoprotein eforRed is expressed and stored intracellularly. The pink color of the protein can be seen by the naked eye, thus the chromoprotein can be used as a reporter to distinguish cells easily.


iGEM Team Braunschweig 2013:
Left: Liquid cultures of E. coli XL1 expressing chromoproteins amilGFP (BBa_K1073024), eforRed and aeBlue (BBa_K1073020).
Right: Cell pellet of E. coli XL1 expressing eforRed.
The pink color of eforRed can be seen by the naked eye. The chromoprotein also fluoresce when excited. Thus, it can be used to identify cells with fluorescence microscopy or flow cytometry. For further information as well as absorption and emission spectra see experience page.

iGEM Team Braunschweig 2013: Supernatant after cell disruption containing chromoproteins of eforRed and amilGFP (BBa_K1073024). Both chromoproteins fluoresce when excited by UV-light.
Exeter iGEM 2015:
As a part of our project, three chromoproteins BBa_K1431814, BBa_K1073022, and BBa_K1073020 were characterised as they could be used as potential indicators in our cell-free diagnostic test.
eforRed was further characterised in three main ways; an absorbance spectrum was recorded, a standard curve of protein concentration vs. OD458 was calculated, and a visual limit was determined.
Absorbance spectrum: Below is an absorbance spectrum for eforRed between 400nm and 850nm. Peak maxima is seen around 580nm.

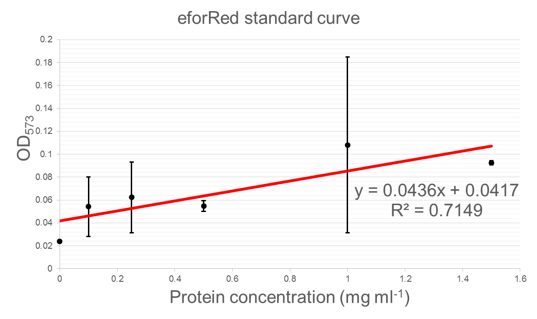
Standard curve - protein concentration vs. OD: Below is a standard curve for concentration of protein vs. OD (573 nm). This curve can be used to determine the concentration of eforRed based on its optical density (OD).
Visual limit: Below is an image showing the intensity of colour at a specific amount of chromoprotein, from not visible to readily visible. The point of this characterisation is so that the level of protein expression/production required before a visual output in observed can be deduced.

IMPROVEMENT REFERENCE: Linkoping_Sweden 2021
An improved version of this part can be seen here: BBa_K3892016 (Group: iGEM21_Linkoping_Sweden) Designed by: iGEM21_Linkoping_Sweden
Introduction
J23110-G10 leader-EforRed
The BioBrick BBa_K1073022, a chromoprotein called EforRed with a strong promoter (BBa_J23100) and a weak RBS region (BBa_B0032), was improved as a part of our project. In this improved version, the weak RBS region was replaced with a stronger G-10 leader RBS (from BBa_K1758100). The G-10 leader contains longer spacer regions before and after the RBS, leading to a more efficient ribosome binding, and thus, more protein production [1]. In both the old and improved part, a glycine was added after the start methionine (in the coding sequence of EforRed) in order to include a BamHI restriction enzyme cleaving site. This was done in order to enable the swapping of the promoter and RBS region to make cloning easier for us, this does not change the function of the EforRed protein. The BamHI site does not need to be included for future use. EforRed is fluorescent with an excitation maximum at 589 nm and an emission maximum at 609 nm [2]. It has a bright pink color under white light. Due to the bright color and fluorescence, EforRed can be used as an alternative for the commonly used blue-white screening. This improvement showed a quicker color development on agar plate colonies while exhibiting a higher ceiling of fluorescence in liquid cultures.

Expression
Both BioBricks were expressed in Escherichia coli (E. coli, strain BL21 DE3) and in Vibrio natriegens (V. natriegens, strain Vmax). The BioBricks were transformed into both bacterias in a pUC19 plasmid. Bacteria were grown on LB-Miller agar plates (with V2 salts for V. natriegens) with carbenicillin (100 µg/mL for E. coli, 250 µg/mL for V. natriegens) until red colonies could be seen (16 h). The fluorescence intensity of single colonies was measured using an epifluorescence microscope (Leica Spectraview). To excite the EforRed chromophore, light at a wavelength of 535 nm was used with an exposure time of 50 msec. Fluorescence between 400 and 700 nm was measured. Five similarly sized colonies from one plate of both the improved and the old version of the BioBrick were measured. A single colony was exposed to the fluorescence and an image was taken immediately in order to avoid bleaching of the color. The fluorescence was measured at the brightest part of each image (green dot, 2D). In E. coli (BL21 DE3) the improved part had 40% higher fluorescence and in Vmax, the fluorescence was over twice as high in the new part, although colonies exhibited a wide range of EforRed fluorescence (Figure 2).
Results
Fluorescence was also measured from liquid cultures using a plate reader (BMG Clariostar). Liquid cultures of V. natriegens (Vmax) and E. coli (BL21 DE3) with both the old and improved BioBrick were made. The flasks (Erlenmeyer) had an open atmosphere (cotton plugs) and liquid media (LB-Miller 100 µg/mL carbenicillin for E. coli and V2 salts and 600 µg/mL carbenicillin for V. natriegens, 10 mL volume) at 1/10th of the flask volume. In addition, liquid cultures of V. natriegens (Vmax) in baffled flasks were also used in this experiment. To excite the EforRed chromophore, light at a wavelength of 554 nm was used. Fluorescence was then measured at 586 nm. Optical density was measured at 600 nm. Four biological samples from each test group were measured after 24 h and 96 h incubation at 37 °C. The relative intensity of each sample was divided by the optical density (600 nm) to accurately show the protein expression even if the cultures were not equally dense. After 96 h incubation, the fluorescence of the improved part is noticeably higher in all test cultures (Figure 2).

Figure 2. A-B. Relative intensity of old BioBrick BBa_K1973022 (dark teal) and improved BioBrick BBa_K3892016 (light green) in E. coli strain BL21 DE3 (A.) and V. natriegens strain Vmax (B.). The intensity was measured with an epifluorescence microscope (Leica Spectraview). Single colonies on agar plates had their EforRed chromophores excited at 535 nm with an exposure time of 50 msec. The emission was measured between 400-700 nm. The peak emission was then derived from the centre of the colony. The error bars represent the mean ± 95 % confidence interval (CI) from five different colonies on the same plate. C. Relative intensities divided by optical densities of old (BBa_K1973022) and improved (BBa_K3892016) BioBricks after 24h and 96h incubation in BL21 DE3 and Vmax. The intensity and optical density were measured using a plate reader (BMG Clariostar). To excite the EforRed chromophore, light at a wavelength of 554 nm was used. Emission was measured at 586 nm. Optical density was measured at 600 nm. The error bars represent the mean ± 95 % CI from four biological samples from each test group. D. Epifluorescence microscopy picture of a single colony. Colored dots show the different parts of the image where the relative intensity was measured. Green dot measures the highest intensity (shown in A, B) whereas the red dot measures the background. Yellow and blue measure intermediate intensities.

Figure 3. Comparison of old (BBa_K1973022) and improved (BBa_K3892016) EforRed under UV light (302 nm). Old part is on the right and the improved on the left side of the figure. Both images have been edited to enhance the red color for easier detection. A. Comparison of the BioBricks in Vibrio natriegens (Vmax) after 16 h incubation in 37 °C and then 24 h at room temperature. Improved EforRed on the left and old on the right. B. Comparison of the BioBricks in E. coli (BL21 DE3) after 24 h incubation at 37 °C.
The improved part (BBa_K3892016) led to a much higher expression of EforRed that it was possible to see a difference between the colonies of the old and improved version under white light. Especially in V. natriegens (Vmax), the improved version was noticeably more red/pink under UV light (302 nm). The comparison of the two versions of EforRed in both V. natriegens (Vmax) and E. coli (BL21 DE3) under the UV light can be seen in Figure 3.
Conclusion
The increase in fluorescence in both bacteria proves that the BioBrick BBa_K3892016 is an improved version of the old version (BBa_K1073022). The use of more than one bacteria and measuring methods adds credibility to the improvement. Because of the ever-expanding field of synthetic biology, especially recently, we in iGEM21_Linkoping_Sweden, believe that including multiple bacteria in the characterization of biobricks is necessary for the future.
References
[1] Lentini R, Forlin M, Martini L, Del Bianco C, Spencer AC, Torino D, et al. Fluorescent proteins and in vitro genetic organization for cell-free synthetic biology. ACS Synth. Biol. 2013 Mar;2(9): 482–489.
[2] Liljeruhm J, Funk SK, Tietscher S, Edlund AD, Jamal S, Wistrand-Yuen P, et al. Engineering a palette of eukaryotic chromoproteins for bacterial synthetic biology. J Biol Eng. 2018 May;12(8).
Sequence and Features
- 10COMPATIBLE WITH RFC[10]
- 12INCOMPATIBLE WITH RFC[12]Illegal NheI site found at 7
Illegal NheI site found at 30 - 21COMPATIBLE WITH RFC[21]
- 23COMPATIBLE WITH RFC[23]
- 25COMPATIBLE WITH RFC[25]
- 1000COMPATIBLE WITH RFC[1000]
| None |