
Part:BBa_K1431814
amajLime, yellow-green chromoprotein reporter system (Strong Promoter, Strong RBS)
Team Uppsala 2012 chromoprotein attracts many interests because it's more convenient than fluorescent protein for it can be observed with naked eyes. However, characterized data of these proteins are few. Because a single coding region is on the plasmid, we constructed BBa_K1431814 with chromoprotein amajLime (BBa_K1033916) this year and did characterization.
We've constructed a series of plasmids which are all in the same pattern: a strong/weak promoter, a strong/weak RBS and a chromoprotein. We want to monitor the speed of expression of these plasmids in normal incubation conditions (like 37℃ overnight for LB agar plate and 37℃ 180rpm for LB broth). The expression speed and strength of the constructed biobricks will be carefully monitored and gave others a relative scale for using chromoprotein as a reporter gene.
For detailed characterization data, see the experience page.
Selective Figures


Exeter iGEM 2015:
As a part of our project, three chromoproteins BBa_K1431814, BBa_K1073022, and BBa_K1073020 were characterised as they could be used as potential indicators in our cell-free diagnostic test.
AmajLime was further characterised in three main ways; an absorbance spectrum was recorded, a standard curve of protein concentration vs. OD458 was calculated, and a visual limit was determined.
Absorbance spectrum: Below is an absorbance spectrum for amajLime between 400nm and 850nm. Peak maxima is seen around 452-458nm.

Standard curve - protein concentration vs. OD: Below is a standard curve for concentration of protein vs. OD at peak maxima (458nm). This curve can be used to determine the concentration of amajLime based on its optical density (OD).

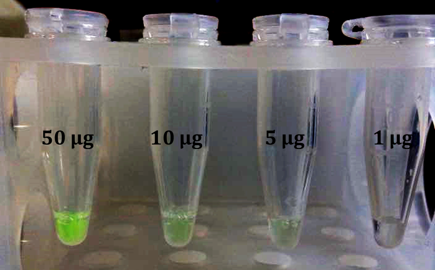
Visual limit: Below is an image showing the intensity of colour at a specific amount of chromoprotein, from not visible to readily visible. The point of this characterisation is so that the level of protein expression/production required before a visual output is observed can be deduced.
Sequence and Features
- 10COMPATIBLE WITH RFC[10]
- 12INCOMPATIBLE WITH RFC[12]Illegal NheI site found at 7
Illegal NheI site found at 30 - 21COMPATIBLE WITH RFC[21]
- 23COMPATIBLE WITH RFC[23]
- 25COMPATIBLE WITH RFC[25]
- 1000COMPATIBLE WITH RFC[1000]
| None |