Part:BBa_J10050:Experience
This experience page is provided so that any user may enter their experience using this part.
Please enter
how you used this part and how it worked out.
Applications of BBa_J10050
User Reviews
UNIQd71aecefb69cf5e1-partinfo-00000000-QINU
|
••••
ETH Zurich 2014 |
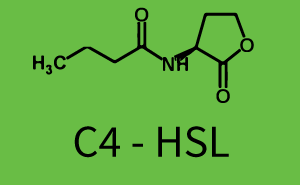
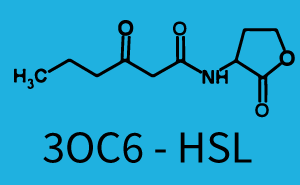
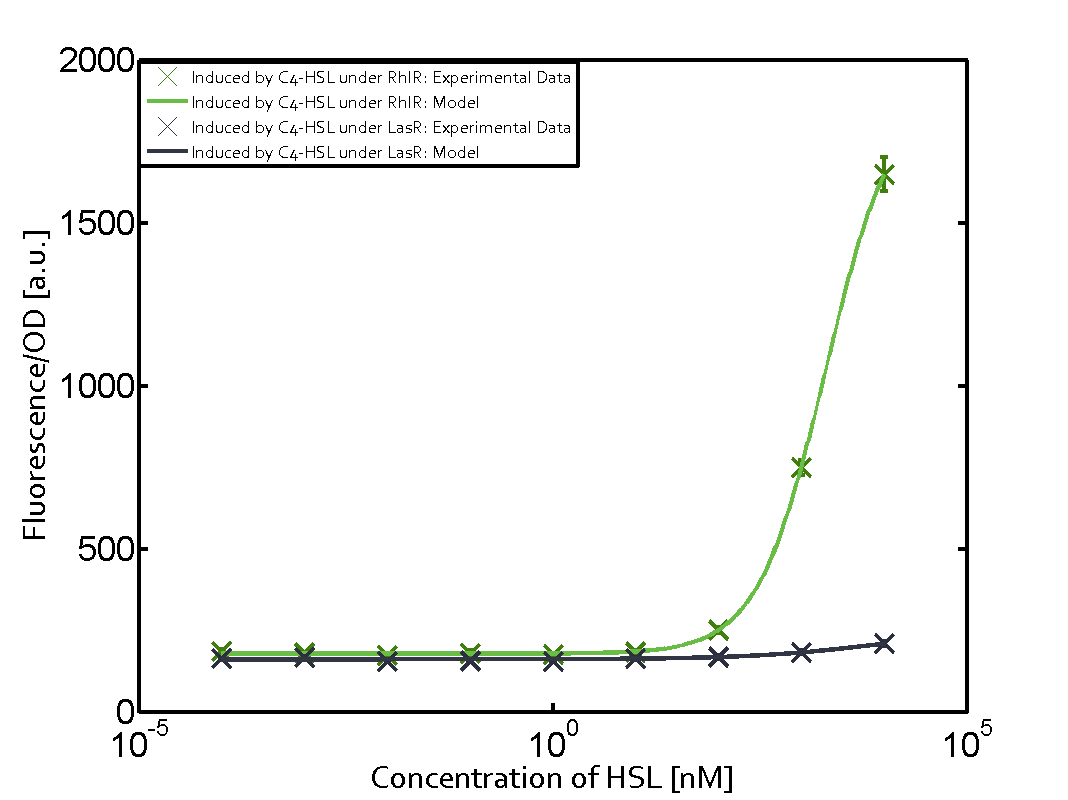
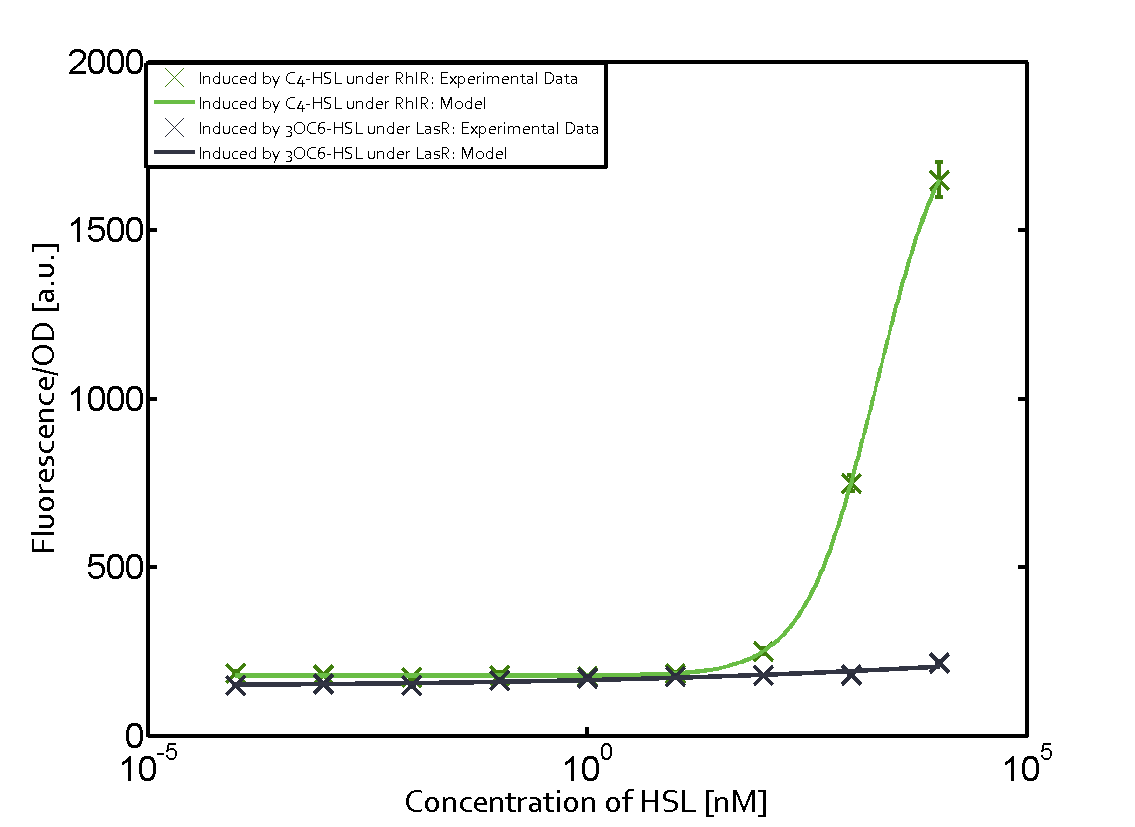
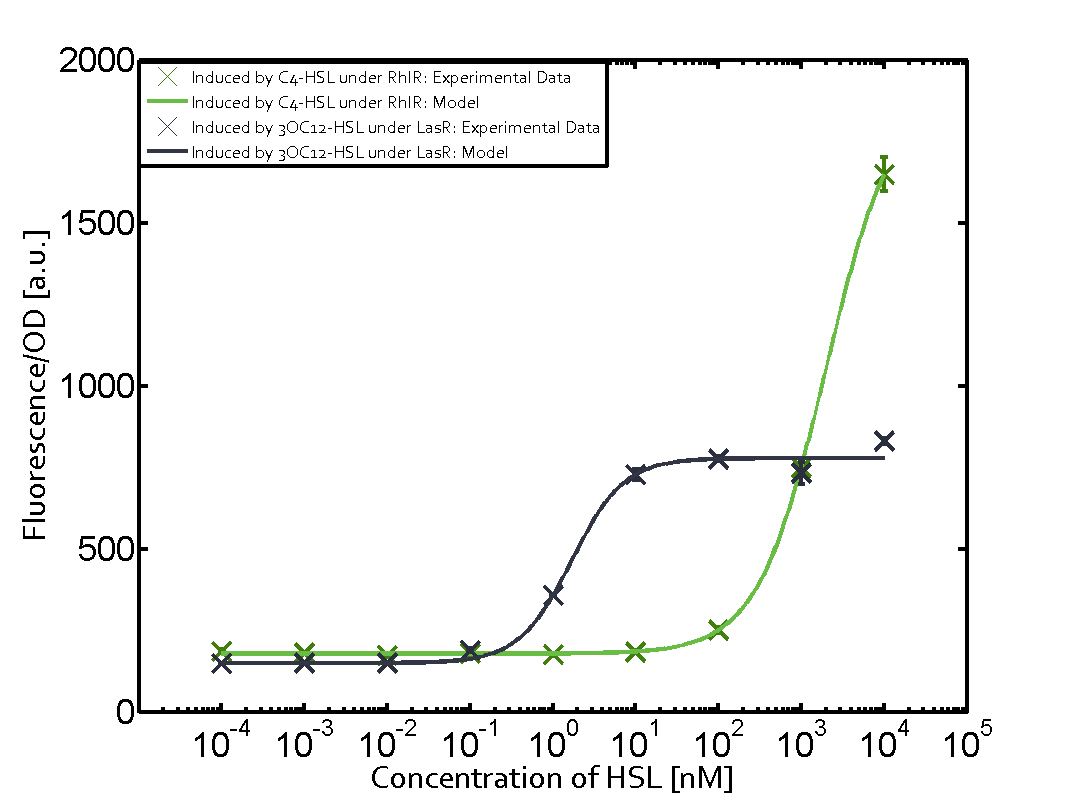
Characterization of weak promoter (BBa_J23113) and weak RBS (BBa_B0031)Differences in promoter strength had more effect on enzymatic expression compared to differences in RBS strengths as evidenced in the graphs below. Lambert_GA 2019 had originally thought that BBa_J10050 would result in the least amount of expression out of the tested combinations, but this part, along with BBa_J10051 and BBa_J10052, all shared the lowest expression out of the combinations. This is due to the translation rate not being an important factor in the determination of expression of ONP; however, the promoter strength is a significant factor. In other words, expression values are significantly different with different promoters but not with different RBS strengths.  Figure 1 Overview of possible crosstalk of the RhlR/pRhl system with three different AHLs. Usually, C4-HSL binds to its corresponding regulator, RhlR, and activates the pRhl promoter (green). However, RhlR may also bind 3OC12-HSL (red) or 3OC6-HSL (light blue) and then unintentionally activate pRhl.  Figure 2 Overview of possible crosstalk of the RhlR/pRhl system with two additional regulators (LuxR and LasR). Usually, RhlR together with inducer C4-HSL activate their corresponding promoter pRhl (green). However, pRhl may also be activated by the LuxR regulator together with 3OC6-HSL (light blue) or by the LasR regulator together with 3OC12-HSL (red). 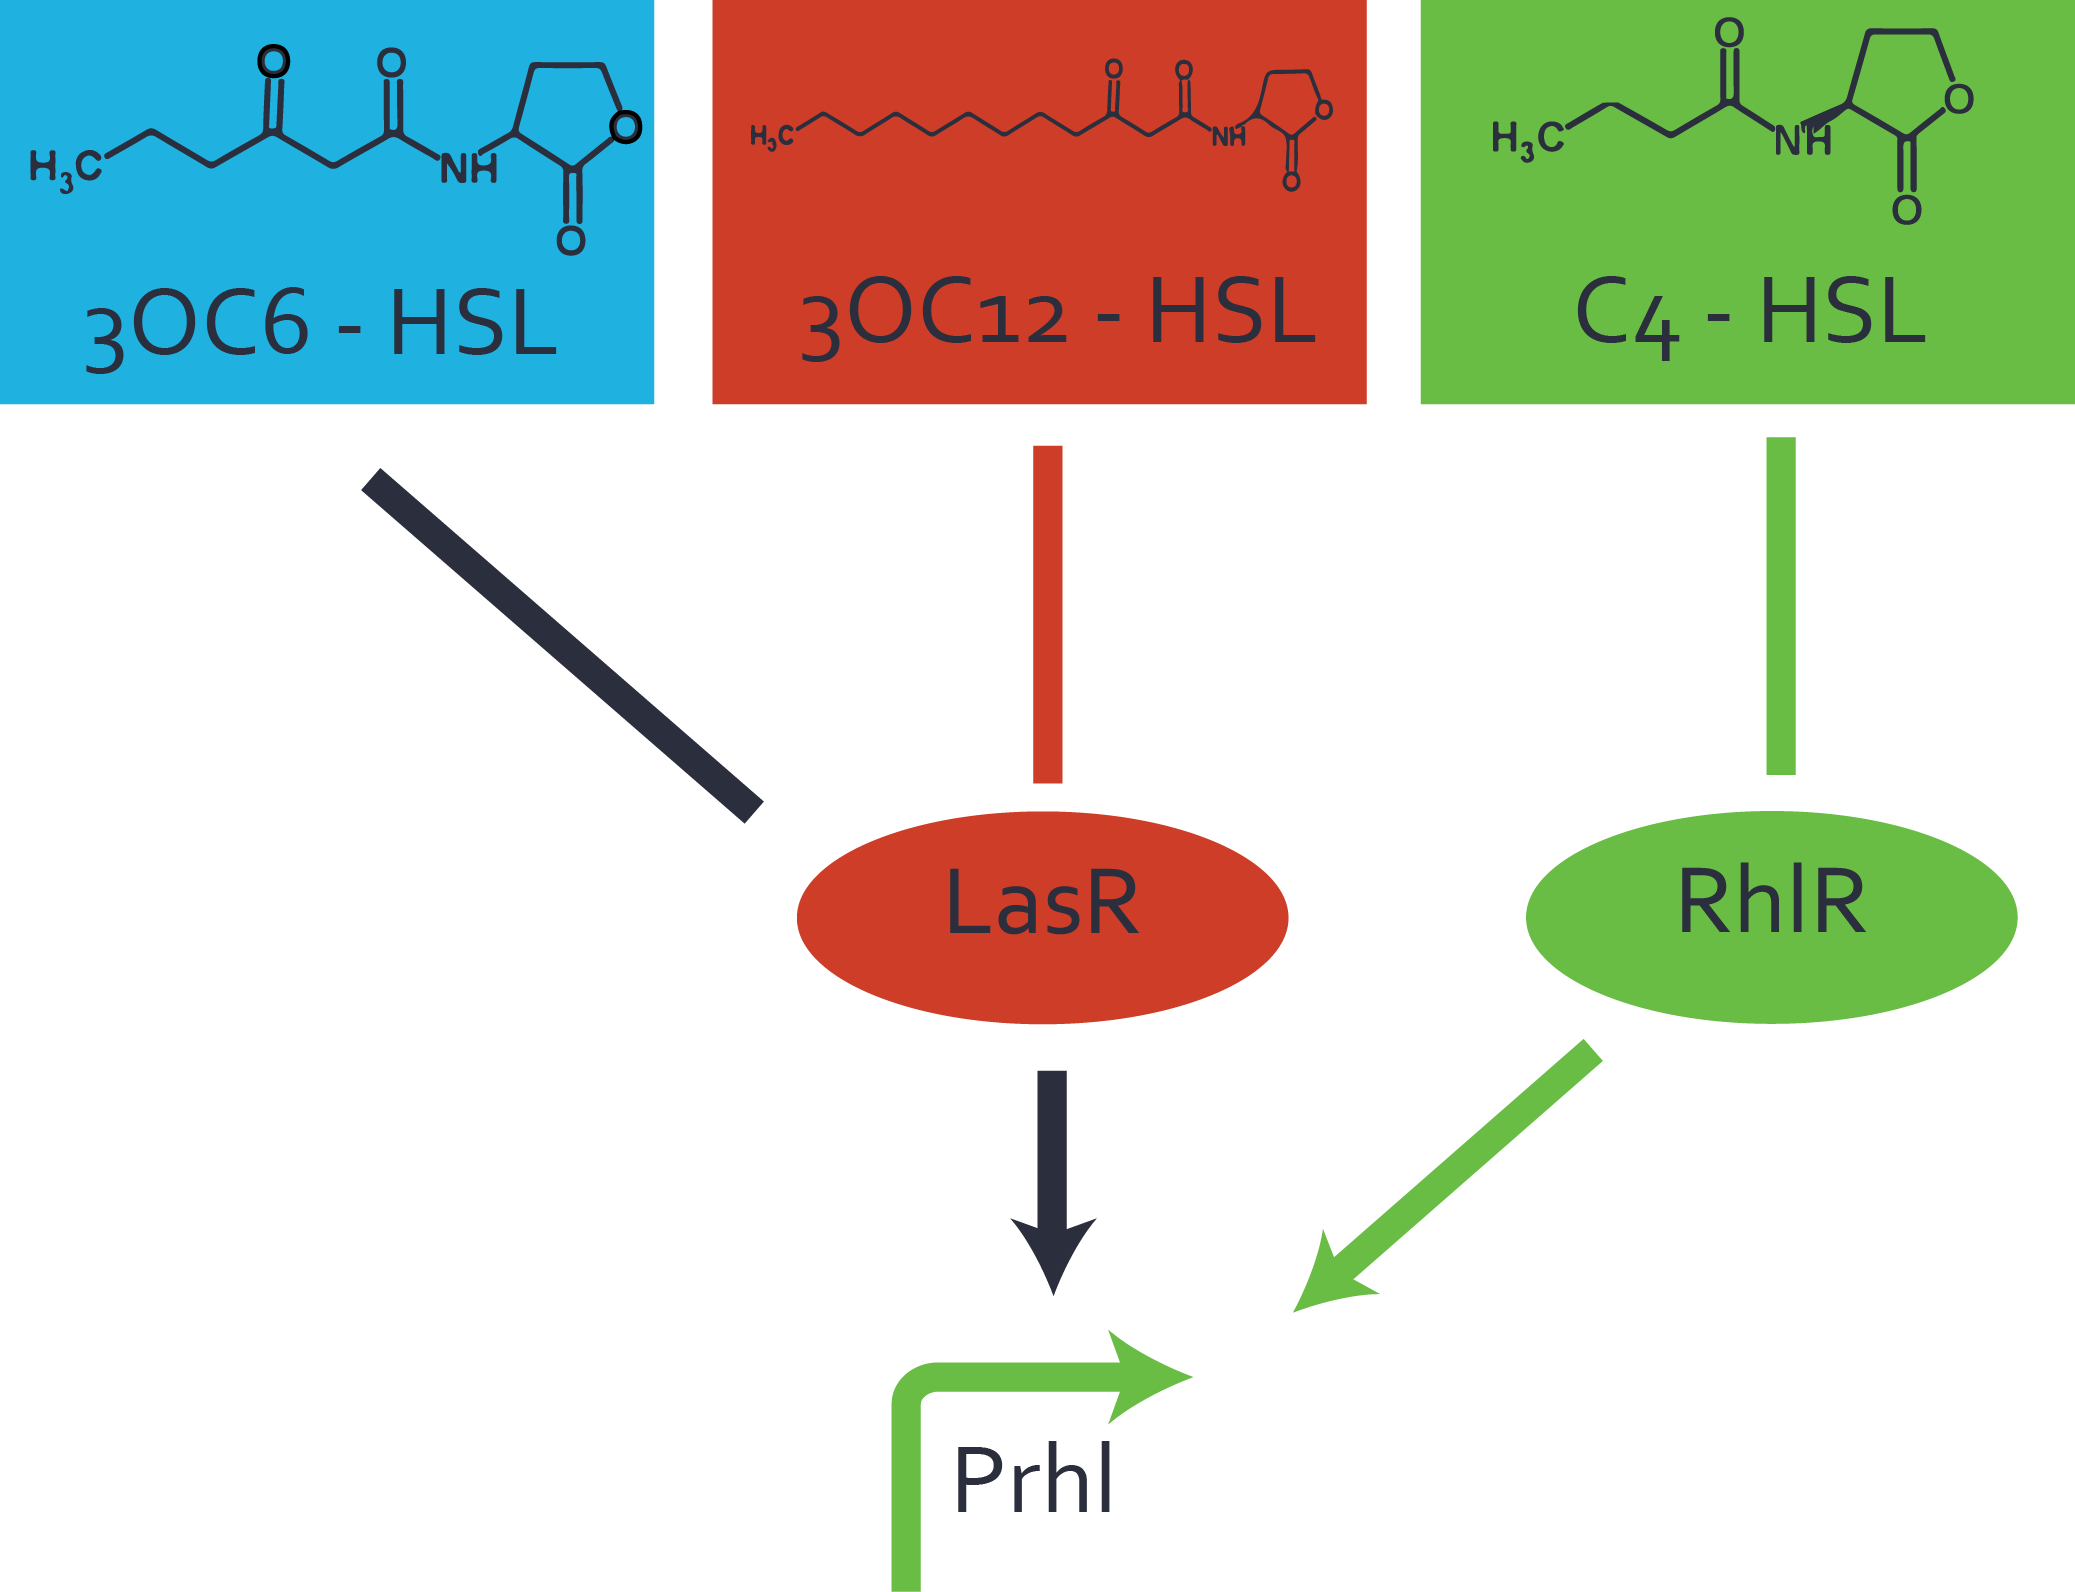 Figure 3 Overview of possible crosstalk of the pRhl promoter with both the regulator and inducer being unrelated to the promoter and each other. Usually, RhlR together with inducer C4-HSL activate their corresponding promoter pRhl (green). However, pRhl may also be activated by another regulator together with an unrelated inducer. For example, the inducer 3OC6-HSL (light blue) may interact with the LasR regulator (red) and together activate pRhl (green). |
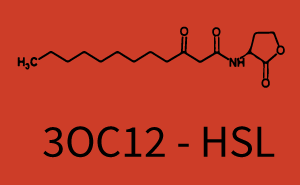
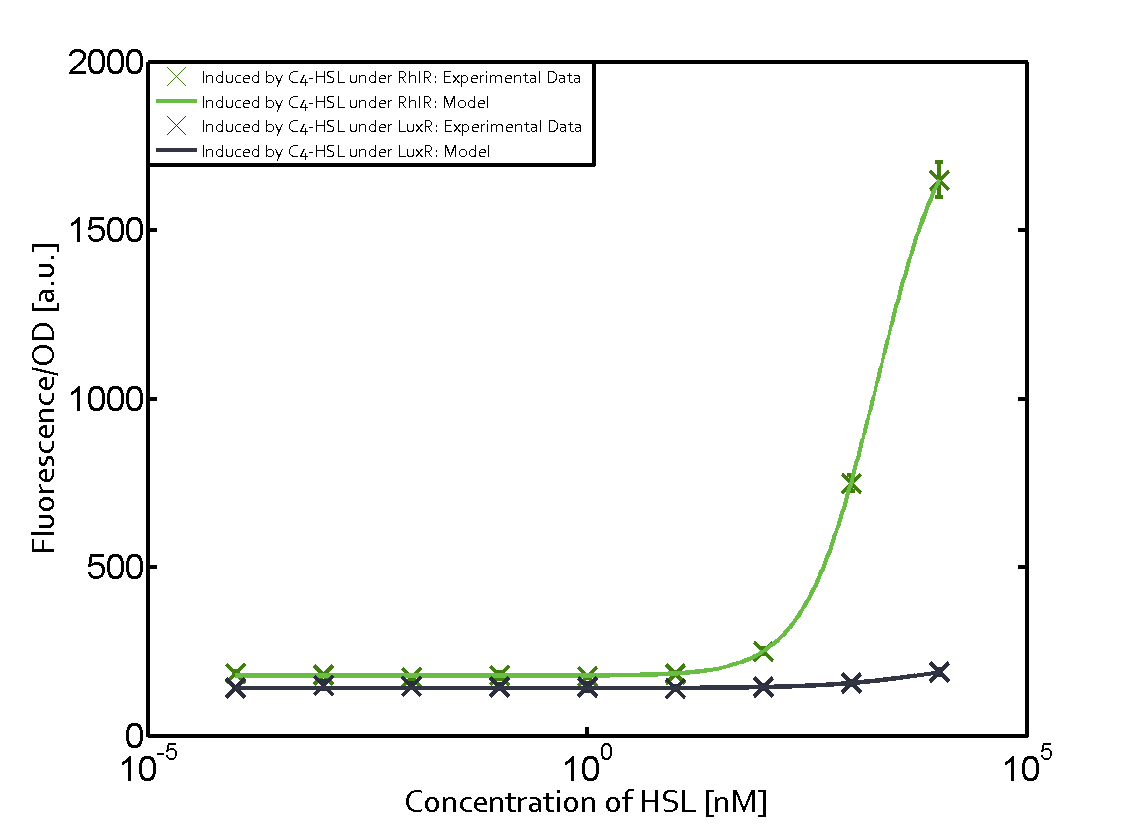
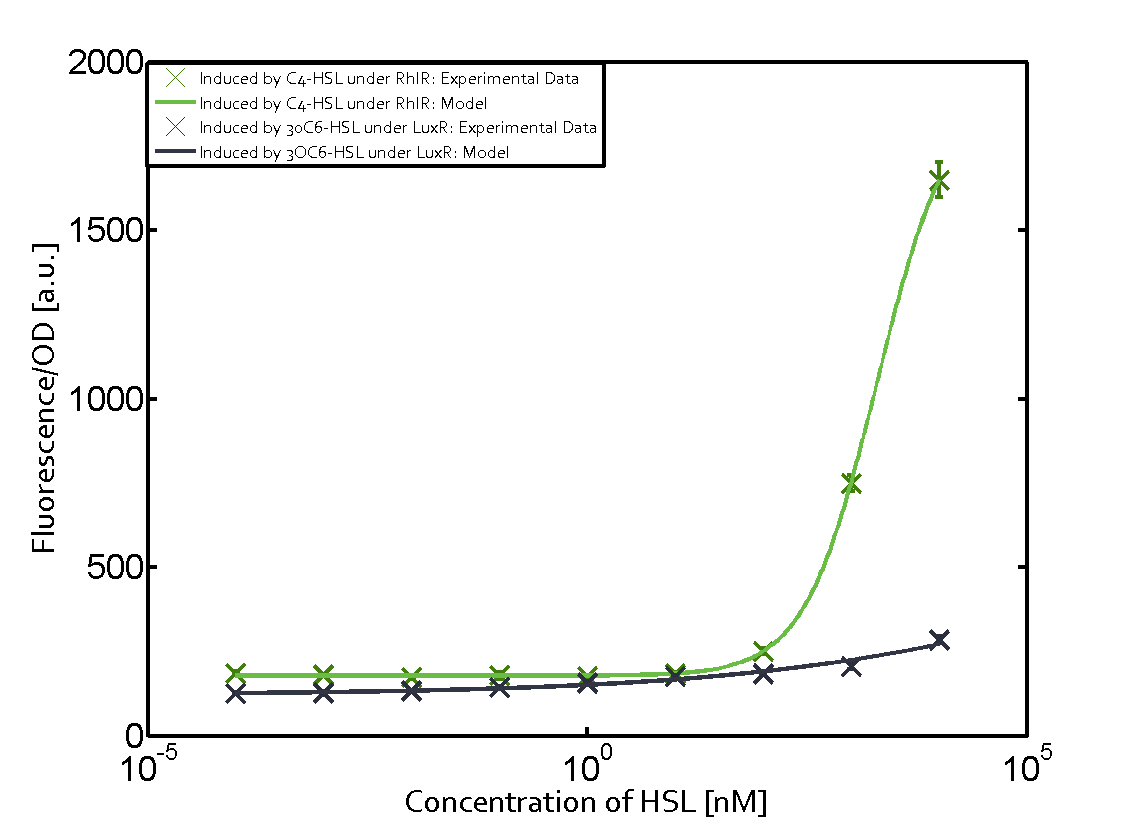
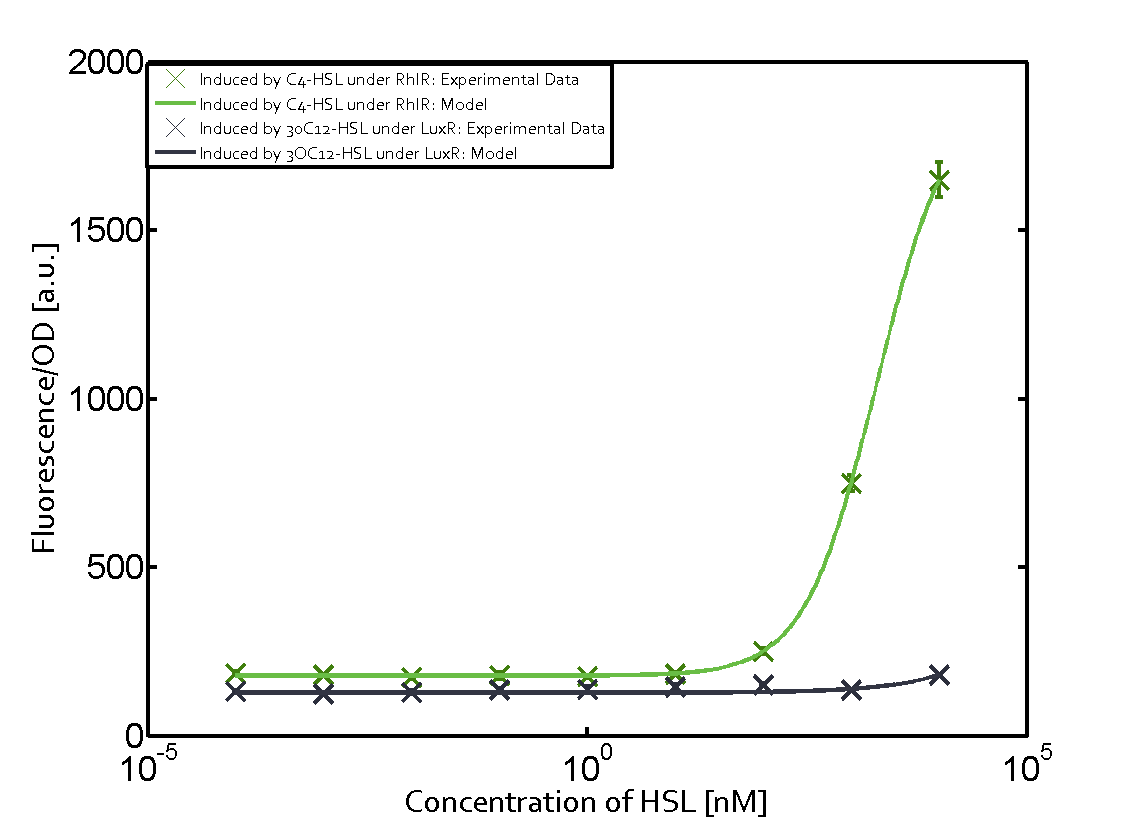
In this set of experiments the promoter pRhl was tested for potential crosstalk. In the top left position we observe the induction of pRhl by C4-HSL bound to the regulator RhlR. The switching behaviour was observed at a C4-HSL concentration of 1 μM. In the case of 3OC12-HSL binding the RhlR regulator and subsequently the promoter pRhlinsignificant crosstalk has been observed. Severe crosstalk was observed in the case of 3OC6-HSL binding the RhlR regulator followed by induction of pRhl. The transition occurred at a concentration of the inducer molecule of 1 μM but compared to the reference curve a lower value of fluorescence per OD was observed (1000 a.u.). Another case of crosstalk with the pRhl was detected with 3OC12-HSL binding to the corresponding LasR regulator followed by inducing the promoter pRhl. Here switching occurred at a concentration 1 nM of 3OC12-HSL and reached fluorescence per OD of 750 a.u.. This is approximately 0.5 fold the value of the fluorescence per OD shown by the reference curve indicated in green. | |||

|
|
|
| ||

|

|

| |||
|
|
| |||
|
|
| |||
Modeling crosstalk
Each experimental data set was fitted to an Hill function using the Least Absolute Residual method.
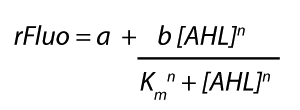
The fitting of the graphs was performed using the following equation :
rFluo = the relative fluorescence (absolute measured fluorescence value over OD)[a.u.]
a = basal expression rate [a.u.](“leakiness”)
b = maximum expression rate [a.u.]("full induction")
n = Hill coefficient (“cooperativity”)
Km = Half-maximal effective concentration (“sensitivity”)
[AHL] = AHL concentration [nM]
| C4-HSL | 3OC6-HSL | 3OC12-HSL | |
|---|---|---|---|
| RhlR | a = 178.4 (174.9, 182) [a.u.] n = 1.053 (0.9489, 1.157) Km = 1969 (1625, 2313) [nM] b = 1736 (1629, 1842) [a.u.] |
a = 169.1 (155.2, 182.9) [a.u.] n = 0.507 (0.2303, 0.7837) Km = 1.08e8(0, 2.681e10) [nM] b = 9.708e4 (0, 1.192e7) [a.u.] |
a = 162.8 (150.4, 175.1) [a.u.] n = 0.404 (0, 0.998) Km = 9.627e8 (0, 7.824e11) [nM] b = 2.537e4 (0, 8.109e6) [a.u.] |
| LuxR | No crosstalk | No crosstalk | No crosstalk |
| LasR | No crosstalk | No crosstalk | a = 149.3 (140.6, 158.1) [a.u.] n = 1.366 (0.808, 1.923) Km = 1.674 (1.259, 2.09) [nM] b = 628.9 (599, 658.7) [a.u.] |
|}
|
Antiquity |
This review comes from the old result system and indicates that this part did not work in some test. |
UNIQd71aecefb69cf5e1-partinfo-00000003-QINU

