Part:BBa_C0012
lacI repressor from E. coli (+LVA)
Coding region for the LacI protein with an LVA degradation tail and without an RBS. LacI binds to the pLac regulator BBa_R0010 and PLlac01 hybrid regulator BBa_R0011 and inhibits transcription. [http://openwetware.org/wiki/IPTG IPTG (Isopropylthiogalactoside)] binds to LacI and inhibits its operation, therefore promoting transcription.
A rapid degradation tail (LVA) has been added to improve the switch time for High to Low performance of this part.
Usage and Biology
This particular LacI protein was derived from E. coli and contributed by Michael Elowitz. (See Part Design for more information.)
- Allergen characterization of BBa_C0012: Not a potential allergen
The Baltimore Biocrew 2017 team discovered that proteins generated through biobrick parts can be evaluated for allergenicity. This information is important to the people using these parts in the lab, as well as when considering using the protein for mass production, or using in the environment. The allergenicity test permits a comparison between the sequences of the biobrick parts and the identified allergen proteins enlisted in a data base.The higher the similarity between the biobricks and the proteins, the more likely the biobrick is allergenic cross-reactive. In the full-length alignments by FASTA, 30% or more amount of similarity signifies that the biobrick has a Precaution Status meaning there is a potential risk with using the part. A 50% or more amount of identity signifies that the biobrick has a Possible Allergen Status. In the sliding window of 80 amino acid segments, greater than 35% signifies similarity to allergens. The percentage of similarity implies the potential of harm biobricks’ potential negative impact to exposed populations. For more information on how to assess your own biobrick part please see the “Allergenicity Testing Protocol” in the following page http://2017.igem.org/Team:Baltimore_Bio-Crew/Experiments
For the biobrick Part:BBa_C0012, there was a 0% of identity match and 0% similarity match to the top allergens in the allergen database. This means that the biobrick part is not of potential allergen status. In 80 amino acid alignments by FASTA window, no matches found that are greater than 35% for this biobrick. This also means that there is not of potential allergen status.
>Internal Priming Screening Characterization of BBa_C0012: Has 1 possible internal priming site between this BioBrick part and the VF2 primer. This BioBrick part also has 4 possible internal priming site between this part and the VR primer.
The 2018 Hawaii iGEM team evaluated the 40 most frequently used BioBricks and ran them through an internal priming screening process that we developed using the BLAST program tool. Out of the 40 BioBricks we evaluated, 10 of them showed possible internal priming of either the VF2 or VR primers and sometime even both. The data set has a range of sequence lengths from as small as 12 bases to as large as 1,210 bases. We experienced the issue of possible internal priming during the sequence verification process of our own BBa_K2574001 BioBrick and in the cloning process to express the part as a fusion protein. BBa_K2574001 is a composite part containing a VLP forming Gag protein sequence attached to a frequently used RFP part (BBa_E1010). We conducted a PCR amplification of the Gag-RFP insert using the VF2 and VR primers on the ligation product (pSB1C3 ligated to the Gag + RFP). This amplicon would serve as template for another PCR where we would add the NcoI and BamHI restriction enzyme sites through new primers for ligation into pET14b and subsequent induced expression. Despite gel confirming a rather large, approximately 2.1 kb insert band, our sequencing results with the VR primer and BamHI RFP reverse primer gave mixed results. Both should have displayed the end of the RFP, but the VR primer revealed the end of the Gag. Analysis of the VR primer on the Gag-RFP sequence revealed several sites where the VR primer could have annealed with ~9 - 12 bp of complementarity. Internal priming of forward and reverse primers can be detrimental to an iGEM project because you can never be sure if the desired construct was correctly inserted into the BioBrick plasmid without a successful sequence verification.
For the BioBrick part BBa_C0012, the first location of the internal priming site is on the 207-214 base number of the BioBrick and on the 1-8 base number of the VF2 primer. The first location of the internal priming site is on the 628-622 base number of the BioBrick and on the 13-19 base number of the VR primer. The second location of the internal priming site is on the 947-941 base number of the BioBrick and on the 4-10 base number of the VR primer. The third location of the internal priming site is on the 778-784 base number of the BioBrick and on the 1-7 base number of the VR primer. The fourth location of the internal priming site is on the 1015-1021 base number of the BioBrick and on the 4-10 base number of the VR primer.
Tsinghua 2018's characterization
The Relation between LacI Concentration and IPTG Induction Efficiency
I Background
In order to investigate how lacI dosage affects IPTG induction, we used Anderson promotor J23100, J23110 and J23114 to design three constitutive lacI generators of different intensities. The three lacI generators were then ligated with Ptac driven reporter sfGFP to make three IPTG induction devices (BBa_K2558203, BBa_K2558204, BBa_K2558205). By measuring sfGFP fluorescence we tested how these devices react to IPTG.
II Results
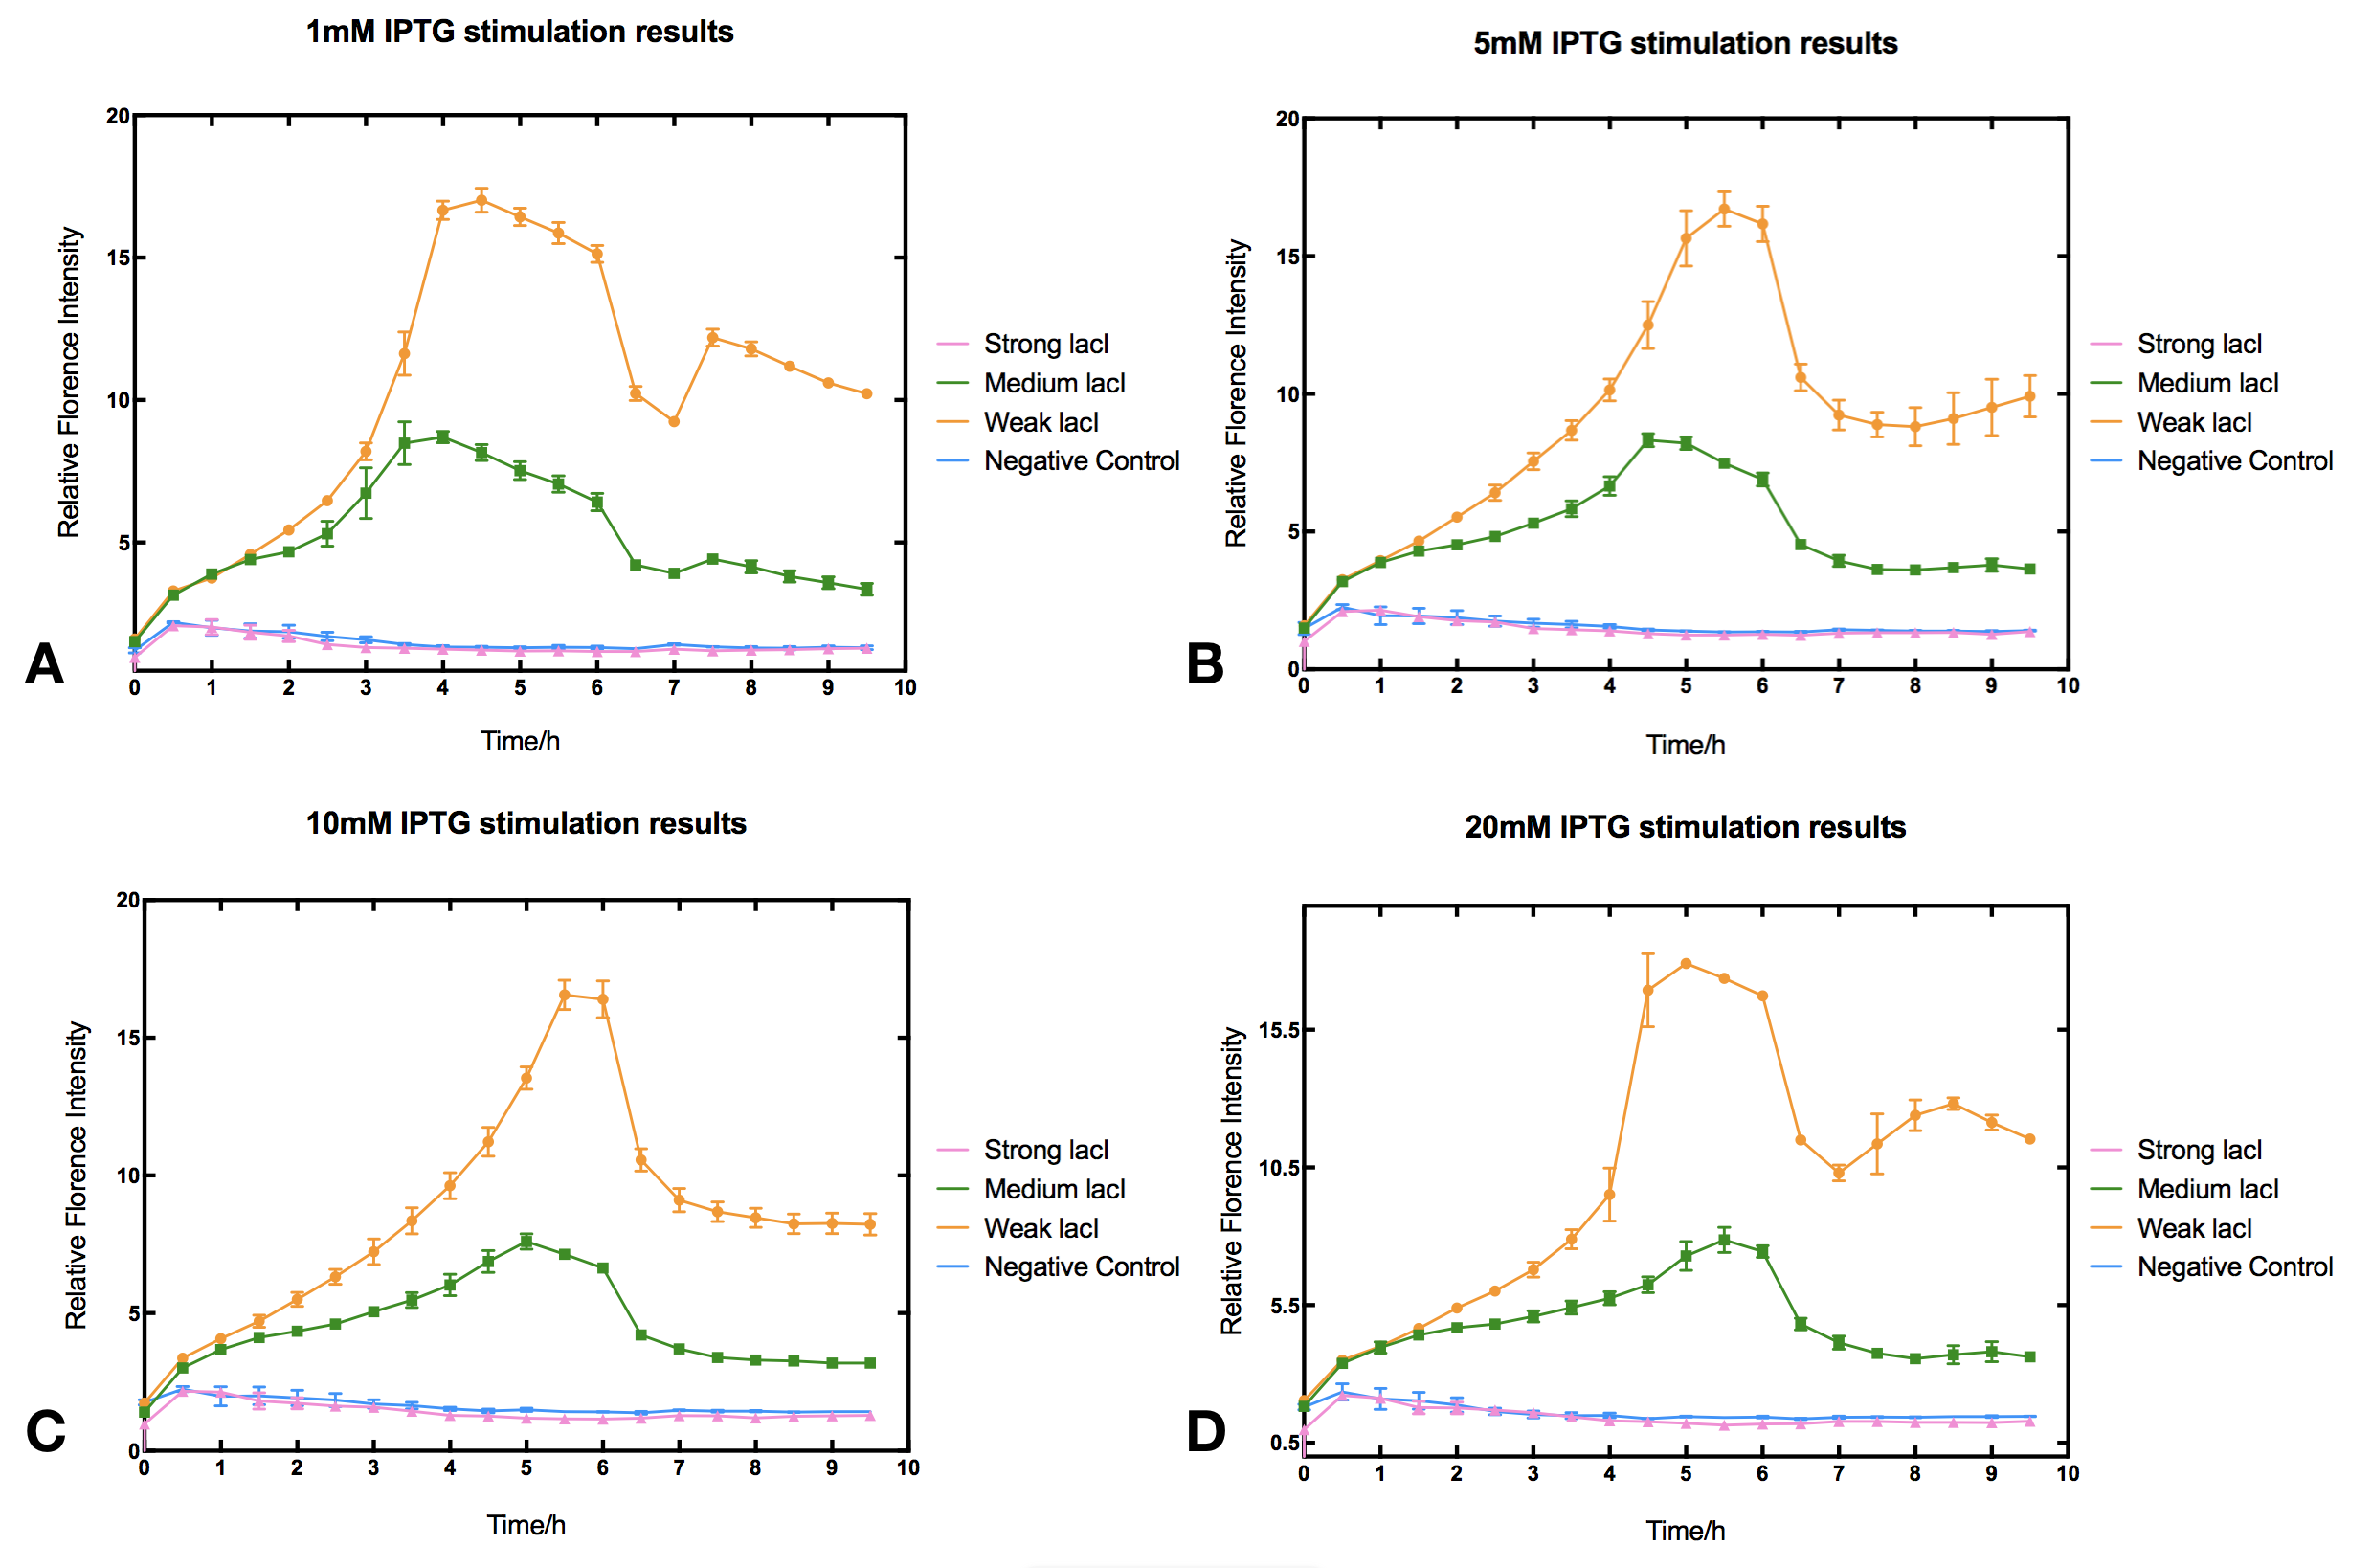
With high level of lacI expression (BBa_K2558203), sfGFP fluorescence had almost no response to IPTG induction. Weak lacI expression (BBa_K2558205) had the most significant IPTG induced sfGFP expression. With medium lacI expression level (BBa_K2558204), the induction efficiency lay in between. Therefore, the result proves that high level of lacI expression severely decreases IPTG induction efficiency [1]. Furthermore, IPTG concentration can affect the regulation part performance. The figure shows that without IPTG the sfGFP florescence intensity remained low. After IPTG addition, fluorescence signal immediately began to climb, forming a peak at five hours after induction, then sfGFP florescence intensity decreased and maintained at a lower level afterwards. IPTG concentration did not significantly affect the height of the peak or the expression level after the peak, but rather the peak width and expression stability of the system. Figures indicate that 5-10 mM IPTG had the most stable induction results.

III Protocol
- one Transform the plasmids into E. coli DH5α.
- two Pick a single colony by a sterile tip from each of the LB plates for all the experimental and control groups. Add the colony into 5ml M9 medium with ampicillin at 100 ng/µl. Incubate for 6-8 h at 37℃ in a shaker.
- three Measure OD600 of the culture medium with photometer. Dilute the culture medium until OD600 reaches 0.6.
- four Add 100 µl bacteria culture medium into a sterile 96-well plate. Add IPTG to final concentrations of 0, 1, 5, 10, 20 mM. Fresh M9 medium serves as blank control. Positive control is colony constantly expressing sfGFP and negative control is colony without sfGFP expression. Place the 96-well plate into an automatic microplate reader. Incubate at 16℃ overnight and record the fluorometric value at 510 nm and OD600 for each well every 30 minutes.
- five Each group should be repeated for at least 3 times.
IV Reference
[1] Szabolcs Semsey, Sandeep Krishna. "The effect of LacI autoregulation on the performance of the lactose utilization system in Escherichia coli" Nucleic Acids Res 2013 Jul; 41(13): 6381–6390
2019 Fudan-TSI's Improvement
Overview
This year team Fudan-TSI has upgraded LacI repressor coding gene to a new version (BBa_K3257045 https://parts.igem.org/Part:BBa_K3257045). With lacIq promoter (BBa_K3257003 https://parts.igem.org/Part:BBa_K3257003) and rrnB T1 terminator (BBa_K3257020 https://parts.igem.org/Part:BBa_K3257020), improved LacI protein can be expressed and function properly in the Escherichia coli BL21(DE3). We used EGFP as a reporter controlled by our improved Lac operon and measured its green fluorescence over time.
For detailed design, please refer to https://parts.igem.org/Part:BBa_K3257045.
For a composite LacI repressor protein expression system, please refer to https://parts.igem.org/Part:BBa_K3257100.
According to our experiment, our Lac operon is improved in the following three main aspects.
Results
Lower Response to Arabinose, Better Orthogonality
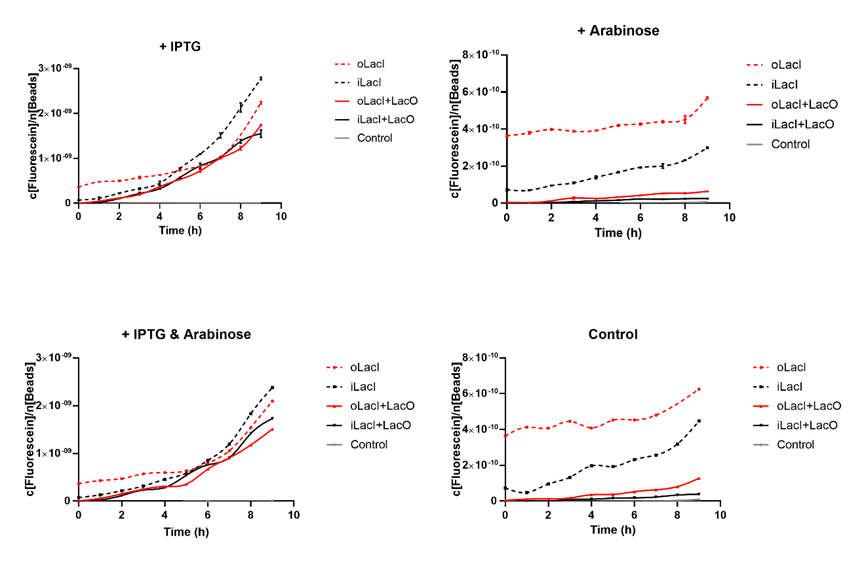
Cross talk between the response to IPTG and arabinose has been a defect of the wild type Lac operon. When 4mM arabinose added, a few lac inhibitors detach from lac operator which means that it is induced in a relatively low but unignorable level. According to the measurement of our experiment, our improved LacI can respond to IPTG with better orthogonality. The figure below (Figure 1) is the measurement of the fluorescence of EGFP controlled by wild-type and improved Lac operon. It shows that when 4mM arabinose is added, oLacI(wild-type LacI) is induced at a significantly high level while iLacI(improved LacI) is induced at a lower level.

Higher level of induction than the Wild-type Lac operon when Induced by IPTG
Next step we prove that our improved Lac operon can be better induced by IPTG, which counts a great deal for the usage of this operon. The figure below (Figure 2) is the measurement of the fluorescence of EGFP controlled by wild-type and improved Lac operon. It shows that when 1mM IPTG is added, EGFP controlled by both operons can be disinhibited and the improved LacI is induced at a relatively higher level.

Lower Uninduced Leakage
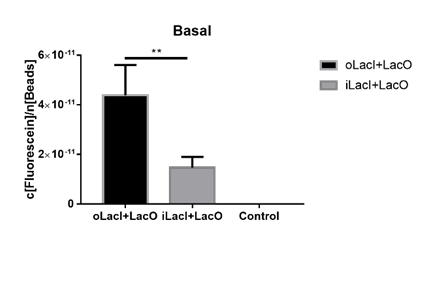
The uninduced leakage level is also an important parameter of an operon. Improved LacI lowers the leakage level compared to the wild-type one. The figure below (Figure 3) is the measurement of the fluorescence of EGFP controlled by wild-type and improved Lac operon. When no IPTG or arabinose is added, the fluorescence of EGFP controlled by improved Lac operon is under the detection range while the fluorescence of EGFP controlled by wild-type Lac operon remains a detectable signal indicating a considerably undesired leakage.

References
[1] Adam J. Meyer, Thomas H. Segall-Shapiro, Emerson Glassey, Jing Zhang & Christopher A. Voigt. Escherichia coli “Marionette” strains with 12 highly optimized small-molecule sensors. Nature Chemical Biology volume 15, pages196–204 (2019)//function/regulation/transcriptional
| direction | Forward |
| function | Rep |
| ligands | allolactose, IPTG |
| protein | LacI |
| swisspro | P03023 |
| tag | LVA |

 1 Registry Star