
 1 Registry Star
Part:BBa_E0040
green fluorescent protein derived from jellyfish Aequeora victoria wild-type GFP (SwissProt: P42212
GFP (mut3b) [note that this part does not have a barcode]
Contribution of OUC-China 2022
Usage: Characterization of SSRE promoter in Aureobasidium melanogenum
We got GFP gene synthetized by a company after optimizing the codon of the part BBa_E0040.Then we cloned GFP gene into our electrocompetent plasmid. We co-transfected this plasmid with AtCRE1-electrocompetent plasmid. We selected 583bp specific fragment of AtCRE1 gene (Lane 1 ) and the whole length of PTP2+GFP (Lane 4) to test transformation. Then we amplifying the targeted gene of genome extracted respectively. Shown in figure1, we successfully introduced all our target sequence into Aureobasidium melanogenum.

In order to better characterize the SSRE promoter, we optimized the codon of the part BBa_E0040 and expressed it in Aureobasidium melanogenum, expanding the application chassis range of this part. The sequence optimized of the codon also can be a suitable part for the team committed to developing the potential of Aureobasidium melanogenum.

Contribution of LZU-CHINA 2021
Usage: Construction of SARS-CoV-2 pseudovirus
We cloned GFP gene into a third generation lentiviral plasmid.We co-transfected this lentiviral plasmid, PAX2 and a plasmid carried SARS-CoV-2 spike protein gene into 293T cells. The spike protein of SARS-CoV-2 in cell and medium was detected by Western-blot. HEK293T cells were transfected for 40 h. RIPA lysis buffer was used to lyse cells. pMD2.G plasmid is used as control.
The samples were separated by SDS-PAGE and transferred to PVDF membrane for Western Blot detection. The membrane was incubated with primary antibody and secondary antibody. We observed the result after using ECL chemiluminescence reagent.

Then We added the medium containing pseudovirus to ACE2-293T stable cell line. After 48h, fluorescence microscope was used to observe the infection effect. As the result shows, pseudovirus is prepared successfully.

Jiangnan_China 2020 - Contribution
The green fluorescent protein (GFP) gene can be used as reporter gene and express in Starmerella bombocola. We want to use it to test the strength of promoters.
We built a device(BBa_K3402050) and transfer the expression cassette into Starmerella bombocola to observe the fluorescence intensity. This device consists of the promoter, the GFP gene(BBa_K3402000) and a terminator with the constructed vector. Besides, the hygromycin resistance gene was also constructed into the plasmid as the marker gene to determine if the transformation is successful.
The transformed yeast was coated on a plate containing hygromycin. After 48 hours of incubation, the existed transformants were performed fluorescence observation and transcriptome analysis. As a result, the expression of the GFP gene in Starmerella bombocola is completed. Finally, we can link different promoters to yeGFP to know the strength of promoters by testing different fluorescence intensity of different promoters.

Usage and Biology: Characterization
Group: Valencia_UPV iGEM 2018
Author: Adrián Requena Gutiérrez, Carolina Ropero
Summary: We have adapted the part to be able to assemble transcriptional units with the Golden Gate method and we have done the characterization of this protein.
Documentation:
The characterization of this protein (and by extension of all the other part that codify for the GFP) was performed with our transcriptional unit BBa_K2656105.
This transcriptional unit was assembled in a Golden Braid alpha1 plasmid including the following parts:
- BBa_K2656004: the J23106 promoter in its Golden Braid compatible version from our [http://2018.igem.org/Team:Valencia_UPV/Part_Collection Part Collection]
- BBa_K2656009: the B0030 ribosome biding site in its Golden Braid compatible version from our [http://2018.igem.org/Team:Valencia_UPV/Part_Collection Part Collection]
- BBa_K2656022: This part.
- BBa_K2656026: the B0015 transcriptional terminator in its Golden Braid compatible version from our [http://2018.igem.org/Team:Valencia_UPV/Part_Collection Part Collection]
In order to carry out a correct characterization of the protein and to be able to use it to make measurements of the different transcriptional units that we assembled with it, we have obtained the emission and excitation spectra in the conditions of our equipment. By using this [http://2018.igem.org/Team:Valencia_UPV/Experiments#spectra protocol] with the parameters of Table 1, Figure 1 was obtained.
| Parameter | Value | ||
| Number of samples | 6 | ||
| Excitation Wavelength measurement range (nm) | [430-520] | ||
| Emission wavelenght (nm) | 545 | ||
| Emission Wavelength measurement range (nm) | [490-580] | ||
| Excitation wavelenght (nm) | 475 | ||
| Gain (G) | 70 | ||
| Table 1. Parameters used to obtain the spectra | |||

SBS_NY 2019 - Characterization
We used GFP as a critical reporter gene in our heavy metal biosensor and built four plasmids with GFP expression driven by MerR-GFP like heavy metal inducible repressors: CadR-GFP BBa_K3194007 MerR-GFP BBa_K3194008 CueR-GFP BBa_K3194009 ZntR-GFP BBa_K3194010
Under the relatively low concentration levels in our experiment, heavy metal cations didn't have an observable effect on GFP activity and signal strength.
Also, we designed a Low-Cost, all-solid-state GFP sensor and used its prototype measured the fluorescent output of BBa_E0040.
Usage and Biology
Untagged version of gfp from Repressilator reporter. See the design page for more source information.
The original citation for GFPmut3b is as follows:
Cormack, B.P., Valdivia, R.H., and S. Falkow. FACS-optimized mutants of green fluorescent protein (GFP). Gene 173: 33-38 (1996).
Here's the link: http://www.sciencedirect.com/science/article/pii/0378111995006850
Fluorescence wavelengths
Cormack et al.Cormack report the following excitation and emission data for GFPmut3 -
- Excitation max - 501nm
- Emission max - 511nm
Latency
Cormack et al.Cormack report detectable fluorescence within 8 mins. Please add maturation time data for E0040 here.
References
<biblio>
- Cormack pmid=10659856
</biblio>
Allergen characterization of BBa_E0040
The Baltimore Biocrew 2017 team discovered that proteins generated through biobrick parts can be evaluated for allergenicity. This information is important to the people using these parts in the lab, as well as when considering using the protein for mass production, or using in the environment. The allergenicity test permits a comparison between the sequences of the biobrick parts and the identified allergen proteins enlisted in a data base.The higher the similarity between the biobricks and the proteins, the more likely the biobrick is allergenic cross-reactive. In the full-length alignments by FASTA, 30% or more amount of similarity signifies that the biobrick has a Precaution Status meaning there is a potential risk with using the part. A 50% or more amount of identity signifies that the biobrick has a Possible Allergen Status. In the sliding window of 80 amino acid segments, greater than 35% signifies similarity to allergens. The percentage of similarity implies the potential of harm biobricks’ potential negative impact to exposed populations. For more information on how to assess your own biobrick part please see the “Allergenicity Testing Protocol” in the following page http://2017.igem.org/Team:Baltimore_Bio-Crew/Experiments
For the biobrick part, BBa_E0040, there was a 28.7% of identity match and 47.1% of similarity match compared to the top allergen in the database. This means that the biobrick part is NOT of potential allergen status. In the 80 amino acid alignments by FASTA, no matches found that are greater than 35% for this biobrick.
>Internal Priming Screening Characterization of BBa_E0040: Has no possible internal priming sites between this BioBrick part and the VF2 or the VR primer.
The 2018 Hawaii iGEM team evaluated the 40 most frequently used BioBricks and ran them through an internal priming screening process that we developed using the BLAST program tool. Out of the 40 BioBricks we evaluated, 10 of them showed possible internal priming of either the VF2 or VR primers and sometime even both. The data set has a range of sequence lengths from as small as 12 bases to as large as 1,210 bases. We experienced the issue of possible internal priming during the sequence verification process of our own BBa_K2574001 BioBrick and in the cloning process to express the part as a fusion protein. BBa_K2574001 is a composite part containing a VLP forming Gag protein sequence attached to a frequently used RFP part (BBa_E1010). We conducted a PCR amplification of the Gag-RFP insert using the VF2 and VR primers on the ligation product (pSB1C3 ligated to the Gag + RFP). This amplicon would serve as template for another PCR where we would add the NcoI and BamHI restriction enzyme sites through new primers for ligation into pET14b and subsequent induced expression. Despite gel confirming a rather large, approximately 2.1 kb insert band, our sequencing results with the VR primer and BamHI RFP reverse primer gave mixed results. Both should have displayed the end of the RFP, but the VR primer revealed the end of the Gag. Analysis of the VR primer on the Gag-RFP sequence revealed several sites where the VR primer could have annealed with ~9 - 12 bp of complementarity. Internal priming of forward and reverse primers can be detrimental to an iGEM project because you can never be sure if the desired construct was correctly inserted into the BioBrick plasmid without a successful sequence verification.
Part Characteristics in Cell-Free Chassis
| Parameter | Value and Description |
|---|---|
| Calibration | A conversion factor of 79.429 from Au to concentraion in nM |
| Half-life | 33 hours in the cell-free chassis, with a degradation constant of 0.0210 (in hours) |
Purificaton
GFPmut3b can be purified for calibration after the addition of a his-tag. The detailed [http://2007.igem.org/Imperial/Wet_Lab/Protocols/Prot1.6 protocols]and [http://2007.igem.org/Imperial/Wet_Lab/Results/Res1.6 results]for the purification can be found.
Calibration
The fluorescence of purified GFPmut3B was calibrated in the cell-free chassis. The derived [http://2007.igem.org/Imperial/Wet_Lab/Results/Res1.3 calilbration curve]allows the determination of the concentration of GFPmut3b in the cell-free chassis. [http://2007.igem.org/Imperial/Wet_Lab/Protocols/Prot1.3 Detailed protocols]for generating the calibration curve are available. Other calibration curves for are also available on the results page.

Degradation
The degradation of GFPmut3B in the cell-free chassis was also characterized. Purified GFPmut3B was allowed to degrade in the cell-free chassis and the fluorescence was measured over time. [http://2007.igem.org/Imperial/Wet_Lab/Protocols/Prot1.4 Detailed protocols]and [http://2007.igem.org/Imperial/Wet_Lab/Results/Res1.4 results]are attached.


From the semi-log plot, the degradation constant (in minutes) was derived to be 0.0003501, which is equivalent to GFPmut3b having a half-life of 33 hours in the cell-free chassis.
Expression of GFP-mut3b in cell lysate
Cell-free GFP-mut3b synthesis was analyzed in self-made E.Coli lysate from strain BL21(DE3). Fluorescence was measured at 37°C for five hours on a plate reader. For details on how the lysate and the energy solution were made and which components went into the final reaction volume of 10uL, check out our [http://2017.igem.org/Team:EPFL/Protocols protocols]. Shown are three repeats with a negative control as well as a shaded error graph (control was subtracted) summarizing the result. GFP-mut3b expression yields high signals in lysate and thus is a good choice of reporter while working on a cell-free chassis. Saturation occurs after about five hours.


IIT Delhi 2017 - Characterization of Photobleaching
Photobleaching is the phenomenon of irreversible damage to the fluorophore, such that after certain number of electronic transitions on absorption of photons, it cannot fluoresce anymore. This hinders the ability to continuously image a sample over a long period of time, thus acting as a bottleneck to the characterization pipeline. Therefore, it is of paramount importance to understand and characterize the bleaching effect so that an optimum time gap between successive images could be chosen. This would ensure that the fluorophores do not bleach and at the same time we don’t have to compromise on the amount of collected data due to the time gap.
Here, we characterize the photobleaching effect in wildtype GFP (E0040) using fluorescent microscopy with the etaluma Lumascope 500 microscope. Cells expressing GFP under the PhlF repressible promoter (BBa_K2525016) in the absence of PhlF, so that it constitutively expressed GFP. Cells were loaded in microfluidic chambers and droplet encapsulation was performed to capture a small number of cells. This droplet was continuously exposed to light corresponding to the excitation wavelength of GFP (~485 nm) and the emission was captured continuously as well. The real time video for photobleaching in the cells encapsulated in the droplet is shown in GIF 1. ImageJ was used to analyze the images to obtain the rate of photobleaching as shown in Fig 1. Where we have fitted an exponential curve to the total intensity over time. It is known that photobleaching has a first order decay. We obtain a photobleaching rate of 0.002 per second (7.2 per hour).


Amazonas_Brazil team - Caracterization in E. coli Nissle 1917
Characterization
Escherichia coli Nissle 1917 (EcN) is widely used as a probiotic since it’s discovery in the second half of the 19th century by Alfred Nissle1 and although many iGEM teams had worked with this bacteria, we couldn’t find any specific characterization about the manipulation of EcN. To improve the quality of our work and provide data for other teams or researchers that might want to work with this bacteria in their laboratory, we characterized EcN growth curve and it’s behavior when transformed by electroporation with the iGEM vector pSB1C3 with GFP and RFP.
E. coli Nissle 1917 strains were grown overnight in Lysogeny Broth (LB) containing ampicilin (100 µg/mL) at 37°C and 200 rpm. Cultures were diluted in fresh LB until achieve 0,1 OD with the corresponding antibiotic and transferred to a 96-well plate (50 µL/well). Samples were always made in triplicates and a blank of LB. During 8h the absorbance at OD600 and fluorescence (excitation 504 nm and emission 515 nm) were measured with intervals of 1 hour.
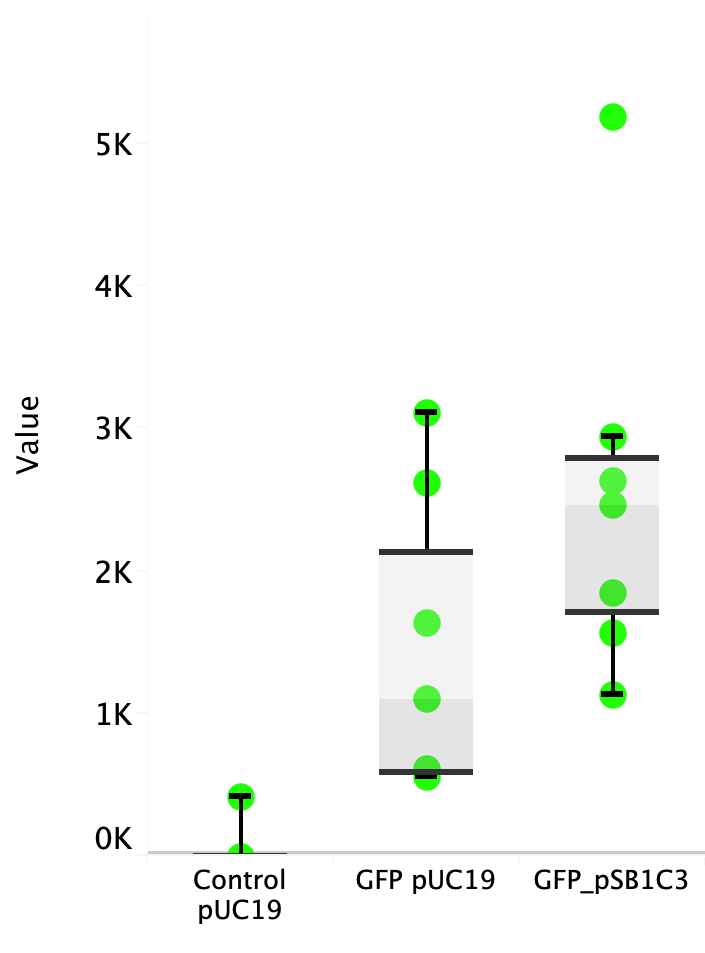
Fig. 1. Fluorescence values of E. coli Nissle 1917 curve(w/v)
Kyoto 2018 - Characterization
We tested nonspecifically interaction of GFP(E0040) by immunoprecipitation for characterization. The figure shows the result of immunoprecipitation by GFPnanobody.(link) Without GFP’s band, we can see same bands pattern in lane 2 and 6. This result shows GFP has no nonspecifically interaction with proteins of S.cerevisiae under physiological salt concentration. So, there is no problem when we identify the location of localized proteins that fused with this GFP. Otherwise, in lane 8, there is a unique band.(④) This band might shows GFP’s nonspecifically interaction under high salt concentrations. So, when we use this part, we have to experiment under physiological salt concentration.

Secondly,TDH3 promoter and CYC1 terminator were added to both ends of ORF and cloned into pRS316 which is a shuttle vector of S. cerevisiae and E. coli. The resulting plasmid was transformed into wild-type yeast strain BY 4741 to overexpress GFP in yeast.
Photographs of pellets recovered from the culture medium of yeast cells is below.As can be easily seen, the yeast pellet overexpressing GFP was colored in a pale yellow color.From this, it was confirmed that GFP of BBa_E0040 can be expressed in large amounts in yeast cells without changing the codon and that the expression level thereof is so large as to be visually observed under visible light without breaking the yeast.

Improvements
• Chlamydomonas reinhardtii chloroplast optimised: BBa_K2148009
•
Yeast- and FACS optimized GFP: BBa_K194001
• Yeast- and FACS optimized, fast degradable GFP: BBa_K194002
• RFC[1000] compatible GFP: BBa_K2294444
Improved by BNU-China 2019
We design a device for increasing the degradation rate of green fluorescent protein (GFP) by adding a 16-amino-acid-long tag replication protein A (RepA) at the N-terminal, therefore the green fluorescence will degrade sooner when expression ends. Please view BBa_K3036006 for more details| Protein data table for BioBrick BBa_E0040 automatically created by the BioBrick-AutoAnnotator version 1.0 | ||||||||||||||||||||||||||||||||||||||||||||||
|---|---|---|---|---|---|---|---|---|---|---|---|---|---|---|---|---|---|---|---|---|---|---|---|---|---|---|---|---|---|---|---|---|---|---|---|---|---|---|---|---|---|---|---|---|---|---|
| Nucleotide sequence in RFC 10: (underlined part encodes the protein) ATGCGTAAA ... CTATACAAATAATAA ORF from nucleotide position 1 to 714 (excluding stop-codon) | ||||||||||||||||||||||||||||||||||||||||||||||
Amino acid sequence: (RFC 25 scars in shown in bold, other sequence features underlined; both given below)
| ||||||||||||||||||||||||||||||||||||||||||||||
Sequence features: (with their position in the amino acid sequence, see the list of supported features)
| ||||||||||||||||||||||||||||||||||||||||||||||
Amino acid composition:
| ||||||||||||||||||||||||||||||||||||||||||||||
Amino acid counting
| Biochemical parameters
| |||||||||||||||||||||||||||||||||||||||||||||
| Plot for hydrophobicity, charge, predicted secondary structure, solvent accessability, transmembrane helices and disulfid bridges | ||||||||||||||||||||||||||||||||||||||||||||||
Codon usage
| ||||||||||||||||||||||||||||||||||||||||||||||
Alignments (obtained from PredictProtein.org)
| ||||||||||||||||||||||||||||||||||||||||||||||
| Predictions (obtained from PredictProtein.org) | ||||||||||||||||||||||||||||||||||||||||||||||
Subcellular Localization (reliability in brackets)
| Gene Ontology (reliability in brackets)
| |||||||||||||||||||||||||||||||||||||||||||||
Predicted features:
| ||||||||||||||||||||||||||||||||||||||||||||||
| The BioBrick-AutoAnnotator was created by TU-Munich 2013 iGEM team. For more information please see the documentation. If you have any questions, comments or suggestions, please leave us a comment. | ||||||||||||||||||||||||||||||||||||||||||||||
Nanjing 2019 - Characterization
We adapted the part to be able to assemble our gene of interest (BBa_K3253003) with the cloning vector (BBa_K3253005) to test whether our gene of interest has already been successfully transferred to the Agrobacterium and our target plant. This florescent gene was expected to have its greatest excitement wavelength at 510nm, which is an indicator of the result of our transfer. Due the delay of the gene posting from the IGEM official for a month. The official promised that the gene would arrive at 10th August, but the actual Ghchi6 sequence arrived at China at 7th September. This is the main reason that we haven't finished our experiment on time. Please take this into consideration. We have shown our progress in our demonstration.
NYMU-Taipei 2019 - Characterization
We were searching for fluorescent protein-coding genes to be used in our project. This BBa_E0040 iGEM part was listed in the well 13L of Plate 4 of the 2018 Spring iGEM Distribution Kit. The plasmid backbone listed was pSB1A2 (see https://parts.igem.org/partsdb/get_part.cgi?part=BBa_E0040). We had tried several times to do transformation with the provided plasmid DNA on E. coli DH5_alpha cells and grow the transformed cells on Ampicillin plates. However, no colonies had shown up on the Ampicillin plates. Because most iGEM teams submitted their parts on pSB1C3 backbone plasmid, we then tried to plate the transformed cells on Chloramphenicol plates to see if we could find any growth, To our surprise, we did see colonies grow on the top of our Chloramphenicol plates. We were able to purify plasmid DNA out of liquid cultures from these transformed colonies. Therefore, we would like to share our characterization of this BBa_E0040 part with other iGEM teams trying to use this part in their project.
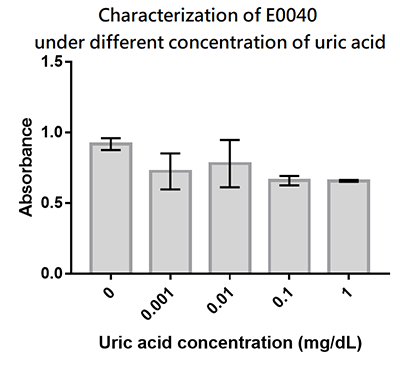
Hong_Kong_LFC_PC 2019 - Characterization
We designed a uric-acid-sensitive uricase generator for treating the gout disease. Since we will use the fluorescence protein to track the gene expression of the device, we would like to check the effect of uric acid on the signal of GFP. Since uric acid can alter the pH value, it may interfere the folding of GFP and lower its fluorescence signal. We treat the extracted GFP with different concentration of uric acid, and found that uric acid has a very little effect on the fluorescence signal. This indicate that our system is possible to track the gene expression.
Fudan-TSI 2019 - Characterization
2019 Team Fudan-TSI uses this part as a reporter protein to verify the ability of recovery mutation from EGFP mutants.
We focused our measurement on characterizing the fluorescence recovery of EGFP from its nonsense mutation in the following 4 ways:
1) Green fluorescence could be seen on the plate under UV light through naked eyes and recorded by a cellphone camera. Liquid culture could be placed in a culture dish and fluorescence is easily detectable under fluorescent microscopy.
2) We designed PCR primers to only amplify the recovered EGFP sequence but not the mutated version. The amplified band could be easily visualized after electrophoresis.
3) Fluorescence level was quantified through microplate reader according to fluorescein solutions and silicon beads, both standard samples are from the distributed measurement kit.
4) We ran PAGE gel of IPTG induced bacterial lysates. The mutated version produced a truncated protein at 17.8 kD, while the recovered EGFP is 26.9 kD.
We used multiple methods to ensure that EGFP is truly recovered from its nonsense mutation.
Naked eye detection
Escherichia coli (BL21) transformed with plasmid containing EGFP is coated on a petri dish and cultured for 12-14 h overnight. Then the dish lid is removed and placed on UV light. Green fluorescence is emitted from single-cell colonies and detectable through naked eyes (Fig. 1).

Fluorescence microscope observation
Single colony of Escherichia coli (BL21) transformed with plasmid containing EGFP is picked and cultured in liquid medium (2*YT). After overnight 37 ℃ culture, we transferred the liquid into an empty petri dish, and observed its fluorescence under a fluorescence microscope. Green fluorescence can be detected at the place of the bacteria solution while the rest of the plate as we expected. (Fig. 2).

PCR Verification
We designed a set of primers which cannot amplify the nonsense mutants (BBa_K3257031 & BBa_K3257032) of EGFP but is able to amplify the recovered EGFP. After PCR reaction, electrophoresis is performed and the recovered EGFP band is visibly bright while the mutant band does not appear (Fig. 3).

Fluorescence quantification through measurement kit
After being sure that the fluorescence recovered, we quantified its intensity with a microplate reader and the standard samples from distributed measurement kit. We followed the calibration protocol (https://www.protocols.io/view/calibration-protocol-plate-reader-fluorescence-cal-6zrhf56) from the measurement community.
Cell quantification
For OD600 measurement, we use the silica beads in the 2019 iGEM measurement kit as a standard substance. As a preparation, we have measured a particle standard curve of the silica beads from maximum concentration to 0 (pure ddH2O) and used iGEM official data processing excel to generate the particle standard curve. Then, we determined the best-fitted linear region with the maximum correlation coefficient R2 (Fig. 4a). Before each time we measure our samples, we will first measure the OD600 of the silica beads samples whose concentration are at both ends of the best-fitted linear region, which in our case, is from 300,000,000/100 μl to 18,750,000/100 μl for calibration of the particle standard curve. After measuring the bacteria liquid culture samples, we will change the OD600 to the number of particles according to the calibrated standard curve.
Fluorescence quantification
For fluorescence quantification, we use the fluorescein salt provided in 2019 iGEM measurement kit as a standard substance. As a preparation, we have measured a fluorescence standard curve of the fluorescein salt from maximum concentration to 0 (pure PBS) and used iGEM official data processing excel to generate the fluorescence standard curve. Then, we determined the best-fitted linear region with maximum correlation coefficient R2 (Fig. 4b). Before each time we measure our samples, we will first measure the fluorescence intensity of the fluorescein salt samples whose concentration are at both ends of the best-fitted linear region, which in our case, is from 10 μM to 0.0390625 μM for calibration of the fluorescence standard curve. After measuring the bacteria liquid culture samples, we have changed the fluorescence intensity to the concentration of fluorescein salt according to the calibrated standard curve.
Normalization
Finally, we would divide the fluorescein salt concentration by the number of silica beads for our final quantified fluorescence intensity which is c[fluorescein salt]/n[silica beads] and has a unit of μM/(pcs/100 μl).

SDS-PAGE
The EGFP nonsense mutant can only express a truncated peptide of 17.8 kD, while the full-length EGFP protein is 26.9 kD, the difference between their molecular weight could be visualized through SDS-PAGE. (Fig. 5)

SZTA_Szeged_HU - Characterization
Educational purpose in secondary school learning:
During our experiment, we used this GFP to create two plasmids that were transformed into E. coli (K12). The two inserts for the plasmids contained a Microcystis aeruginosa NIES-843 promoter region. From this promoter transcription can occur in both 3' and 5' directions, thus in one construct we put the GFP at the 3' and in the other construct we put it at the 5' end of the promoter. With these constructs we can measure whether the transcription occurs in both directions. We measured the transformed bacteria’s fluorescence emission with Vernier SpectroVis Plus Spectrophotometer + Fluorometer. This is a widely used device among secondary schools because it is easy and simple to measure with, thus this is a great instrument for teaching purposes.

It had an excitation point at 500nm, for this GFP it created an emission maximum at 490nm. We measure the emitted light's intensity at 490nm and 515nm, this value came from the literature.

The tables below represent the measured light intensity at 490nm and 515nm from the Microcystis cultures we cultivated on 24°C and 30°C. Every readout was multiplied by 1000.


- 10COMPATIBLE WITH RFC[10]
- 12COMPATIBLE WITH RFC[12]
- 21COMPATIBLE WITH RFC[21]
- 23COMPATIBLE WITH RFC[23]
- 25COMPATIBLE WITH RFC[25]
- 1000INCOMPATIBLE WITH RFC[1000]Illegal BsaI.rc site found at 644
SUSTech_Shenzhen 2020 characterization
Protein anti-CRISPR-associated 1 (Aca1) is expressed by T7 promoter, Aca1 will subsequently inhibit the anti-CRISPR promoter, so the gene expression downstream anti-CRISPR will be inhibited until Navitoclax (a compound that can inhibit Aca1 found by SUSTech_Shenzhen) is added artificially. Without the inhibition from Aca1, the expression of genes downstream anti-CRISPR promoter will increase significantly. Therefore, protein expression can be regulated artificially.
We characterised the efficiency of this part as a reporter in a protein regulation system, GFP was sufficiently expressed, which can directly reflect the efficiency of the regulation role of Navitoclax in our composite part BBa_K3423005.
The green fluorescence intensity regulated by navitoclax in part BBa_K3423005 is measured with microplate reader:

Improved by BNU-China 2020
We design a device for increasing the degradation rate of green fluorescent protein (GFP) in yeast by adding the first 124 amino acids of Clb2 at its N-terminal, therefore the green fluorescence will degrade sooner when expression ends. Please view BBa_K3506036for more details.
Estonia_TUIT 2021 team contribution
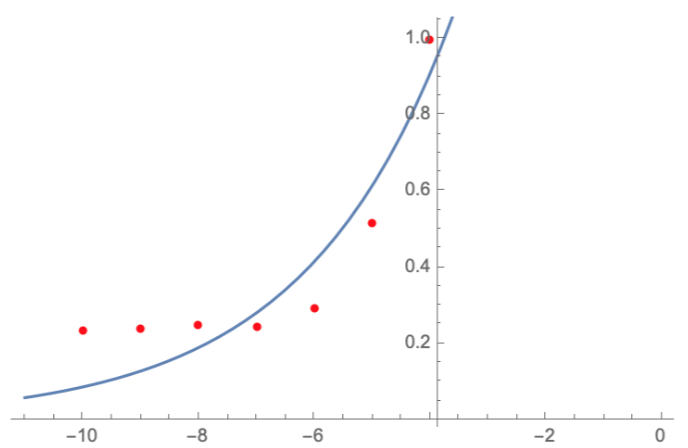
Green Fluorescent Protein (GFPmut3)
GFPmut3 is a simple (constitutively fluorescent) green fluorescent protein produced from Aequorea victoria that was first published in 1996. It is a weak dimer that matures very quickly. The green fluorescent protein (GFP) is a protein that emits bright green fluorescence when exposed to light in blue to ultraviolet range (Figure 1). It was first obtained from the jellyfish Aequorea victoria, hence it is also known as avGFP. Additional organisms with GFPs have been discovered since, including corals, sea anemones, zoanthids, copepods, and lancelets. It was discovered that the absorbance and fluorescence of green fluorescent protein (GFP) mutants are strongly pH-dependent in aqueous solutions and the intracellular compartments. pH titrations of purified recombinant GFP mutants indicated >10-fold reversible changes in absorbance and fluorescence with pKa values of 6.0 (GFP-F64L/S65T) with apparent Hill coefficient of approximately 1.

Figure 1. The emission and excitation spectra of GFPmut3b (GFPmut3b:: Fluorescent Protein Database). The light green graph corresponds to GFPmut3 excitation spectra, and the neon green graph corresponds to GFPmut3 emission spectra. It can be seen that the excitation maximum for the GFPmut3 is at 500 nm, and the emission maximum is at 513 nm. The extinction coefficient was 89,400 M-1cm-1. The quantum yield was 0.39.
Confocal microscopy settings for GFPmut3 can be found in Table 1 (Imaging Fluorescent Proteins | Nikon’s MicroscopyU).
Table 1. Fluorescent Nikon microscope A1 HD25/A1R HD25 settings for GFP (wt).
| Excitation Laser (nm) | Excitation Filter CWL / BW (nm) | Dichromatic Mirror Cut-On (nm) | Barrier Filter CWL / BW (nm) | Relative Brightness (% of EGFP) |
| Argon (488) | 450/50 | 480LP | 510/50 | 48 |
References
- Imaging Fluorescent Proteins | Nikon’s MicroscopyU. (n.d.). Retrieved October 15, 2021, from https://www.microscopyu.com/techniques/fluorescence/fluorescent-protein-imaging-parameters
Improved by Tianjin 2021
Ubiquitin is a small protein found in all eukaryotes whose primary function is to label a protein to be quickly recognized and degraded by the proteasome in the cell. We added a ubiquitin tag before the GFP structural gene, which would result in faster recognition and degradation of the expressed ubiquitin-tagged-GFP fusion protein by the ubiquitin degradation mechanism.Please view BBa_K3939111for more details.
Improved by HS_China 2022
We have added a new signal peptide to the N side of E0040. The new part is : BBa_K4183005(Group: iGEM2022 HS_China)
Improved by HS_Shanghai 2023
We have added a new protein degradation tags to the C side of E0040. The new part is : BBa_K4698007//chassis/prokaryote/bsubtilis
//chassis/prokaryote/ecoli
//function/reporter/fluorescence
| color | Green |
| direction | Forward |
| emission | |
| emit | 511 |
| excitation | |
| excite | 501 |
| kegg | |
| lum | |
| protein | GFPmut3b |
| swisspro | |
| tag | None |