
Part:BBa_K592009
amilCP, blue chromoprotein
This chromoprotein from the coral Acropora millepora, amilCP, naturally exhibits strong color when expressed. The protein has an absorbance maximum at 588 nm giving it a blue/purple color visible to the naked eye, thereby requiring no instruments to observe. The strong color is readily observed in both LB or agar culture, in less than 24 hours of incubation.
This part has been adaptated to B. subtilis with a LVA tail. by the UPMC-Paris Team in 2016. (see part BBa K2180019)
Usage and Biology
This part is useful as a reporter. In the pictures below it's built into BBa_K592015.


iGEM11_Uppsala-Sweden: Expression of chromoproteins. The images above show E coli constitutively expressing amilCP BBa_K592009 (blue), amilGFP BBa_K592010 (yellow) and RFP BBa_E1010 (red). Also see the green chromoprotein cjBlue BBa_K592011.

iGEM12_Uppsala_University: The Uppsala chromoprotein collection and RFP. The image shows pellets of E coli expressing chromoproteins eforRed BBa_K592012, RFP BBa_E1010, cjBlue BBa_K592011, aeBlue BBa_K864401, amilGFP BBa_K592010 and amilCP BBa_K592009.
References
[http://www.ncbi.nlm.nih.gov/pubmed/18648549] Alieva, N. O., et al. 2008. Diversity and evolution of coral fluorescent proteins. PLoS One 3:e2680.
[1] Levy, Appelbaum, Leggat, Gothlif, Hayward, Miller, & Hoegh-Guldberg. (2007). Light-responsive cryptochromes from a simple multicellular animal, the coral Acropora millepora. Science (New York, N.Y.), 318(5849), 467-70. GenBank: AY646075.1
Sequence and Features
- 10COMPATIBLE WITH RFC[10]
- 12COMPATIBLE WITH RFC[12]
- 21COMPATIBLE WITH RFC[21]
- 23COMPATIBLE WITH RFC[23]
- 25COMPATIBLE WITH RFC[25]
- 1000COMPATIBLE WITH RFC[1000]
CONTRIBUTION: Uppsala 2018
Authors iGEM Uppsala 2018, Matilda Brink, Elin Ramstrom.
The original native AmilCP sequence (Part:BBa_K592009) was codon optimized for E.coli K12 with a codon optimization tool provided by Integrated DNA Technologies (IDT). The codon optimized basic AmilCP part is attached to a constitutive promotor, RBS and a double terminator; Part:BBa_K2669003.
Purpose
The Uppsala 2018 team have performed a codon optimization on the original native AmilCP basic part in order to get a blue protein expression that can be maintained for a longer period of time through several generations of growth, hence making the expression of the blue chromoprotein more stable.
Method
In order to conduct a stability assay through liquid experiment, the codon optimized basic part and the original native AmilCP part was attached to a constitutive promotor, RBS and a double terminator separately. The two Biobrick parts were ordered as customized genes from IDT inserted in pUCIDT (Amp).
Both vectors were transformed into DH5-aplha E.coli cells through single tube transformation and yielded phenotypically blue colonies for cells containing plasmid with original part and plasmid containing codon optimized part. Stability assay through liquid experiemt was performed according to protocol [2].
Results

Figure 3: Results after 10 generations of growth. The upper row represents 10 different culture pellets of the cells with the plasmid containing the codon optimized sequence of AmilCP. The lower row represents 10 different culture pellets with the original native AmilCP (part:BBa_K592009) sequence incorporated in the plasmid.
Already after 10 generations of growth it was clearly visible that the color intensity was better distributed in the cells containing the plasmid with the codon optimized AmilCP sequence. The result confirms that the plasmid containing codon optimized part generates better maintenance of protein expression than the plasmid containing the original native part. The improved stability of expression makes this Biobrick part a good candidate as a reliable reporter or biosensor.
IMPROVEMENT REFERENCE: IONIS_PARIS 2017
The part used to improve BBa_K592009 (Group: iGEM11_Uppsala-Sweden) is : BBa_K2282006 (Group: iGEM17_IONIS-PARIS). https://parts.igem.org/Part:BBa_K2282006
IMPROVEMENT REFERENCE: Austin_UTexas 2017
The original blue chromoprotein part (BBa_K592009) was codon-optimized in order to increase its overall stability as a color reporter. The modified blue chromoprotein part is: BBa_K2253002 (Group: iGEM17_Austin_UTexas). Designed by Surta Dave.
IMPROVEMENT REFERENCE: DTU-Denmark 2017
A 6x his-tag was added to this part, to the C-terminal end of the expressed amilCP. The new part was submitted as BBa_K2355002 (Group: iGEM17_DTU-Denmark), Designed by:Philip Sørensen.
IMPROVEMENT REFERENCE: BNU-China 2017
The part was added to the end of a silk protein from honeybee. The new part is : BBa_K2220028(Group: iGEM17_BNU-China), Designed by: Jiawei Xing.
IMPROVEMENT REFERENCE: IISER Pune India 2017
The part was assembled with B0034 RBS and B0015 double terminator. The new part is : BBa_K2258003(Group: iGEM17_IISER Pune India), Designed by: Jyothish S.
IMPROVEMENT REFERENCE: Peshawar 2017
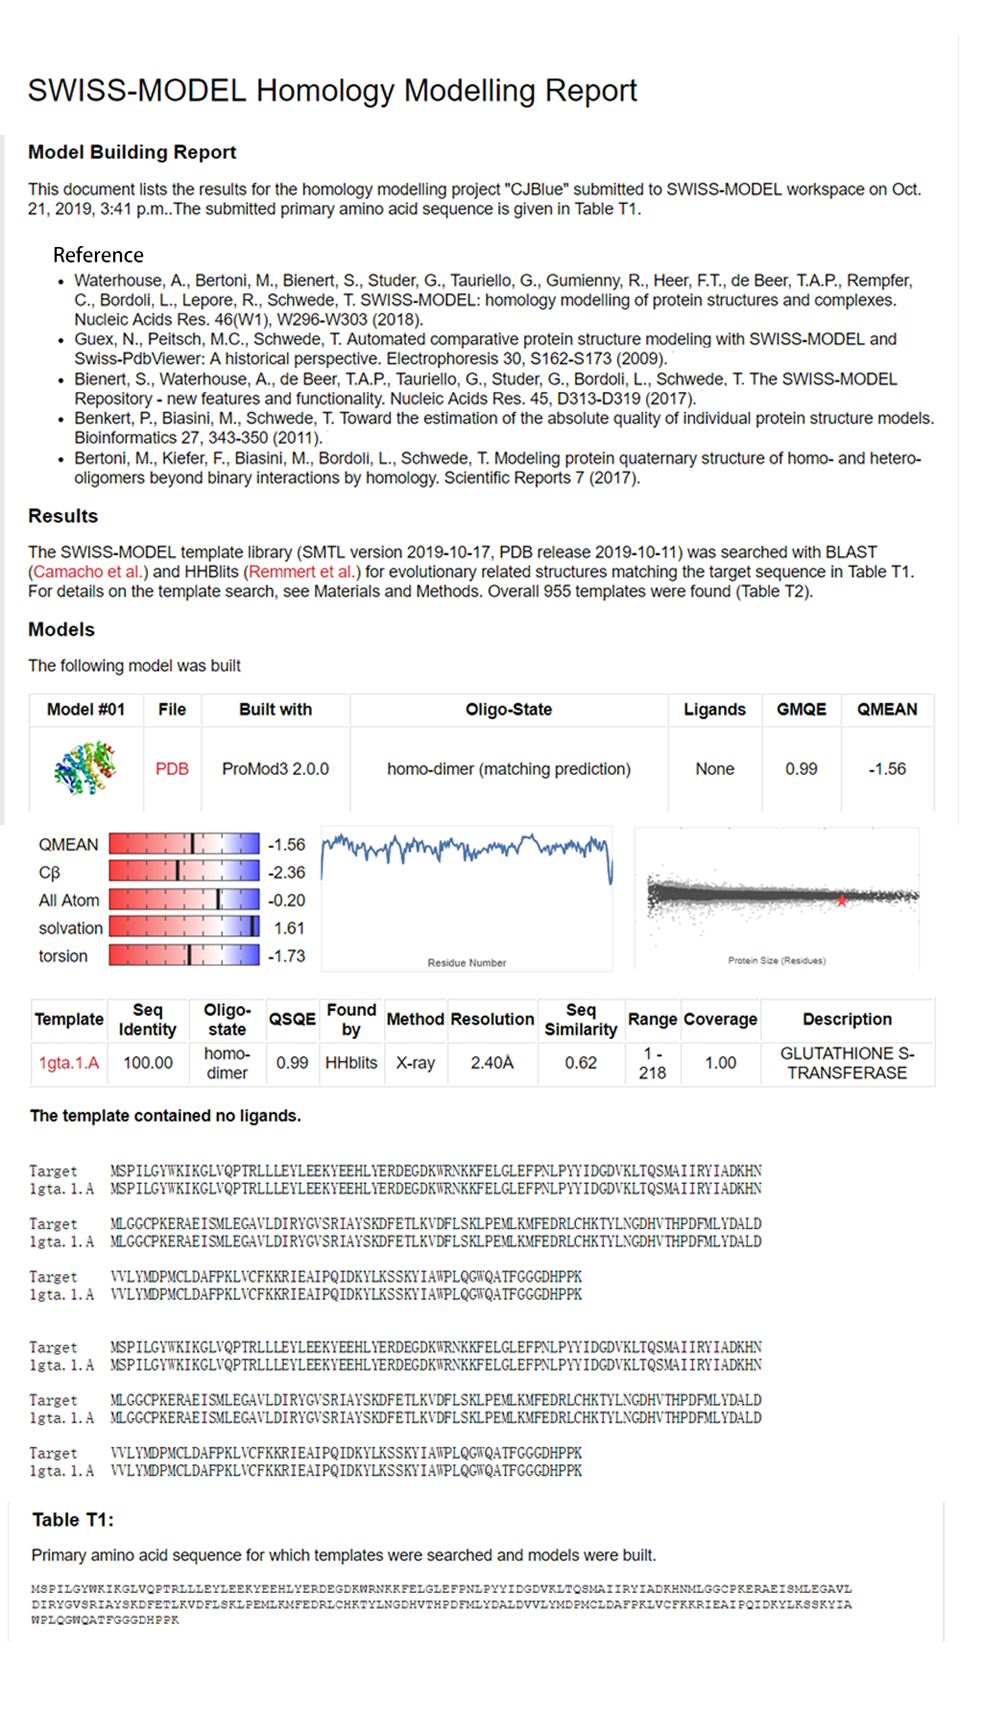
One of the most used chromoprotein used in iGEM is AmilCP blue, BBa_K592009. Because our modelling team was doing homology models for other proteins and AmilCP doesn't have a homology model on it's page, we decided to do one for AmilCP blue.
Click <a href="http://2017.igem.org/Team:Peshawar/Model" target="_blank"> here</a>to check out our modeling page!
IMPROVEMENT REFERENCE: UBrawijaya 2021
iGEM21_UBrawijaya 2021 assembled this part for overexpressing by utilizing the terminal display scaffold of the eCPX (BBa_K4080007 and BBa_K4080010).
Contribution: Valencia UPV iGEM 2018
Authors: Carolina Ropero, Adrián Requena Gutiérrez Part BBa_K2656018 is the amil Chromoprotein coding sequence BBa_K592009 compatible with both BioBricks and [http://2018.igem.org/Team:Valencia_UPV/GB3 Golden Braid 3.0] assembly methods.
In order to carry out a correct characterization of the protein and to be able to use it to make measurements of the different transcriptional units that we have assembled with it, we obtained the absorbance spectrum in the conditions of our equipment. To do so, we assembled composite part BBa_K2656113. By using this [http://2018.igem.org/Team:Valencia_UPV/Modeling#spectra protocol] with the parameters of Table 1, Figure 1 was obtained.
| Parameter | Value | ||
| Number of samples | 3 | ||
| Wavelength measurement range (nm) | [300-700] | ||
| Table 1. Parameters used to obtain the spectum | |||

IMPROVEMENT REFERENCE: NWU-China 2019
The N-terminus of this protein was added with a secreted peptide (Kp-Sp,BBa_K2981006). The new part is : BBa_K2981007(Group: iGEM19_NWU-China), Designed by: Junjie Zhu.
Contribution: Duesseldorf 2019
iGEM Duesseldorf characterized this protein in its capacity to be a biosensor molecule for fatty acids. It was assembled into the composite part BBa_K2924020 and tested with several fatty acids, at several concentrations.


The blue chromoprotein amilCP from Acropora millepora (BBa_K592009)1 was used as a reporter gene for a biosensor. The plan was to implement a chromoprotein as a reporter gene, thus enabling to every laboratory to measure a biosensor without fluorescence applications - in contrast, most laboratories have access to a photometer. The chromoprotein amilCP can be observed with the naked eye, in addition to the measurement method by absorption at the wavelength 588 nm for example with a plate reader. Therefore, this option is available for everyone.
The production of long-chain fatty acids (LCFA) is regulated by the transcription factor FadR. This transcription factor can bind to Acyl-CoA which leads to the release of FadR from its cognate operator sequence, thereby increasing gene expression as shown in Figure 2.
The constructs were cloned into a variant of the pBbB6c2 medium copy number backbone which lacked the lac-promoter, with the restriction sites EcoRI and XhoI. This backbone has the antibiotic resistance chloramphenicol and the origin of replication (ori) pBBR1. The E. coli strain Top10F was transformed with this biosensor plasmid, as seen in Figure 3.
The transformation of the organism was validated by colony PCR. In some cases, successful transformation could quickly be detected by the different colors of the colonies on the plate and as a cell pellet.

The positive clones were used for experiments and were grown in LB medium over night. The fatty acid stocks for the experiments were prepared. All of the fatty acids were dissolved in ethanol with the exception of butyric acid, which was dissolved in water. The stock solutions of the fatty acids are shown in Table 1. Tab.1: Stock solutions for different fatty acids
| Fatty acid | Chain length | MW [g/mol] | Solvent | Solubility | Stock concentration |
|---|---|---|---|---|---|
| Butyric acid | C4:0 | 88.11 | Water | 60 g/L | 200 mM |
| Capric acid | C10:0 | 172.26 | Ethanol | 30 g/L | 100 mM |
| Lauric acid | C12:0 | 200.32 | Ethanol | 20 g/L | 100 mM |
| Myristic acid | C14:0 | 228.37 | Ethanol | 15 g/L | 75 mM |
| Palmitic acid | C16:0 | 256.42 | Ethanol | 20 g/L | 75 mM |
| Stearic acid | C18:0 | 284.48 | Ethanol | 20 g/L | 50 mM |
| Oleic acid | C18:1 | 282.46 | Ethanol | 100 g/L | 200 mM |
The absorption of the overnight cultures was measured and the cultures were used to inoculate fresh LB medium to an OD600 of 0.05. The cultures were induced with different concentrations of fatty acids. First preliminary tests were carried out with palmitic acid at final concentrations of 0.4 mM, 1 mM and a control without fatty acid. For a better dissolving of the hydrophobic fatty acids in LB medium, Tergitol which was 0.5 % of the whole volume, was added to the medium. The induced samples were transferred on a 24 well plate and the plate was incubated overnight in a 37 °C incubator, which shaked the cultures with 250 rpm. After nearly 16 hours, the samples were taken out of the incubator and distributed on a 96 well plate in 200 µL aliquots. To account for biological heterogeneity and technical errors three biological replicates were measured in three technical replicates each. An empty vector control (EVC) was also supplemented with fatty acids at different concentrations and measured. All experimental details are listed in Tab. 2. Tab. 2: List of all part improvement experiments
| Construct | Fatty acid | Concentrations |
|---|---|---|
| PAR:amilCP | Lauric acid | 0 mM; 0.01 mM; 0.1 mM; 0.2 mM; 0.4 mM; 0.6 mM; 0.8 mM; 1 mM |
| PAR:amilCP | Myristic acid | 0 mM; 0.01 mM; 0.1 mM; 0.2 mM; 0.4 mM; 0.6 mM; 0.8 mM; 1 mM |
| PAR:amilCP | Palmitic acid | 0 mM; 0.01 mM; 0.1 mM; 0.2 mM; 0.4 mM; 0.6 mM; 0.8 mM; 1 mM |
| PAR:amilCP | Stearic acid | 0 mM; 0.01 mM; 0.1 mM; 0.2 mM; 0.4 mM; 0.6 mM; 0.8 mM; 1 mM |
| EVC | Lauric acid | 0 mM; 0.01 mM; 0.1 mM; 0.2 mM; 0.4 mM; 0.6 mM; 0.8 mM; 1 mM |
| EVC | Myristic acid | 0 mM; 0.01 mM; 0.1 mM; 0.2 mM; 0.4 mM; 0.6 mM; 0.8 mM; 1 mM |
| EVC | Palmitic acid | 0 mM; 0.01 mM; 0.1 mM; 0.2 mM; 0.4 mM; 0.6 mM; 0.8 mM; 1 mM |
| EVC | Stearic acid | 0 mM; 0.01 mM; 0.1 mM; 0.2 mM; 0.4 mM; 0.6 mM; 0.8 mM; 1 mM |

The experiments with the blue chromoprotein amilCP (BBa_K592009)1 showed that the production of the chromoprotein is increased by a higher concentration of fatty acids in the medium. The best result was achieved with the fatty acid stearic acid. The biosensor also worked for the chain lengths from C14:0 and C16:0. Here, the EVC is lower than the samples with amilCP. By adding lauric acid (C12:0) to the culture medium, the production of amilCP increased, but the EVC also increased in a similar manner close to amilCP, so it is not certain if this result can be used for distinct conclusion.
To summarise the experiments, the created biosensors works for the fatty acids myristic acid (C14:0), palmitic acid (C16:0) and stearic acid (C18:0) with every reporter gene. When using lauric acid (C12:0), the results become more inaccurate. A dose response can still be observed, but it is not as strong or linear as with the other fatty acids.
References
1: https://parts.igem.org/Part:BBa_K592009
2: Lee TS, Krupa RA, Zhang F, Hajimorad M, Holtz WJ, Prasad N, Lee SK, Keasling JD. ”BglBrick vectors and datasheets: A synthetic biology platform for gene expression.” J Biol Eng. 2011 Sep 20;5:12. 10.1186/1754-1611-5-12 PubMed 21933410
3: Fuzhong Zhang, James M Carothers, Jay D Keasling. “Design of a dynamic sensor-regulator system for production of chemicals and fuels derived from fatty acids” Nature Biotechnology volume 30, pages 354–359 (2012)
iGEM19_SCU-China:
The yamilCP(Part: BBa_K3221205) was improved from amilCP, which is a blue chromoprotein gene from Acropora millepora submitted by Team Uppsala-Sweden 2011.
We expected amilCP to be expressed efficiently in S. cerevisiae, so we chose amilCP to be improved. We processed codon optimization on original amilCP sequence and added a consensus sequence (AAAAAA) for S. cerevisiae expression. And the new sequence was named yamilCP.


Figure. 1 The map of plasmid pYES2-amilCP Figure. 2 The map of plasmid pYES2-yamilCP
We respectively cloned the amilCP and yamilCP on the vector of pYES2-NTA.There are the maps of pYES2-amilCP and pYES2-yamilCP (Figure.1 and Figure.2). And we verified the construction of them by double restriction enzyme digestion(Figure.3) and sequencing.

Figure. 3 The double restriction enzyme digestion verification result. lane 1: pYES2-amilCP plasmid, lane 2: pYES2-amilCP plasmid digestion, lane 3: pYES2-yamilCP plasmid, lane4: pYES2-amilCP plasmid digestion, Marker:Trans 2K plus Ⅱ Marker.
Then we transformed pYES2-amilCP and pYES2-yamilCP into S. cerevisiae respectively. Later on, We observed the expression of blue chromoprotein with the induction of galactose (Figure.4).

Figure. 4 The colony transformed pYES2-amilCP and pYES2-yamilCP expressed blue chromoprotein.
To test the expression effciency of pYES2-amilCP and pYES2-yamilCP in S. cerevisiae, we transformed them into BY4741 and used galactose to induce blue chromoprotein expression. After 10 days, we observed blue colonies on the pYES2-yamilCP plate at first and there was no blue colony on the pYES2-amilCP plate, which confirmed that yamilCP expressed more quickly than amilCP (Figure.5). As Figure. 5, there is no blue clony (0/356) on the amilCP plate while 8 colonies (8/575) on the yamilCP plate. It shows that our improvement is successful.
As the result, the improved yamilCP was successfully expressed, and the expression of yamilCP is more quickly than that of amilCP in S. cerevisiae.

Figure. 5 The transformation results of pYES2-amilCP and pYES2-yamilCP into S. cerevisiae BY4741 with galactose induction after 10 days.
NJTech_China 2019's Characterization
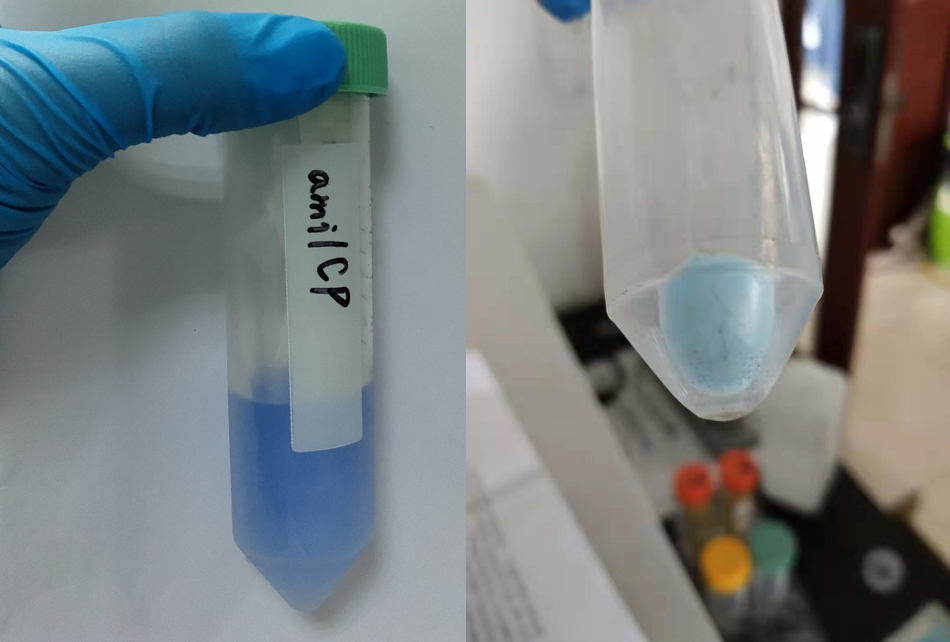
After sonication, the cells lysate was centrifuged. Then the supernatant was subjected to ultrafiltration and GST affinity chromatography. The blue chromoprotein were collected.
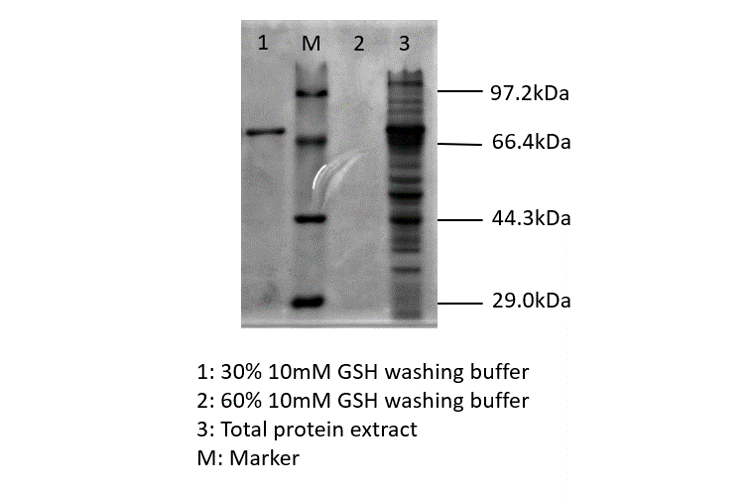
blue chromoprotein SDS-PAGE
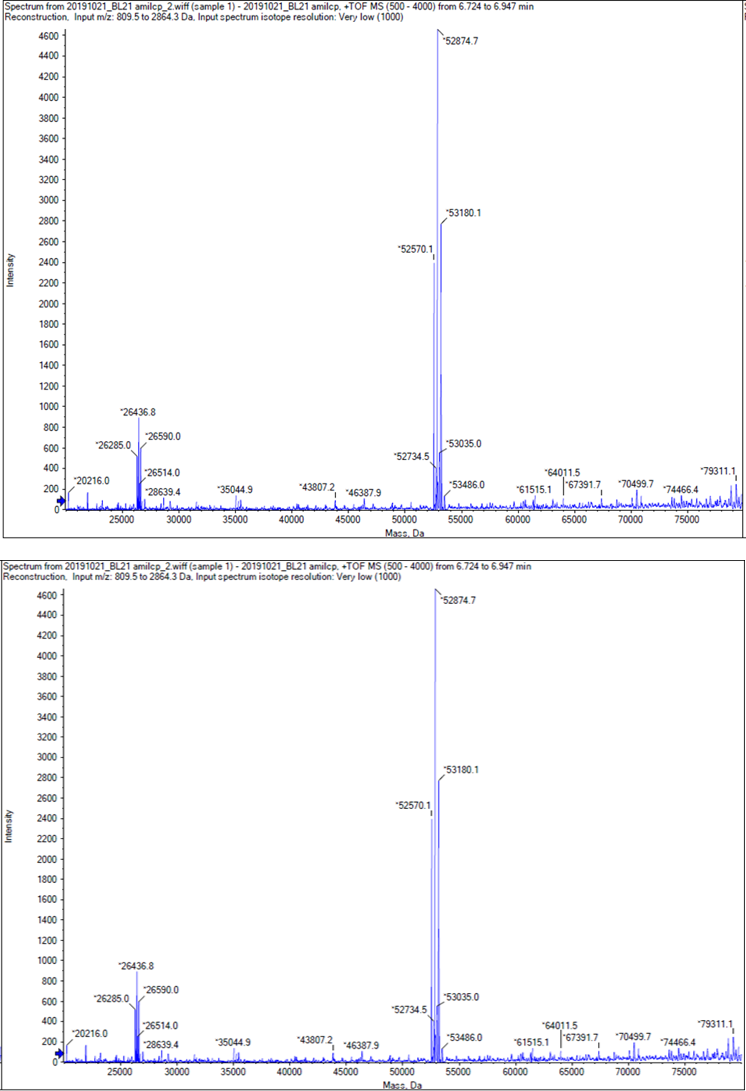
We performed TOF-Mass Spectrometry on the purified GST-tagged blue chromoprotein. The predicted molecular mass of this protein is about 50160Da, and the exact size is 52874.5-52874.7Da.
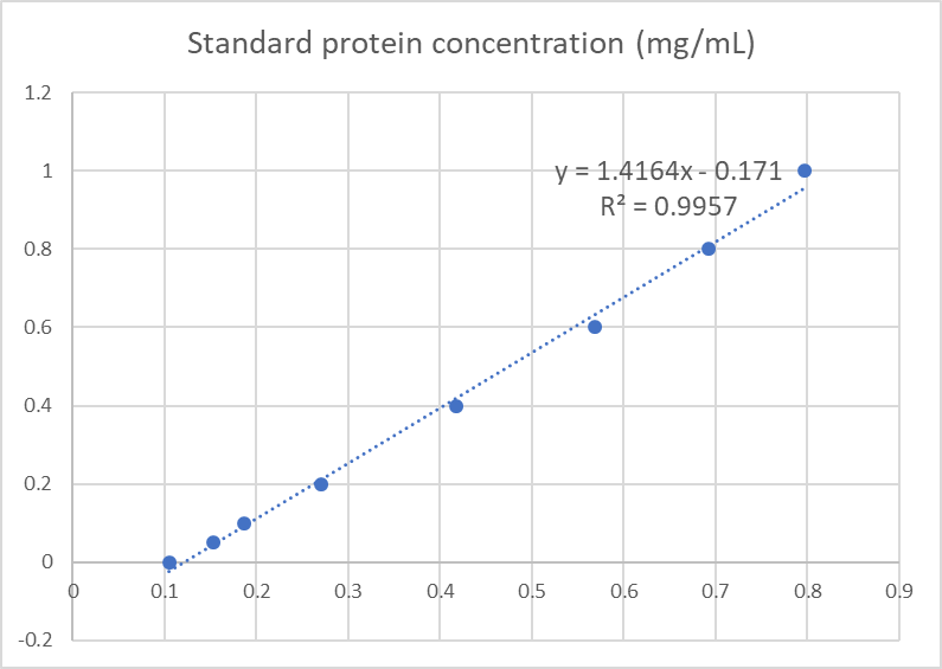
We used the BCA (Bicinchoninic acid) method to determine the concentration of blue chromoprotein for quantitative characterization. The concentration of blue chromoprotein was 2.73 mg/ml.
Functional Parameters: Austin_UTexas
Burden Imposed by this Part:
Burden is the percent reduction in the growth rate of E. coli cells transformed with a plasmid containing this BioBrick (± values are 95% confidence limits). This BioBrick did not exhibit a burden that was significantly greater than zero (i.e., it appears to have little to no impact on growth). Therefore, users can depend on this part to remain stable for many bacterial cell divisions and in large culture volumes. Refer to any one of the BBa_K3174002 - BBa_K3174007 pages for more information on the methods, an explanation of the sources of burden, and other conclusions from a large-scale measurement project conducted by the 2019 Austin_UTexas team.
This functional parameter was added by the 2020 Austin_UTexas team.
CONTRIBUTION: Exeter 2020
The Exeter 2020 team have investigated the expression of AmilCP under control of two putative constitutive promoters identified in the genome of B. subtilis 168. Details about these promoters can be found under the parts page BBa_K3371000 and BBa_K3371001. After transformation of E. coli DH5a with plasmids containing the AmilCP CDS under the control of our two promoters, we initially confirmed expression of AmilCP as our colonies appeared blue! We picked three blue colonies from each of the transformation plates and used them to inoculate E. coli cultures (in LB broth). We monitored growth of the cultures (OD 600nm, data not shown) and expression of the protein (A 420 nm, blue light region of the electromagnetic spectrum) over 24 h.

The graph shows that both our promoters drive expression of AmilCP but at different times during growth. With our promoter 30 BBa_K3371000 there is a ~3 h lag phase in expression and maximum expression occurs after 10 h. With our promoter 15 BBa_K3371001, there is no lag phase and maximum expression occurs earlier 7-8 h. Unfortunately due to the restricted time available in the lab we were unable to investigate further as to why this might be the case.
CSMU_Taiwan 2020 Improve
Group: CSMU iGEM 2020
Author: Huan-Jui Chang, Cheng-Ruei Yang, Hung-Yu Chen
Introduction
This year, CSMU wants to solve the problems revolving around diagnosing oral cancer, and we decided to use toehold switches as our detection device. Toehold switches are composed of 3 main parts: trigger binding site, ribosome binding site, and a reporter gene. We wanted to find the most suitable reporter gene which can be measured with ease. Therefore, we had tried different kinds of reporter genes. Including mRFP which has been mentioned in our contribution, invertase which is our new part. We also had tried amilCP, which is a blue chromoprotein that is visible to the naked eye. With our improvement, amilCP's expression can be controlled, just like adding an on and off switch. AmilCP would not be expressed without a specific trigger under the regulation of toehold switches. By doing so, it could turn out to be a useful diagnostic tool.
Method
We followed the protocol we created. We expressed three of them, the original part ( BBa_K1087003), the toehold switch with the trigger, and the toehold switch without the trigger in vitro environment, using the cell-free PURExpress protein synthesis kits and incubating them for six hours at 37°C.
Results
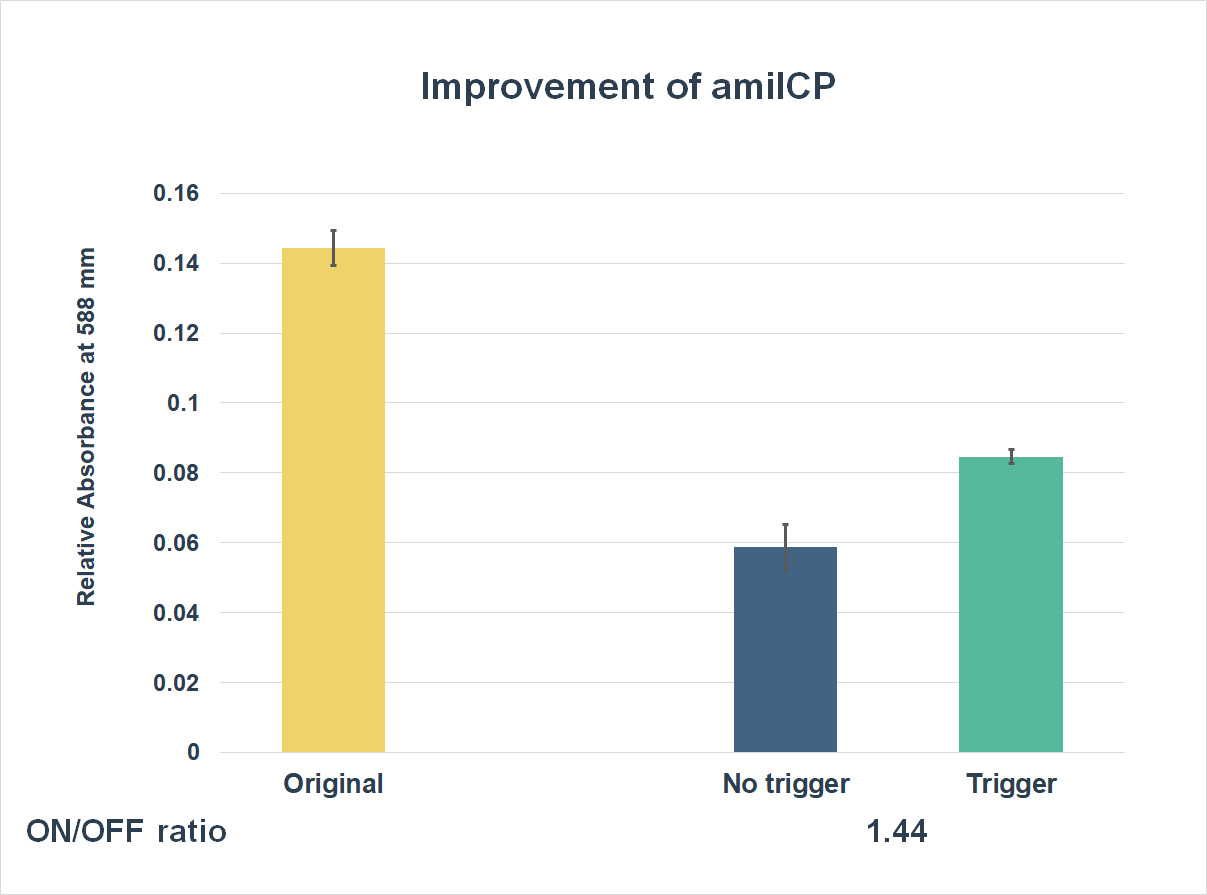
This is the graph that focuses at the sixth hour. It shows the results of our experiments with the existing part and the improved part. The vertical axis shows the relative absorbing wavelength at 588 mm. And the horizontal axis represents the name of the three. The yellow bar represents the original part, and the two bars on the right represent the improved part. The blue one refers to the condition without trigger, while the green one refers to the condition with the trigger.
The expression of our improved part is lower than the original ones. However, comparing the green one and the blue one, the green one expressed better. The on/ off ratio is 1.44, which was much higher than 1. Representing that there were significant differences between the ON state and the OFF state. The result proved that amilCP with toehold switches could only be triggered by a specific sequence, which also means the amilCP expression is lower in the absence of the trigger.
Conclusion
We successfully added the new function on amilCP. With our improvement, AmilCP's expression can be controlled, just like adding an on and off switch. AmilCP would not be expressed without a specific trigger. By doing so, it could turn out to be a useful diagnostic tool.
Reference Section
1. Alieva, N. O., Konzen, K. A., Field, S. F., Meleshkevitch, E. A., Hunt, M. E., Beltran-Ramirez, V., Miller, D. J., Wiedenmann, J., Salih, A., & Matz, M. V. (2008). Diversity and evolution of coral fluorescent proteins. PloS one, 3(7), e2680. https://doi.org/10.1371/journal.pone.0002680
2. Part: BBa_K1087003: https://parts.igem.org/Part:BBa_K1087003
3. Part:BBa_K592025: https://parts.igem.org/Part:BBa_K592025
4. Pardee, K., Green, A. A., Takahashi, M. K., Braff, D., Lambert, G., Lee, J. W., Ferrante, T., Ma, D., Donghia, N., Fan, M., Daringer, N. M., Bosch, I., Dudley, D. M., O'Connor, D. H., Gehrke, L., & Collins, J. J. (2016). Rapid, Low-Cost Detection of Zika Virus Using Programmable Biomolecular Components. Cell, 165(5), 1255–1266. https://doi.org/10.1016/j.cell.2016.04.059</p>
//collections/chromoprotein/uppsala
//function/reporter/pigment
| abs | 588 nm |
| color | Blue |