
 1 Registry Star
Part:BBa_R0062
Promoter (luxR & HSL regulated -- lux pR)
Promoter activated by LuxR in concert with HSL
The lux cassette of V. fischeri contains a left and a right promoter. The right promoter gives weak constitutive expression of downstream genes.This expression is up-regulated by the action of the LuxR activator protein complexed with the autoinducer, 3-oxo-hexanoyl-HSL. Two molecules of LuxR protein form a complex with two molecules of the signalling compound homoserine lactone (HSL). This complex binds to a palindromic site on the promoter, increasing the rate of transcription.
This Plux promoter "pointing to the right" is the same sequence, but inverted, as part BBa_K199052.
Usage and Biology
Pretty good off in the absence of LuxR/HSL. [jb, 5/24/04]
The team from Davidson College and Missouri Western State University discovered that this part promotes "backwards transcription" when LuxR protein is present and AHL-3OC6 is absent. You can read [http://www.ibc7.org/article/journal_v.php?sid=265 the paper that documents this unexpected "backwards promoter activity"] in their open access paper.
XJTLU-CHINA 2021's Characterization
pLuxR is a commonly used inducible promoter. However, almost all of the teams characterized the pLuxR basing on AHL concentration. In our project this year, depending our in vitro system, we measured the promoter strength changes at different concentration of LuxR. We had expressed and harvested LuxR by BL21(DE), which we used in the measurement by diluting LuxR to different concentrations and added into the cell-free system. Through real-time detection by microplate reader, we achieved the result and confirmed the transition concentration range.


As the Figure 1 and 2 show, the eGFP expression perform a trend of approximate limear growrth, whrn its gexpression rate stabilized. Meanwhile, there is a rapid rate transition as the LuxR concentration between 1μM to 10μM in reaction system.As the Figure 1 and 2 show, the eGFP expression performs a trend of approximate linear growth, when its expression rate stabilized. Meanwhile, there is a rapid rate transition as the LuxR concentration between 1μM to 10μM in reaction system.
Ecuador 2021's characterization
We characterized this promoter (actually we are talking about the GB compatible version of this promoter K2656003) using the composite part K3893028 that we built by assembling together
- BBa_K2656122: a Level 1 transcriptional unit expresing GFP under the control of the pux promoter (Golden Braid compatible)
- BBa_K2656114: a Level 1 transcriptional unit constitutively expressing luxR gene (Golden Braid compatible)
Device K3893028 allows us to measure GFP expression levels for different AHL induction concentrations.

Following a standard experimental procedure and the IGEM 2018 Interlab calibration for Particles and MEFL we obtained the temporal behavior of the device for different inducer concentrations.


We used this part to characterize the Golden Braid version (K2656003) of pLux promoter (R0062) made by [http://2018.igem.org/Team:Valencia_UPV Valencia_UPV 2018 Team]. Check our experimental page for more details, here you can get the raw data.
Using the same [http://2018.igem.org/Team:Valencia_UPV/Experiments#exp_protocol experimental protocol as Valencia_UPV team ], we have obtained the parameters for the following model:

| Table 1. Parameters obtained from part K3893028 corresponding to K2656003. | |||
| Parameter | Value | ||
| Effective translation rate 𝛼 | 𝛼 = 8.11e8 molec min-1 | ||
| Effective dissociation constant Kd | Kd = 15.34 nM | ||
| Hill coefficient | n = 0.958 | ||
| Basal expression | 𝛽 = 0.1049 | ||
| Dilution rate μ | μ = 0.0115 min-1 | ||
Using this optimized parameter we obtain the simulated hill function corresponding to the previous equation and compared it with the experimental data obtained (for steady-state, this is after reaching equilibrium).

Note: This characterization data for part R0062 (K2656003) needs to be interpreted in the context of the transcriptional units from where the experimental data was taken (K3893028, K2656122, K2656114).
Tsinghua-A 2017's characterization
Crosstalk between Plux and Nine AHL-Receptor Combinations
I Background
The crosstalk of Plux between 3 kinds of AHL molecules (3OC6HSL, 3OC12HSL and C4HSL) and 3 kinds of receptors (LuxR, LasR and RhlR) was characterized by ETH_Zurich 2014. However, they used AHL reagents to measure the dose-response of promoter activity, which may not be convenient in quorum sensing, because the concentration of AHL bacteria secrete may be out of the range they tested before. In other words, bacteria is unable to secrete so much AHL molecules to activate gene expression. Furthermore, the response time in the quorum sensing process is also important for designers to optimize their synthetic circuits with better precise and robustness. Therefore, we designed circuits to measure the crosstalk between receptors expressed in one kind of E.coli and AHL molecules secreted by another kind of E.coli and response time of these systems.
II Results
Crosstalk between Plux and Nine AHL-Receptor Combinations

Fig. 1: Results of our crosstalk experiment
3OC6HSL-LuxR is the wild-type pair of Plux. However, from this result, we can see that there are many other pairs can activate Plux. For example, 3OC6HSL-LasR, 3OC6HSL-RhlR, 3OC12HSL-LuxR, C4HSL-LuxR, C4HSL-LasR, C4HSL-Rhl can all activate it. What is more, the quorum sensing needs more than 30 hours to establish a steady state, which may be important for designing dynamic functions in bacteria with quorum sensing.
III Experiment Design and Measurement Methods
First, we cloned three AHL synthases: luxI (BBa_C0061), lasI (BBa_C0078) and rhlI (BBa_C0070), each ligated with promoter (BBa_J23100), RBS (BBa_B0034) and terminator (BBa_B0015) on a low copy backbone (pSB3K3). At the same time, we cloned three receptor-promoter combinations to pSB6A1. The three receptors are luxR (BBa_C0062), lasR (BBa_C0179) and rhlR (BBa_C0171) (with the same promoter, RBS and terminator as AHL synthases). Sensor promoter Plux (BBa_R0062) drives RFP (BBa_E1010) expression (with the same RBS and terminator as above) to detect the response of the promoters to AHL molecules via the receptors. Adding together, there are nine AHL-Receptor-Plux combinations. After that, we co-transformed the plasmids containing AHL synthases and plasmids containing receptor-Plux combinations. (Gene circuit of them is shown in Fig. 2)

Fig. 2 Gene circuit of 9 AHL-Receptor-Plux combinations
Finally, we detect how RFP intensity per cell change with time, which can be used to indicate the intensity of the promoter response to AHL molecule via corresponding receptor. Detailed measurement methods are as follows:
1. Transform MG1655ΔsdiAΔlacI with 9 kinds of combinations of plasmids mentioned above.
2. Pick bacterial clones from the petri plate, then shake it overnight in the LB medium (3ml) with 50 microgram/ml Ampicillin and 30 microgram/ml Kanamycin at 37℃. For each combination, 2 clones are picked.
3. Dilute the overnight culture to 1/50 in fresh LB medium (3ml) containing 50 microgram/ml Ampicillin and 30 microgram/ml Kanamycin.
4. Incubate the fresh cultures at 37℃ until OD600 reaches 0.2.
5. Add 1ml culture obtained from Procedure 4 to 2ml fresh LB medium containing 50 microgram /ml Ampicillin and 30 microgram/ml Kanamycin. Incubate the fresh cultures at 37℃.
6. Take out 200μl cultures obtained from Procedure 5 and measure the fluorescent intensity and OD600 after some time. (The cultures will not be put back again.) The excitation wavelength is 584nm, emission wavelength is 607nm.
IV Data file of results shown above
TUST 2017's characterization
design of ultrasensitive responses basis of https://parts.igem.org/Part:BBa_R0062 use Point mutation
Background information
Quorum-sensing bacteria such as Vibrio fischeri, are able to detected their own population density and implement density-based decision-making,Using the luxI/luxR quorum-sensing system, synthetic biologists have designed a large number of devices in prokaryotic microorganisms.Inevitably, high performance is required from such devices, and this includes reliability, sensitivity, Hence, to improve the properties of population-density switches, we design of ultrasensitive responses base https://parts.igem.org/Part:BBa_R0062 use Point mutation
Experiment Design

We selected the successful strains of the experiment and sequenced part1: https://parts.igem.org/Part:BBa_K2267029 part3: https://parts.igem.org/Part:BBa_K2267030 part4: https://parts.igem.org/Part:BBa_K2267031 part6: https://parts.igem.org/Part:BBa_K2267032 part8: https://parts.igem.org/Part:BBa_K2267033
Methods
The experiments for the characterization of parts were performed as described previously For density-response testing, cells (E. coli strain BW25113) from single colonies on LB agar (BD, USA) plates were grown overnight in 1 ml nutrition-rich, acid-base equilibrium medium (REM) (15.2 g/l yeast extract (BD, USA), 0.5% (NH4)2SO4, 4 mM MgSO4, 2% glucose and 24 g/l K2HPO4.3H2O, and 9.6 g/l KH2PO4) in Falcon tubes overnight (8−12 h, 1000 rpm, 37 °C, mB100-40 Thermo Shaker, AOSHENG, China). The cultures were subsequently diluted 500-fold with REM in 96-well plates, which were further incubated at 37°C in a shaker at 1000 rpm. Once the diluted cultures reached an OD600 of 0.12–0.14 (~3 h), 10 μL aliquots were transferred into 1 mL REM in 24-well plates (Corning/Costar 3524). These plates were incubated at 37°C in a Varioskan Flash (Thermo Scientific, USA) under constant shaking at 1,000 rpm for 20 h to maintain exponential growth, during which the OD600 and fluorescence values were recorded
Tsinghua 2018's characterization
Lux pR Mutants in Different Gene Expression Strength, Leakage and Expression Perimeters
I Background
With the hope to find an optimal promotor for our NEON system, we designed 9 mutations on sites -35, -36, -37 near the luxR binding site and tested another on -10 site that TUST 2017 reported to show decreased leakage. We conducted experiments to evaluate these lux pR mutants’ reaction to AHL stimulation and their leakage level. The test devices we designed include a constantly expressed luxR and a lux pR (or mutant) driven sfGFP (like BBa_K2558211 with original lux pR promotor, and BBa_K2558212 with lux pR-HS promotor).
II Results
We conducted the experiment first with 9 mutations on sites -35, -36, -37 near the luxR binding and another on -10 site that TUST 2017 reported to show decreased leakage. We transferred the plasmids with lux pR driven sfGFP into E. coli DH5α. In theory, AHL can induce gene expression by activating lux pR promotor. We measured the value of Fluorescence/OD without AHL stimulation by microplate reader to show the leakages of different lux pR mutants, as lux pR promotor is not supposed to be activated without AHL. Meanwhile, we also regard the value of Fluorescence/OD with 10^-10 M AHL stimulation to observe the sensitivity and expression intensity of different lux pR mutants. Experiment data is shown in the figures below. (Figure.1)
-
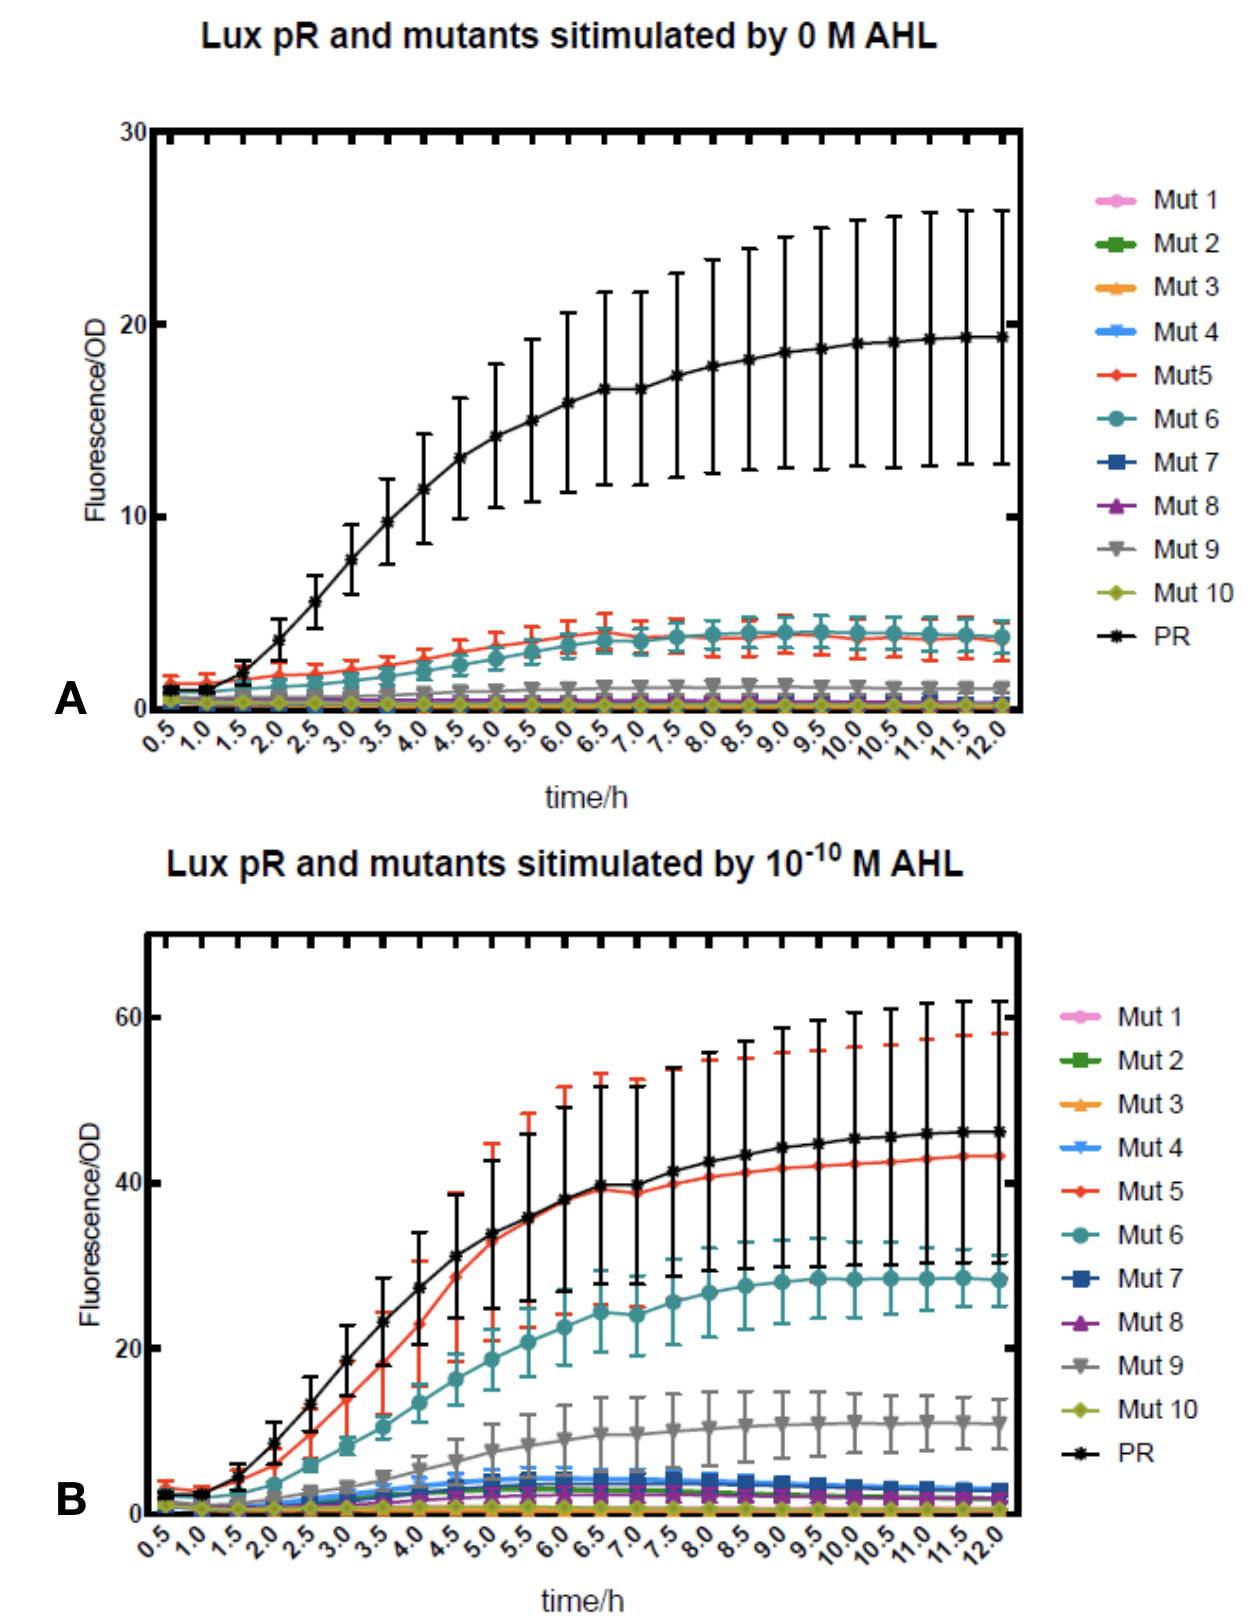 Figure.1. Leakage and 10^-10 mM AHL stimulation of lux pR promotor and its mutations. The fluorescence strengths and OD values are measured by microplate reader respectively at 510 nm and 600 nm wavelength. Plasmids with lux pR promotor and its mutants are transferred into E.coli DH5α. A The bacteria were treated without AHL inducing. High (Fluorescence/OD) ratio indicates strong leakage of promotor. Among all the strains, lux pR promotor has the strongest leakage and the largest error bar as well. B The bacteria were treated with 10-10 mM AHL induction. High (Fluorescence/OD) ratio indicates high expression intensity. Mutation 5 has almost the same expression intensity as the wild type lux pR promotor.
 -
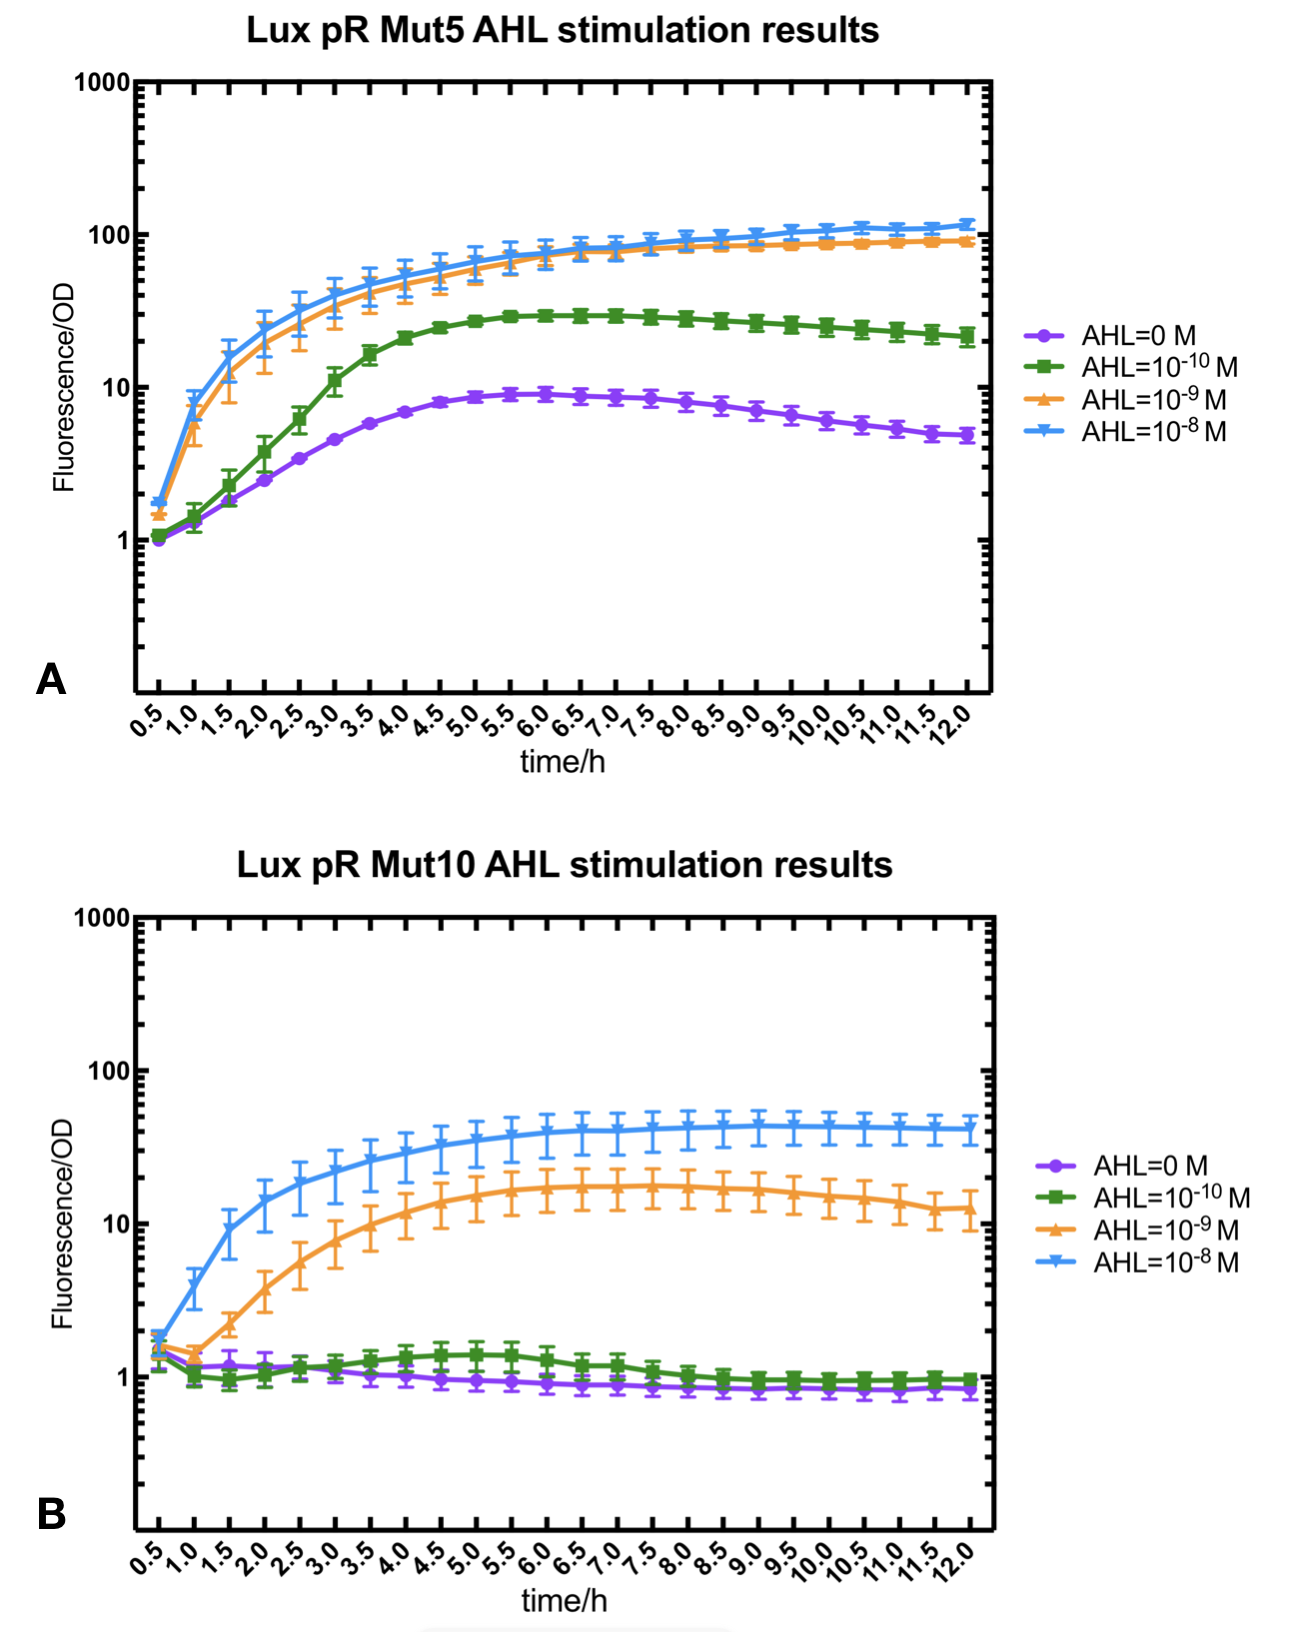 Figure.2. Leakage and AHL stimulation of of lux pR Mutant 5 and Mutant 10. The fluorescence strengths and OD values are measured by microplate reader respectively at 510 nm and 600 nm wavelength. A Plasmid with lux pR Mutant 5 is transferred into E.coli DH5α. The bacteria were treated without or with 10^-10 mM, 10^-9 mM and 10^-8 mM AHL inducing. B Plasmid with lux pR Mutant 10 is transferred into E.coli DH5α. The bacteria were treated without or with 10^-10 mM, 10^-9 mM and 10^-8 mM AHL inducing.
 -
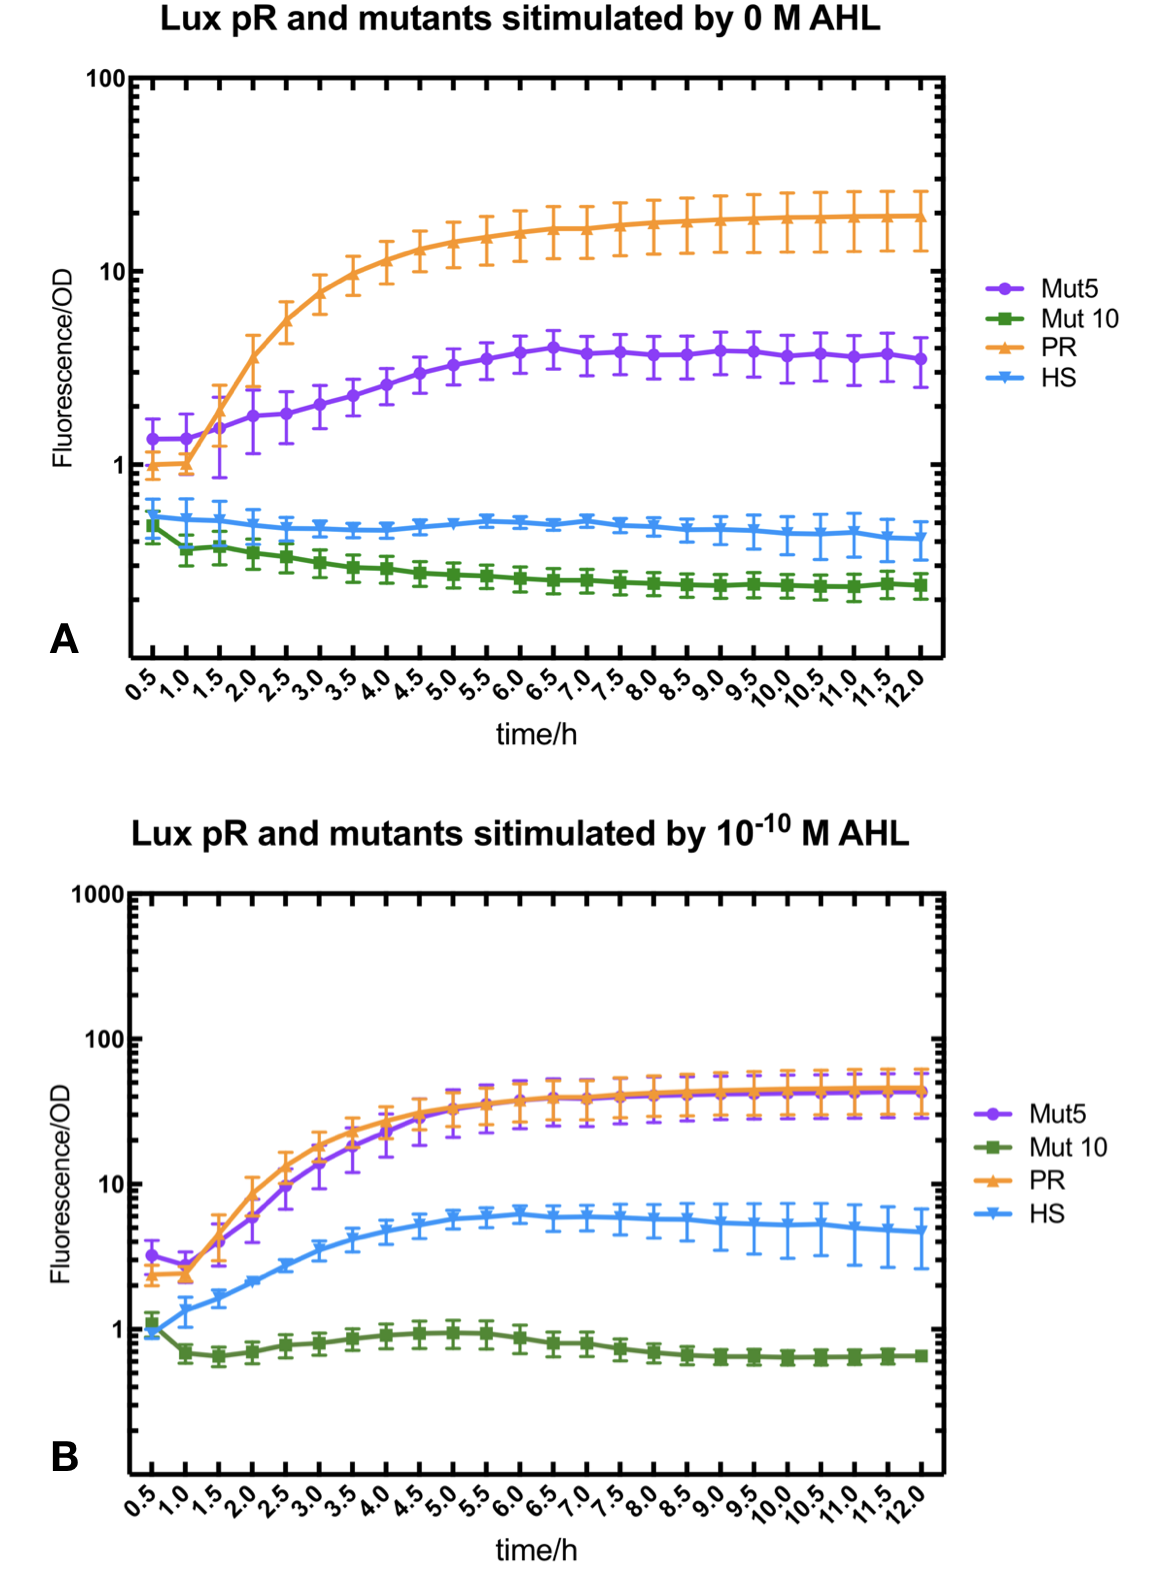 Figure.3. Leakage and 10^-10 mM AHL stimulation of of lux pR promotor WT, Mutant 5, Mutant 10 and HS. The fluorescence strengths and OD values are measured by microplate reader respectively at 510 nm and 600 nm wavelength. Plasmids with lux pR promotor WT, Mutant 5 and Mutant 10 are transferred into E.coli DH5α. A The bacteria were treated without AHL inducing. High (Fluorescence/OD) ratio indicates strong leakage of promotor. B The bacteria were treated with 10^-10 mM AHL induction. High (Fluorescence/OD) ratio indicates high expression intensity.
We repeated AHL stimulation test on Mutant 5 and Mutant 10 (Figure.2) and decided to combine the two mutations together to form a new promotor with high intensity and small leakage. We named it lux pR-HS. We tested lux pR-HS under the same conditions. We can see that the lux pR-HS has similar leakage to Mutant 10, while it has much higher expression intensity. (Figure.3) The statistics of relative induction and leakage intensity of the 10 Mutants and lux pR-HS are shown in Table.1
-
As for why some mutations on -35 to -37 sites would decrease the leakage of lux pR without severely influencing the expression level, we have some hypotheses and explanations. It is reported that -35 to -37 sites are last three bases of lux box which is upstream of the lux promotor and bound specifically by luxR, one of regulatory protein involved in lux expression system.[1] G-36T mutation has less influence than other mutation on sites -35 to -37, which is same to our result. Besides, G-36T is not involved in the two regions of nucleotides -52 to -50 and -39 to -37 which directly contacted with luxR protein. Therefore, this single substitution of nucleotide would decrease the leakage of lux promotor without influencing the expression level too much.[2]
III Protocol
- one Transform the plasmids into E. coli DH5α.
- two Pick a single colony by a sterile tip from each of the LB plates for all the experimental and control groups. Add the colony into 5ml LB medium with ampicillin at 100 ng/µl. Incubate for 6-8 h at 37℃ in a shaker.
- three Measure OD600 of the culture medium with photometer. Dilute the culture medium until OD600 reaches 0.6.
- four Add 100 µl bacteria culture medium into a sterile 96-well plate. Add AHL to final concentrations of 0, 10^-10,10^-9,10^-8 M. Fresh LB medium serves as blank control. Positive control is colony constantly expressing sfGFP and negative control is colony without sfGFP expression. Place the 96-well plate into an automatic microplate reader. Incubate at 16℃ overnight and measure the fluorometric value at 510 nm and OD600 of each well every 30 minutes.
- five Each group should be repeated for at least 3 times.
IV Reference
[1] Antunes, L. C., et al. "A mutational analysis defines Vibrio fischeri LuxR binding sites." Journal of Bacteriology 190.13(2008):4392-4397.
[2] Zeng, Weiqian, et al. "Rational design of an ultrasensitive quorum-sensing switch." Acs Synthetic Biology 6.8(2017).
Contribution
Group: Valencia_UPV iGEM 2018
Author: Adrián Requena Gutiérrez, Carolina Ropero
Summary: We adapted the part to be able to assemble transcriptional units with the Golden Gate assembly method
Documentation: In order to create our complete [http://2018.igem.org/Team:Valencia_UPV/Part_Collection part collection] of parts compatible with the Golden Gate assembly method, we made the part BBa_K2656003 which is this part adapted to the Golden Gate technology.Results
Sequence and Features
Assembly Compatibility:- 10COMPATIBLE WITH RFC[10]
- 12COMPATIBLE WITH RFC[12]
- 21COMPATIBLE WITH RFC[21]
- 23COMPATIBLE WITH RFC[23]
- 25COMPATIBLE WITH RFC[25]
- 1000COMPATIBLE WITH RFC[1000]
>Internal Priming Screening Characterization of BBa_R0062: Has no possible internal priming sites between this BioBrick part and the VF2 or the VR primer.
The 2018 Hawaii iGEM team evaluated the 40 most frequently used BioBricks and ran them through an internal priming screening process that we developed using the BLAST program tool. Out of the 40 BioBricks we evaluated, 10 of them showed possible internal priming of either the VF2 or VR primers and sometime even both. The data set has a range of sequence lengths from as small as 12 bases to as large as 1,210 bases. We experienced the issue of possible internal priming during the sequence verification process of our own BBa_K2574001 BioBrick and in the cloning process to express the part as a fusion protein. BBa_K2574001 is a composite part containing a VLP forming Gag protein sequence attached to a frequently used RFP part (BBa_E1010). We conducted a PCR amplification of the Gag-RFP insert using the VF2 and VR primers on the ligation product (pSB1C3 ligated to the Gag + RFP). This amplicon would serve as template for another PCR where we would add the NcoI and BamHI restriction enzyme sites through new primers for ligation into pET14b and subsequent induced expression. Despite gel confirming a rather large, approximately 2.1 kb insert band, our sequencing results with the VR primer and BamHI RFP reverse primer gave mixed results. Both should have displayed the end of the RFP, but the VR primer revealed the end of the Gag. Analysis of the VR primer on the Gag-RFP sequence revealed several sites where the VR primer could have annealed with ~9 - 12 bp of complementarity. Internal priming of forward and reverse primers can be detrimental to an iGEM project because you can never be sure if the desired construct was correctly inserted into the BioBrick plasmid without a successful sequence verification.
无标题文档 HZAU-China 2019's Improvement
The improved part can be found here:https://parts.igem.org/Part:BBa_K3205005
I Background
luxPR promoter is the key element to quorum-sensing circuits, for it mediates the final effects of quorum-sensing, producing proteins of interest. luxPR promoter is a σ-70 dependent promoter with an upstream regulatory element at -42.5, named lux box. LuxR, playing as an activator, will bind to lux box and interact with CTD and NTD of the α subunit of RNA polymerase, resulting in the activation of the promoter.[1] So far, lots of teams have made effort on improving luxPR promoter, but they’ve all focused on mutating the -10 region and the -35 region. σ-70 factors will bind to the -10 and -35 region tightly and then form holo-RNA polymerases (holo-RNAP) with core RNA polymerases to initiate transcription. This method usually results in the change of its maximum intensity but little effect to its dynamic characteristics. Taking these into consideration, we decided to mutate its lux box to change its dynamic characteristics. Since lux box is the binding site of the activator protein LuxR, the mutation to lux box will vary its binding features with LuxR, thus affecting its activation characteristics. Our efforts on this hypothetical were proved, since we successfully gained a mutated luxPR with low leakage, high activation threshold without decreasing its maximum intensity.
II Results
We made nine mutants according to the theory provided by papers at first [2-4]. And then we selected a mutant from the nine mutants which met our expectation well, and named this mutant as luxPR-4G12T. The fourth and the twelfth bases of the original luxPR were mutated to G and T simultaneously.
We constructed two plasmids. One expressed sfGFP under the control of luxPR-4G12Tand the other expressed sfGFP under the control of original luxPR. Then we respectively transformed them into E. coli DH5α. In theory, AHL could induce gene expression by activating luxPR promotor. We added different concentrations of AHL into the bacteria, and measured the fluorescence value and OD600 every 30 minutes. The standard fluorescence intensity was obtained by dividing the fluorescence intensity by OD600. The standard fluorescence by AHL of different concentrations after 8 hours of incubation was plotted (Figure 1).

Figure 1. The standard fluorescence by AHL of different concentrations after 8 hours of incubation. Fluorescence intensity and OD values were measured by microplate reader respectively at 528 nm and 600 nm wavelength.
It was observed that the expression intensity of sfGFP of the mutant was low at a low concentration of AHL, and the intensity remained stable. But the wild type had a certain degree of leakage without AHL. And we discovered that when the concentration of AHL reached 10-1nmol/L, the fluorescence intensity of wild type had increased, but the mutant didn’t change much. When the concentration went up to 102nmol/L, the fluorescence intensity of the mutant and the wild type became similar. In contrast, the mutant had a very low leakage, high threshold, and unchanged intensity.
Then we used different concentrations of AHL to induce the mutant and the wild type respectively. The diagrams of fluorescence intensity over time are shown below (Figure 2-4).

Figure 2. The diagram of the fluorescence intensity over time with 100 nmol/L AHL stimulation.
From this graph we could see that at the low concentration of AHL (100nmol/L),the mutant’s expression of sfGFP was very low and stable, but the fluorescence intensity of wild type was increasing significantly over time.

Figure 3. The diagram of the fluorescence intensity over time with 101 nmol/L AHL stimulation.
When we increased the concentration of AHL to 101nmol/L, we could conclude that the mutant began to express sfGFP according to the increasing fluorescence intensity on this graph.

Figure 4. The diagram of the fluorescence intensity over time with 102 nmol/L AHL stimulation.
When the concentration of AHL increased to 102nmol/L, the fluorescence intensity of the mutant and the wild type changed over time similarly.
III Discussion
According to the analysis above, we could clearly find that when we didn’t add any inducer or just added a low concentration of inducer, the mutant expressed sfGFP very low. Compared with the wild type the mutant had the advantage of low leakage. When the wild-type promoter began to express sfGFP significantly, the expression intensity of sfGFP of the mutant remained low and nearly unchanged, which showed that the threshold of the mutant was higher than the wild type. As the concentration of the inducer increased to 102nmol/L, the fluorescence intensity of the wild type and the mutant were the same over time, which showed their similar intensity of the transcription initiation.
From what has been discussed above, the mutant had the advantages of very low leakage, high threshold, and unchanged maximum intensity. Compared to the wild type, the mutant was more suitable for our project. The biggest problem of our project was that the memory module would start itself due to the leakage of the promoter. Since the leakage of the mutant was very low and the threshold to activate this promoter was high, the mutant needed more time and a higher concentration of inducer to active the memory module than the wild type.
To sum up, the mutant not only met the requirements of our project, but also had a very wide range of application.
IV Protocol
1.Molecular cloning are conducted as the illustration in the Molecular Cloning section. https://2019.igem.org/Team:HZAU-China/Protocol
2.Transform two different plasmids with low copy ampicillin resistance into E. coli DH5α, which are named luxPR-4G12T and luxPR respectively. Two base pairs are mutated in luxPR-4G12T. And luxPR is the plasmid with the original part BBa_R0062. Then spread them onto two LB plates with ampicillin, respectively.
3.Pick four isolated colonies with a sterile tip from each of the two LB plates and add each tip into 5ml LB medium with ampicillin (20μg/mL). Incubate for 6-8 h at 37℃ in a shaker with 200rpm.
4.Add each kind of bacterial fluid into different lines of a sterile, black-coated 96-well plate. Add shaken bacterial solution and fresh medium with ampicillin to a total of 100μL, and make sure the OD600 of each well is close to 0.1, measured by the plate reader.
5.Add 1μL AHL diluted in DMSO into each well. The final concentration range of AHL is from 10-2 to 106 nmol/L. Add 1μL DMSO without AHL served as positive controls. Blank controls are fresh LB medium, Place the 96-well plate into the automatic microplate reader (Synergy H1 hybrid multi-mode reader). Incubate at 37℃ overnight and measure the fluorescence value(excitation: 485nm, emission: 528nm)and OD600 of each well every 30 minutes.
6.Data taken from the plate reader are exported to Excel and imported to Prism for analysis.
7.All experiments above are carried out in 3 biological replications.
V Reference
[1]Egland K A, Greenberg E P. Quorum sensing in Vibrio fischeri: elements of the luxI promoter[J]. Molecular microbiology, 1999, 31(4): 1197-1204.
[2]Bao S H, Li W Y, Liu C J, et al. Quorumsensing based small RNA regulation for dynamic and tuneable gene expression[J]. Biotechnology letters, 2019, 41(10): 1147-1154.
[3]Grant P K, Dalchau N, Brown J R, et al. Orthogonal intercellular signaling for programmed spatial behavior[J]. Molecular systems biology, 2016, 12(1).
[4]Zeng W, Du P, Lou Q, et al. Rational design of an ultrasensitive quorum-sensing switch[J]. ACS synthetic biology, 2017, 6(8): 1445-1452.
Characterization by 2019 iBowu-China
We character the sensitivity of pLux sensing a N-(3-oxohexanoyl)-L-homoserine lactone (OHHL,quorum sensing signal molecular of E.carotovora) in vivo and vitro system.
Results
1.The report system we used
The following gene circuit is designed to test the sensitivity of pLux sensing OHHL. It consists of LuxR(quorum sensing transcriptional factor, BBa_C0062) drove by a constitutive promoter J23101 and GFP (BBa_I746916) as a reporter drove by the pLux(fig1).

Figure 1. gene circuits of reporter
2.Results in vivo

Figure 2.The fluorescence intensity over the time with different concentration of OHHL treatment. The inducer OHHL was added to the culture after 60 min incubation.
From figure2, we found that the GFP intensity increased after OHHL incubation, even 1nM OHHL, which means that LuxR - pLux could be a highly sensitive detector of OHHL.
3.Results in vitro(cell-free system).
After the cellular sensing characterization, we test the binding efficiency of LuxR to OHHL in cell-free systems(Fig. 3). After the overnight cell-free incubation, it showed that the circuit of LuxR-GFP was responsible to AHL with the detection limit of 1 nM.

Figure 3. The cell-free fluorescence output induced by a series of AHL concentrations. FLU was measured after overnight incubation
Fudan 2019’s characterization and improvement
Background
Several teams have characterized luxpR before. Many of them characterized it basing on culture time or AHL concentration. In our project, we hope that this promoter will trigger the regulation of the downstream circuit. Since we use the production of its upstream regulating genes luxI and luxR as its signal in our final circuit, our measurement continued this design and measure the curve basing on OD value. Data collected in unit of the concentration of bacteria will directly reflect if the system works properly.
Experiment design and measurement
To test this part’s function, we transferred DH10B bacteria with plasmids carrying the promoter with another LuxI-LuxR ( BBa_K3245002 ) plasmid at the same time. LuxI-LuxR is a upstream regulation box which produces signal that can activate luxpR in QS system. And we added GFP after luxpR as the reporter of its expression level. By measuring fluorescence/OD600, the expressing level of luxpR can be known and the data are comparable with our other works.
Result


Fig.1 This figure shows luxpR expression level induced by luxR-luxI box. The MEFL/particle changes as the OD goes up after dilution. Data points are shown in the figure for fitting analysis. Here gives the parameters of the fitting equation.
At first the parental fluorescence and dilution effect keep fluorescence/OD600 at an extremely high level. Then the concentration of signal molecules remains low in the fresh culture while the bacteria are reproducing. In the next few hours the fluorescence/OD600 keeps going down. After the newly cultured bacteria grow to a higher concentration, luxpR-HS is activated and fluorescence/OD600 rises again as Fig.1 shows. Expression properties of luxpR-HS is predictable according to the fitting analysis results.
Improvement
We substituted the -35 to -10 region of the original promoters, luxpR and luxpR-HS with the one from constitutive promoter family members (BBa_J23100-), according to the knowledge of lux box[1] and the method of constructing hybrid promoters[2]. Finally we picked luxpR-fus100 and luxpR-HS100 and deployed them in our circuit.
Design

Fig.2 Hybrid promoter diagram. As the figure shows, we substituted the -35 to -10 region of the original promoter luxpR with the one of J23100, a strong constitutive promoter. This region is rarely concerned as it’s rather conservative in promoters with the same function, but it has crucial structural effect on σ factor binding and other events in transcription regulation. Fortunately the change proved to be effective on adjusting the behavior of the regulatory promoter.
Result

Fig. 3 Microplate reader data of quorum sensing promoters ( time as X-axis ). It shows the overall status of the promoters.

Fig. 4 Microplate reader data of quorum sensing promoters ( OD600 as X-axis ). The downward curve before OD600 <0.1 is due to the parental fluorescence and the dilution effect after proliferation. It is shown that luxpR-fus100 has a higher expression level and luxpR-HS100 has low leakage at the cost of a lower expression level.
Protocol
We cultured the bacteria mentioned above overnight. As it reached a high concentration, luxpR became activated. Then we diluted the culture to 1/5000 and measured its fluorescence and OD600 every 30 minutes.
1. Inoculate the selected single colony with part above and 5 kinds of luxpR promoters into 3 ml LB medium with 50 mg/ml kanamycin and 100 mg/ml ampicillin at 37℃.
2. Dilute the overnight culture to 1/5000 in 15ml fresh LB medium with 50 mg/ml kanamycin and 100mg/ml ampicillin. Each group with two parallel copies.
3. Incubate all culture above at 37℃.
4. Pipette 200 μl each as sample every 30 minutes and measure their fluorescence and OD600.
Reference
[1] Antunes, L. C., et al. "A mutational analysis defines Vibrio fischeri LuxR binding sites." Journal of Bacteriology 190.13(2008):4392-4397.
[2] de Boer HA, Comstock LJ, Vasser M. The tac promoter: a functional hybrid derived from the trp and lac promoters. Proc Natl Acad Sci U S A. 1983;80(1):21–25. doi:10.1073/pnas.80.1.21
Functional Parameters: Austin_UTexas
BBa_R0062 parameters Burden Imposed by this Part: 
Burden Value: 0.1 ± 6.0% Burden is the percent reduction in the growth rate of E. coli cells transformed with a plasmid containing this BioBrick (± values are 95% confidence limits). This BioBrick did not exhibit a burden that was significantly greater than zero (i.e., it appears to have little to no impact on growth). Therefore, users can depend on this part to remain stable for many bacterial cell divisions and in large culture volumes. Refer to any one of the BBa_K3174002 - BBa_K3174007 pages for more information on the methods, an explanation of the sources of burden, and other conclusions from a large-scale measurement project conducted by the 2019 Austin_UTexas team.
This functional parameter was added by the 2020 Austin_UTexas team.
OUC-China 2020’s characterization
Design
It is very important for us to select the inducible promoter with low transcriptional leakage and high dynamic range. These promoters are essential parts of building the logic gates. These promoters also played a crucial role in the subsequent construction of multiple-input logic gates and swapping gates.
Result
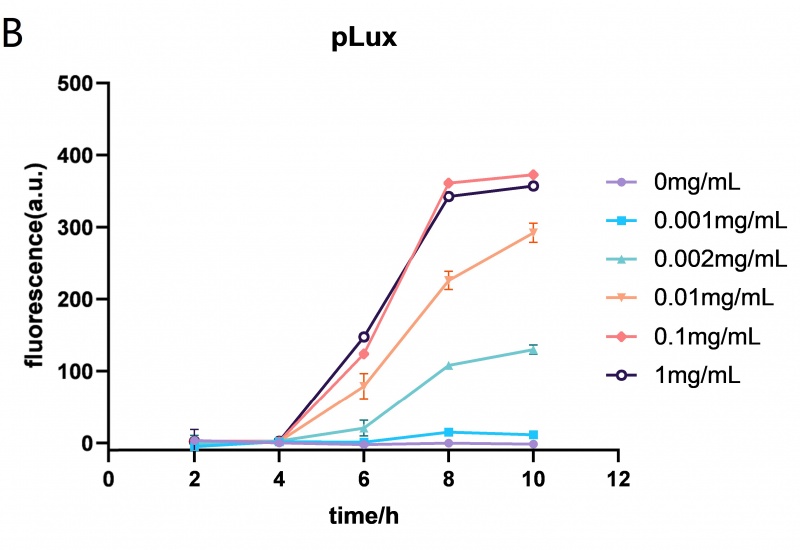
The Lux promoter fluorescence data in E. coli BL21 (DE3) at different HSL (N-(Ketocaproyl)-L-homoserine Lactone) concentrations (0mg/mL, 0.001mg/mL, 0.002mg/mL, 0.01mg/mL, 0.1mg/mL and 1mg/mL). The Lux promoter showed the highest fluorescence intensity when the HSL concentration was 0.01mg/mL. Error bar: SD (n=9).
ShanghaiTech_China 2022's Characterization
Design
LuxR(BBa_C0062) receives the signal of AHL, which is sent by LuxI(BBa_C0161), 3OC6 HSL here. It can then regulate the downstream Lux pR to make superfolder GFP (BBa_K4115000) express.(Figure 1)
Results
We use different concentrations of the autoinducer, ranging from 10-4 to 10-14 M, to test the response intensity of LuxR.The result is shown by dividing the fluorescence intensity by the OD600, both measured in the transformed E. coil. (Figure 2).
We also induced the expression of LuxR in sodium alginate gel beads and detected the expression of sfGFP under UV light. (Figure 3)
More detailed information can be seen on the composite page BBa_K4115039 , which is submitted by ShanghaiTech_China 2022.
Previous study’s characterization (by IGEM23_WHU-China)
In a previous study, the promoter is coupled with the GFP reporter. The GFP production rate per cell over time and the Time-averaged GFP production rate per cell at different 3OC12HSL inducer concentrations are measured.

Figure 1:Characterization results of sensing device coupled with GFP reporter. (Saeidi, N., et al.2011)
(A) GFP production rate per cell over time at different 3OC12HSL inducer concentrations. (B) Time-averaged GFP production rate per cell at different input 3OC12HSL concentrationsReference
- Saeidi, N., et al., Engineering microbes to sense and eradicate Pseudomonas aeruginosa, a human pathogen. Molecular Systems Biology, 2011. 7(1).

It is observed that high expression intensity is accompanied by high level of leakage in lux pR promotors. Wild type lux pR represented with black strand in the figures has the highest level of both leakage and intensity. The next three are Mutant 5 (G-36T), Mutant 6 (G-36C), Mutant 9 (T-35G). Mutant 5 has almost the same intensity as wild type, but the leakage is significantly smaller. Mutant 6 and Mutant 9 have a little bit less leakage and medium intensity. We also did the experiment with 10^-9 M and 10^-8 M AHL, all of the promotors show high expression levels and therefore unable to compare. (Data not shown)


//direction/forward
//function/cellsignalling/LuxR
//promoter
//regulation/positive
//rnap/prokaryote/ecoli/sigma70
| control | luxR, HSL |
| direction | Forward |
| negative_regulators | |
| o_h | |
| o_l | |
| positive_regulators | 1 |