
Part:BBa_K592011
cjBlue, green chromoprotein
This chromoprotein from the Cnidopus japonicus sea anemone, cjBlue, naturally exhibits dark green color when expressed. Compared to some other chromoproteins, such as amilCP (BBa_K592009), amilGFP (BBa_K592010), spisPink (BBa_K1033932), asPink (BBa_K1033933) and aeBlue (BBa_K864401), the color development is slower. The color is readily observed in both LB or on agar plates after 24-48 hours of incubation. The sequence is codon optimized for expression in E coli.
Usage and Biology
This part is useful as a reporter.

iGEM11_Uppsala-Sweden: Expression of green chromoprotein. Escherichia coli constitutively expressing cjBlue (BBa_K592011).

iGEM12_Uppsala_University: The Uppsala chromoprotein collection and RFP. The image shows pellets of E coli expressing chromoproteins eforRed BBa_K592012, RFP BBa_E1010, cjBlue BBa_K592011, aeBlue BBa_K864401, amilGFP BBa_K592010 and amilCP BBa_K592009.

iGEM17_SJTU_BioX_Shanghai:
J23119+Target3+cjBlue BBa_K2285014
J23119+Target1+cjBlue BBa_K2285018
An improved part has been constructed. Since this part is a coding sequence, we added a RBS which is on the upstream of sfGFP BBa_K515005 and terminator BBa_B1006 by PCR. What's more, our device have a stem-loop structure(called Target) following the constitutive promoter J23119, to achieve further control of cjBlue expression.
References
[http://www.jbc.org/content/281/49/37813.abstract] Chan MC, Karasawa S, Mizuno H, Bosanac I, Ho D, Privé GG, Miyawaki A, Ikura M. (2006) Structural characterization of a blue chromoprotein and its yellow mutant from the sea anemone Cnidopus japonicus. J. Biol. Chem. 281(49). 37813-9
Sequence and Features
- 10COMPATIBLE WITH RFC[10]
- 12COMPATIBLE WITH RFC[12]
- 21COMPATIBLE WITH RFC[21]
- 23COMPATIBLE WITH RFC[23]
- 25COMPATIBLE WITH RFC[25]
- 1000COMPATIBLE WITH RFC[1000]
Structure and SWISS MODEL Homology Report
(The following information has been contributed by SVCE_Chennai 2016)
The following sections give a detailed information on this chromoprotein done by its in silico analysis.
3D Structure

Cartoon representation of cjBlue chromoprotein.

The best match during structure prediction.
| Template | Seq. Identity | Oligo-state | Found by | Method | Resolution | Seq Similarity | Range | Coverage | Description |
|---|---|---|---|---|---|---|---|---|---|
| 2ib5.1.A | 99.57 | homo-octamer | BLAST | X-Ray | 1.80Å | 0.63 | 5 - 232 | 0.99 | Chromo protein |
Ligands -None
Plot 1

Plot 2

Plot 3


Plot 1
The area built by the circles colored in different shades of grey in the plot on the left hand side represent the QMEAN scores of the reference structures from the PDB. The model's QMEAN score is compared to the scores obtain for experimental structures of similar size (model size +/- 10%) and a Z-score is calculated. A Z-score (or standard score) is a score which is normalised to mean 0 and standard deviation 1. Thus the QMEAN Z-score directly indicates how many standard deviations the model's QMEAN score differs from expected values for experimental structures. In analogy, Z-scores are calculated for all four statistical potential terms as well as the agreement terms being part of the QMEAN score.
Plot 2
The plot in the middle shows the density plot (based on the QMEAN score) of all reference models used in the Z-score calculation. The location of the query model with respect to the background distribution is marked in red. This plot basically is a "projection" of the first plot for the given protein size. The number of reference models used in the calculation is shown at the bottom of the plot.
Plot 3
The analysis of these Z-scores of the individual terms can help identifying the geometrical features responsible for an observed large negative QMEAN Z-score. Models of low quality are expected to have strongly negative Z-scores for QMEAN but also for most of the contributing terms. Large negative values correspond to red regions in the color gradient. "Good structures" are expected to have all sliders in the light red to blue region.”
The QMEAN6 score is a composite score consisting of a linear combination of 6 terms (estimated model reliability between 0-1). The pseudo-energies of the contributing terms are given below together with their Z-scores with respect to scores obtained for high-resolution experimental structures of similar size solved by X-ray crystallography:
| Scoring Function Term | Raw Score | Z Score |
|---|---|---|
| Cβ Interaction Energy | -91.57 | -1.48 |
| All Atom Pairwise Energy | -42903.03 | -0.85 |
| Solvation Energy | -145.58 | -0.51 |
| Torsion Angle Energy | -501.77 | 0.18 |
| Secondary Structure Agreement | 88.2% | 1.18 |
| Solvent Accessibility Agreement | 76.0% | -0.69 |
| QMEAN6 score | 0.712 | -0.41 |
Ramachandran Plot- SWISS MODEL Workspace
(The following information has been contributed by SVCE_Chennai 2016)
A score of 94% in the most favoured regions as seen in the Ramachandran plot shows that the above predicted model of cjBlue, green chromoprotein is a very good prediction.
ProtParam Results
(The following information has been contributed by SVCE_Chennai 2016)
Number of amino acids: 232
Molecular weight: 26173.80
Theoretical pI: 7.53
Total number of negatively charged residues (Asp + Glu): 24
Total number of positively charged residues (Arg + Lys): 25
Atomic composition:
Carbon (C) - 1151 Hydrogen (H) - 1776 Nitrogen (N) - 314 Oxygen (O) - 347 Sulfur (S) - 19
Formula: C1151H1776N314O347S19
Total number of atoms: 3607
Extinction coefficients:
Extinction coefficients are in units of M-1 cm-1, at 280 nm measured in water.
Ext. coefficient : 28015
Abs 0.1% (=1 g/l): 1.070, assuming all pairs of Cys residues form cystines
Ext. coefficient : 27390
Abs 0.1% (=1 g/l): 1.046, assuming all Cys residues are reduced
Estimated half-life:
The N-terminal of the sequence considered is M (Met).
The estimated half-life is: 30 hours (mammalian reticulocytes, in vitro).
>20 hours (yeast, in vivo).
>10 hours (Escherichia coli, in vivo).
Instability index:
The instability index (II) is computed to be 29.86.
This classifies the protein as stable.
Aliphatic index: 58.84
Grand average of hydropathicity (GRAVY): -0.558
ExPASy Peptide Cutter Results
(The following information has been contributed by SVCE_Chennai iGEM-2016)
The following enzymes cleave the chromoprotein.
| Name of enzyme | No. of cleavages | Positions of cleavage sites |
|---|---|---|
| Arg-C proteinase | 8 | 10 92 147 150 175 179 198 220 |
| Asp-N endopeptidase | 8 | 6 55 77 97 110 150 165 195 |
| Asp-N endopeptidase + N-terminal Glu | 24 | 6 15 26 28 30 35 40 55 77 85 90 96 97 106 110 140 144 150 165 195 199 205 211 214 |
| BNPS-Skatole | 2 | 90 140 |
| CNBr | 8 | 1 15 25 40 133 146 160 189 |
| Chymotrypsin-high specificity (C-term to [FYW], not before P) | 21 | 14 24 35 53 55 64 72 79 80 88 90 96 101 117 140 148 178 192 194 211 221 |
| Chymotrypsin-low specificity (C-term to [FYWML], not before P) | 50 | 1 13 14 15 22 23 24 25 35 40 53 55 58 64 72 79 80 88 90 96 101 102 110 115 117 122 133 140 146 148 154 159 160 162 169 170 173 174 178 187 192 193 194 197 210 211 214 221 229 231 |
| Clostripain | 8 | 10 92 147 150 175 179 198 220 |
| Formic acid | 8 | 7 56 78 98 111 151 166 196 |
| Glutamyl endopeptidase | 16 | 16 27 29 31 36 41 86 91 97 107 141 145 200 206 212 215 |
| Hydroxylamine | 2 | 129 207 |
| Iodosobenzoic acid | 2 | 90 140 |
| LysC | 17 | 4 12 33 44 47 71 81 109 120 135 136 163 181 182 185 203 228 |
| LysN | 17 | 3 11 32 43 46 70 80 108 119 134 135 162 180 181 184 202 227 |
| NTCB (2-nitro-5-thiocyanobenzoic acid) | 11 | 25 61 113 123 142 143 154 163 171 221 224 |
| Pepsin (pH1.3) | 36 | 13 23 52 54 55 57 79 80 84 87 88 101 102 109 110 114 115 121 153 154 158 159 161 162 169 170 173 174 186 193 194 209 210 211 228 229 |
| Pepsin (pH>2) | 52 | 13 23 34 52 54 55 57 63 64 71 72 79 80 84 87 88 89 90 95 96 100 101 102 109 110 114 115 116 117 121 139 148 153 154 158 159 161 162 169 170 173 174 178 186 193 194 209 210 211 221 228 229 |
| Proline-endopeptidase | 2 | 34 199 |
| Proteinase K | 104 | 2 5 9 11 13 14 16 18 19 24 27 28 29 31 35 36 38 41 43 45 46 51 53 55 57 58 59 64 67 68 69 70 72 73 76 79 80 84 86 88 89 90 91 93 94 95 96 97 100 101 102 103 104 107 108 110 115 116 117 119 121 122 126 132 137 140 141 145 148 149 153 154 158 159 161 162 165 170 171 174 176 177 178 183 184 186 187 192 194 200 201 202 204 206 209 210 211 212 215 218 219 221 224 229 |
| Staphylococcal peptidase I | 16 | 16 27 29 31 36 41 86 91 97 107 141 145 200 206 212 215 |
| Thermolysin | 53 | 1 4 8 10 12 14 18 23 24 39 42 44 52 54 57 66 67 68 79 87 94 99 101 109 114 115 118 120 121 131 132 152 153 158 159 160 161 164 169 173 182 183 185 186 191 193 201 203 209 210 217 218 228 |
| Trypsin | 23 | 4 10 12 44 47 71 81 92 109 120 135 136 147 150 163 175 179 181 182 185 203 220 228 |
These chosen enzymes do not cut:
Caspase1
Caspase10
Caspase2
Caspase3
Caspase4
Caspase5
Caspase6
Caspase7
Caspase8
Caspase9
Enterokinase
Factor Xa
GranzymeB
Thrombin
Tobacco etch virus protease
References
1. Benkert, P., Schwede, T. and Tosatto, S.C.E. (2009). QMEANclust: Estimation of protein model quality by # combining a composite scoring function with structural density information. BMC Struct Biol. 2009 May 20;9:35. If you publish results using DSSP, please cite the following paper: Dictionary of protein secondary structure: Pattern recognition of hydrogen bonded and geometrical features, Biopolymers 22:2577-2637
2. Benkert P, Biasini M, Schwede T. (2011). "Toward the estimation of the absolute quality of individual protein structure models." Bioinformatics, 27(3):343-50.
3. Arnold K., Bordoli L., Kopp J., and Schwede T. (2006). The SWISS-MODEL Workspace: A web-based environment for protein structure homology modelling. Bioinformatics, 22,195-201.
Newcastle 2019 Characterisation
The Newcastle iGEM team aimed to develop a suite of biosensors using fluorescence proteins as a reporter. Our goal was to investigated if we can measure fluorescence level correctly when reporter proteins are combined. We investigated whether mixing cultures of cells expressing different fluorescent proteins and chromoproteins would affect the fluorescence intensity of the individual fluorescent proteins. The fluorescent proteins we chose were sfGFP (BBa_K515105) and mCherry (BBa_J04450) and the chromoproteins we chose were fwYellow (BBa_K1033907) and cjBlue (BBa_K864404).
We obtained the reporter proteins from iGEM distribution kits. The resuspended DNA was transformed into E. coli DH5 alpha cells. Cells were inoculated in LB media and grown to an optical density 600 (OD600) of 0.6. Half of the culture was diluted to OD600 0.3 and the individual fluorescence levels were measured at: sfGFP - excitation 480nm and emission 507 and mCherry – excitation 580, emission 610. Each fluorescent protein was mixed with a chromoprotein individually using the culture grown to OD600 of 0.6 - sfGFP + fwYellow, sfGFP + cjBlue, mCherry + fwYellow and mCherry + cjBlue - and the fluorescence intensity was measured in a BioTek Synergy H1 Microplate Reader with a gain of 100.
The absorption wavelength maximum of cjBlue is approximately 610 nm [1]. The maximum absorption wavelength of fwYellow is 523 nm [2]. Given that the emission spectra for sfGFP ranges from 469 nm to 628 nm and the emission spectra for mCherry ranges from 551 nm to 800 nm, we would expect the mixing of fluorescent proteins with chromoproteins to decrease the fluorescence intensity of the fluorescent protein.

Figure 1. Bar chart showing the mean fluorescence intensity of E. coli DH5 alpha cells expressing sfGFP individually at an OD600 of 0.4 with standard deviations compared to the mean fluorescence intensity when mixed with cells expressing the chromoproteins fwYellow and cjBlue. Excitation 480 nm, emission 507 nm. Fluorescence intensity measured in BioTek Synergy H1 MicroPlate Reader

Figure 2. Bar chart showing the mean fluorescence intensity of E. coli DH5 alpha cells expression mCherry individually at an OD600 of 0.4 with standard deviations compared to the mean fluorescence intensity when mixed with cells expressing the chromoproteins fwYellow and cjBlue. Excitation 580 nm, emission 610 nm. Fluorescence intensity measured in BioTek Synergy H1 MicroPlate Reader
The results showed that when sfGFP was mixed with fwYellow, there was no significant difference in fluorescence intensity. Although, when sfGFP was mixed with cjBlue, there was a slight increase in fluorescence intensity but this was not significantly increased (Figure 1). When mCherry was mixed with fwYellow, there was a slight decrease in the fluorescence intensity of mCherry. Similarly, when mCherry was mixed with cjBlue, a slight decrease in the fluorescence intensity of mCherry was observed (Figure 2). Whilst there was a slight decrease in the fluorescence intensity of mCherry when mixed with the chromoproteins fwYellow and cjBlue, the difference was insignificant.
In conclusion, when fluorescent proteins are mixed with chromoproteins, this did not affect the fluorescence intensity of the fluorescent proteins. It can be concluded that despite the mixing of fluorescent proteins, when measuring fluorescence intensity, it can be confidently assumed that the results for each fluorescent protein is accurate.
For more detail see - https://2019.igem.org/Team:Newcastle/Results/bronzecharacterisation
References
1. Chan MC, Karasawa S, Mizuno H, Bosanac I,Ho D, Privé GG, Miyawaki A and Ikura M. Structural characterization of a blue chromoprotein and its yellow mutant from the Sea Anemone Cnidopus Japonicus 2006;281:37813.
2. NWU-China iGEM 2019. [Cited 20 Oct 2019]. Available at: https://2019.igem.org/Team:NWU-China/Characterization
CPU_CHINA 2019 Characterisation

We selected E.coli BL21 as our chassis and incubated the plates at 37℃ after transformation. Blue colony appeared on the plates within 12 hours, and got deeper after 24 hours.

After sonication, the cells lysate was centrifuged. Then the supernatant was subjected to ultrafiltration and His affinity chromatography. The target protein cjBLUE were collected with clearly tiffany blue color.
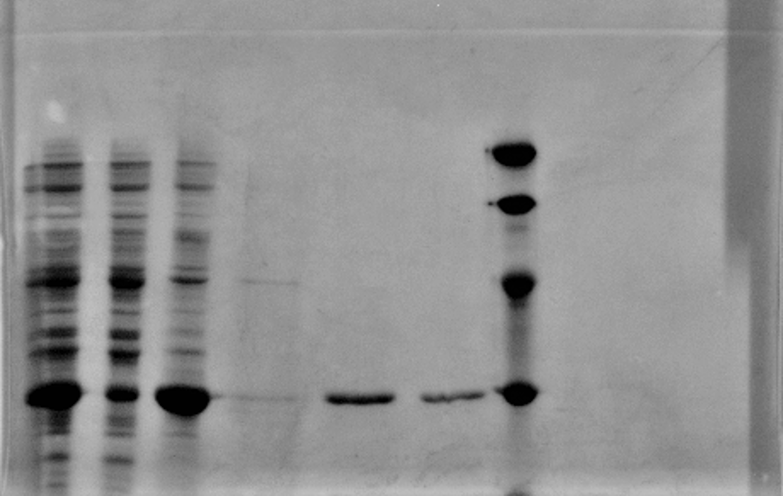
1: Total protein extract
2: soluble lysate
3: pellet after sonication
4 5 6: His purification
M: Marker

We performed TOF-Mass Spectrometry on the purified GST-tagged cjBlue protein. The predicted molecular mass of this protein is about 27500Da, and the exact size is 28610.8Da.

We used the BCA (Bicinchoninic acid) method to determine the concentration of cjBlue protein for quantitative characterization.
The test results showed that the concentration of cjBlue protein was 2.58 mg/ml.
Structure and absorbent feature of cjBlue
(Supplement by NWU-CHINA-A 2021)
According to the work of Mitchell C.Y. Chan et al[1], the crystal structure of cjBlue has been solved at a resolution of 0.18nm. The PDB files are available on protein database RCSB PDB(https://www.rcsb.org) with IDs of 2IB5 and 2IB6.

The absorbance spectra (Figure 2) of cjBlue and its three mutants is also measured by Mitchell C.Y. Chan et al[1], at a pH of 7.0 and a temperature of 22 degree centigrade.

References
[1] Mitchell C.Y. Chan, Satoshi Karasawa, Hideaki Mizuno, Ivan Bosanac, Dona Ho, Gilbert G. Privé, Atsushi Miyawaki, Mitsuhiko Ikura, Structural Characterization of a Blue Chromoprotein and Its Yellow Mutant from the Sea Anemone Cnidopus Japonicus*, Journal
Functional Parameters: Austin_UTexas
Burden Imposed by this Part:
Burden is the percent reduction in the growth rate of E. coli cells transformed with a plasmid containing this BioBrick (± values are 95% confidence limits). This BioBrick did not exhibit a burden that was significantly greater than zero (i.e., it appears to have little to no impact on growth). Therefore, users can depend on this part to remain stable for many bacterial cell divisions and in large culture volumes. Refer to any one of the BBa_K3174002 - BBa_K3174007 pages for more information on the methods, an explanation of the sources of burden, and other conclusions from a large-scale measurement project conducted by the 2019 Austin_UTexas team.
This functional parameter was added by the 2020 Austin_UTexas team.
Structure and Characteristics
(Supplement by NWU-CHINA-A 2022)
CjBlue is a non-fluorescent blue protein that shares 45% sequence identity with dsRed and has a maximum absorbance of 610nm.The crystal structure of it is 1.8 A and has four chemically identical subunits.


CjBlue is a non-fluorescent pigment protein which is a homologue of fluorescent protein (FP) which is also called chromatin (CP).
CP differs from fluorescent protein (FP) in that it strongly absorbs visible light and produces intense color under ambient light. Compared with FP, CP has many advantages, such as not affected by ultraviolet light damage or background fluorescence, with efficient foster resonance energy transfer (FRET) quenching and optical imaging, and ease of semi-quantification by the eye without equipment, and the possibility of more accurate quantification of cellular expression using cameras or spectrophotometers and appropriate software. In this experiment, cjBlue was used as the output signal of the sensor to quantify the expression of cells.
References
[1]Mitchell C.Y. Chan, Satoshi Karasawa, Hideaki Mizuno, Ivan Bosanac, Dona Ho, Gilbert G. Privé, Atsushi Miyawaki, Mitsuhiko Ikura.Structural Characterization of a Blue Chromoprotein and Its Yellow Mutant from the Sea Anemone Cnidopus Japonicus*. Journal of Biological Chemistry, Volume 281, Issue 49,2006,Pages 37813-37819,ISSN 0021-9258.
[2]Li, Y., Forbrich, A., Wu, J. et al. Engineering Dark Chromoprotein Reporters for Photoacoustic Microscopy and FRET Imaging. Sci Rep 6, 22129 (2016). https://doi.org/10.1038/srep22129
[3]Liljeruhm, J., Funk, S.K., Tietscher, S. et al. Engineering a palette of eukaryotic chromoproteins for bacterial synthetic biology.J Biol Eng 12, 8 (2018). https://doi.org/10.1186/s13036-018-0100-0
//collections/chromoprotein/uppsala
//function/reporter/pigment
| color | Blue |
| protein |