
Part:BBa_K1583002
Mfp5 adhesive protein
This basic part contains the Mfp5 gene. It is used in the biobricks BBa_K1583104 and BBa_K1583110 as a fusion protein with the protein CsgA (BBa_K1583000).The expression of this fusion protein can be controlled with the rhamnose inducible promoter (BBa_K914003).
CsgA is a protein monomer which can aggregate to form amyloid nanowires in natural biofilms taken from E.coli K-12 MG1655. Inspired by mussels, the Mfp5 (mussel foot protein) has high adhesive properties towards wet polar surfaces. CsgA is a protein monomer which can aggregate to form amyloid nanowires in natural biofilms of E.coli. This protein is transported as an unfolded protein out of the cell. Outside the cell CsgA proteins self-assemble into nanowires after nucleation on the membrane protein CsgB. By creating a fusion protein of Mfp5 and CsgA, the adhesive properties of the mussel foot protein is combined with the formation of nanowires.
The design was based on the paper "Strong underwater adhesives made by self-assembling multi-protein nanofibres" (Zhong et al, 2014).
Sequence and Features
- 10COMPATIBLE WITH RFC[10]
- 12COMPATIBLE WITH RFC[12]
- 21INCOMPATIBLE WITH RFC[21]Illegal BamHI site found at 76
- 23COMPATIBLE WITH RFC[23]
- 25COMPATIBLE WITH RFC[25]
- 1000COMPATIBLE WITH RFC[1000]
Characterization
This basic part was used in the biobricks BBa_K1583104 and BBa_K1583110. These biobricks were characterized in three different experiments:
- Protein expression
- Fluorescence assay
- Crystal Violet assay
- Transmission electron microscopy
Fluorescence assay
To be able to ensure that CsgA is expressed, we added a gene encoding for GFPmut3 (BBa_I13504) under induction of the same rhamnose promoter (BBa_K1583112) to check that the promoter works. In this experiment, the fluorescence signal of our csgA construct and csgA-GFP (I13504) constructs was recorded in time after induction with no, 0.2% (w/v) or 0.5% (w/v) rhamnose. Besides the fluorescence, the OD600 was measured in order to normalize the fluorescence signal per cell.All conditions were carried out in triplicates to be able to do a statistical analysis on the data. The different experiments were induced in a 96 well plate. The OD600 and fluorescence signal was recorded in a plate reader during a 18 hour period of induction at 30°C.
In figure 1, the fluorescent signal was normalized by the number of cells and plotted as a function of time. The red bars denote the error within each ID.
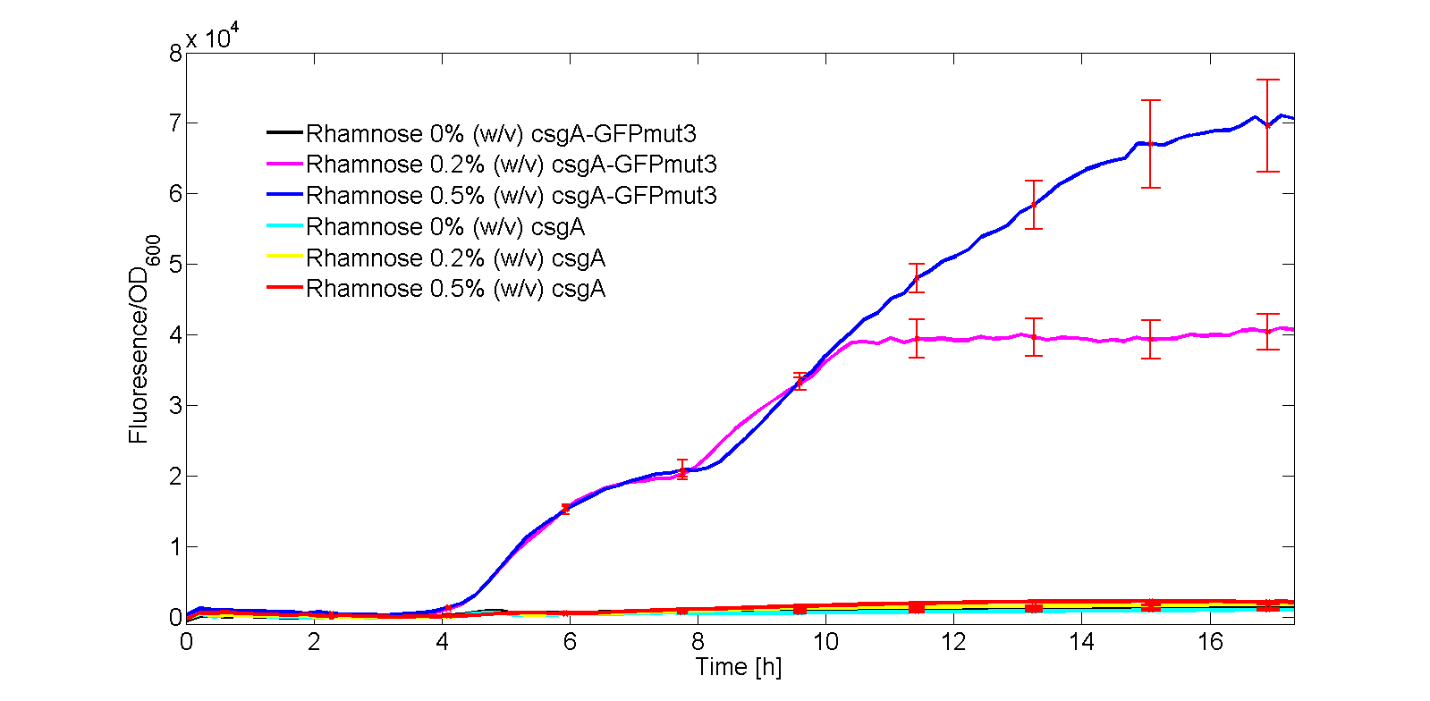
As can be seen from Fig. 1, only the experiments with 0.2% (w/v) and 0.5% (w/v) rhamnose induction with the csgA-GFPmut3 construct gave a clear increase in fluorescence signal in time. All other experiments, gave similar levels of fluorescence, slightly increasing in time. Furthermore, it can be seen that a higher induction level of rhamnose leads to an increase in GFPmut3 and thus fluorescence. Finally, as the fluorescence signal is normalized by the cell density, one can make statements about the activity of the rhamnose promoter. The promoter seems to not be active right after induction, but more after 3 or 4 hours. This is in accordance with data from literature (Wegerer et. al), in which a low amount of fluorescence with a rhamnose promoter was observed after 2 hours of induction.
With this kinetic experiment, we have proven that the rhamnose promoter does indeed induce the expression of the csgA gene.
Crystal violet assay
The assay above showed that the bacteria that we engineered for the project is capable of producing the CsgA proteins after induction with L-rhamnose. However, this did not yet prove that curli are formed. In order to assess whether our bacteria producting the fusion protein of Mfp5 and CsgA can still produce these nanowires, our team adapted the protocol from Zhou et al. (2013) that employs crystal violet (methyl violet 10B) for dying the biofilm-making bacteria that attaches to the surface. In the experiment, our Mfp5_CsgA-producing strain of E. coli was induced at a high (0.5% w/v), low (0.2% w/v) and no (0% w/v) concentration of L-rhamnose. Furthermore, csgA deficient bacteria transformed with an empty plasmid (pSB1C3) were used as control. In the end, the wells were diluted with ethanol so all the content can dissolve in the liquid phase. We measured the absorbance at 590 nm of wavelength for all the samples, obtaining the following results (figure 2.).

To confirm that there is a real change between the analysed samples and the empty plasmid control, a significance analysis was performed for α=0.05 (Table 1.).
| Sample | p-value | Significant difference (5%) |
|---|---|---|
| CTRL2 & MFP52 | 0.0043 | Yes |
| CTRL5 & MFP55 | 0.0016 | Yes |
The significance analysis shows that cells containing the Mfp5_CsgA_His (BBa_K1583104) biobrick can efficiently create a curli, when compared with an empty plasmid control (i.e. without csgA expression).
Transmission electron microscopy
Using TEM the formation of curli of the biobrick BBa_K1583100 was visualized (Figure 3). Although this is a different biobrick containing only CsgA (compared to the fusion protein of Mfp5_CsgA_His), curli formation can be presumed to be similar for this biobrick suggested by the Crystal Violet assay.


We did not observe formation of curli nanowires in the uninduced cultures of our strain. However, cells from induced cells clearly produced them, as supported by the TEM images.
Reference
Wegerer, A., Sun, T., and Altenbuchner, J. (2008). Optimization of an E. coli L-rhamnose-inducible expression vector: test of various genetic module combinations”, BMC Biotechnology, 8:2
Zhou, Kang, Kangjian Qiao, Steven Edgar, and Gregory Stephanopoulos. 2015. “Distributing a Metabolic Pathway among a Microbial Consortium Enhances Production of Natural Products.” Nature Biotechnology 33(4): 377–83.
Improved by team Greatbay_SCIE
Characterisation
BBa_K1583002 was characterized in following experiments:
- Protein expression
- Protein purification
Protein expression

In our project, Mfp5 was used as an adhesive part to create recombinant proteins. We clone Mfp5 alone into the pET28b expression vector as control. We expressed pET28b-mfp5 in E.coli BL21(DE3) Rosetta by 500μM IPTG for 5h at 37℃. In order to detect its expression, whole cells were collected after induction by centrifuging and prepared for SDS-PAGE. Results showed that no obvious protein bands of Mfp5 (~10 kDa) could be observed on lane mfp5 compared with lane pET28b (pET28b empty vector)(Figure 5A), which means the expression of this protein couldn’t be detected in BL21(DE3) Rosetta. Quantitative densitometry analysis of SDS-PAGE indicated that Mfp5 almost not expressed under this expression conditions (Figure 5B).

Protein purification
The predicted size of mfp5 is 9.97 kDa and the isoelectric point is 10.19. Though no bands of interest could be observed on gels detecting the expression of Mfp5 (Figure 5A), we straightly go protein purification under denaturing conditions. As shown in Figure 6, no bands around 10kDa could be observed on Lane E1 and E3, which were eluted protein samples.

Improved by team ShanghaiTech_China
We got the plasmid pET28a-Mfp5-1 by placing an order with GENEWIZ. (Mfp5-1 is the same as Mfp5. We call it Mfp5-1 for we expressed another protein(Mfp5-2) which contains two copies of Mfp5.) Then we transformed this plasmid to express Mfp5-1 in E.coli BL21(DE3). We purified Mfp5-1 and modified the tyrosine residues of Mfp5-1 successfully. Our protocols and related results are shown below.
Exploration of Cinditions of Induction
Before protein purification, we decided to explore the proper induction conditions. So we made two control groups and four experimental groups. In Figure 1, we could find that mfp5-1 was successfully expressed in four groups since there was an obvious band between 15-20 kDa compared with blank control(Blank BL21(DE3)) and negative control(Before induction).
Notably, there was a slight band in negative control(Before induction). We inferred that leaked expression of mfp5-1 might happen in negative control.

IPTG Inducion
After obtaining the single colony of transformed bacteria on the solid medium, we need to inoculate them in liquid culture to expand culture and then induce them with IPTG to get enough protein-producing bacteria:
1. the colony was inoculated into 5ml of 30µ l/ml kanamycin LB liquid medium and cultured on a 37 ° C,220 rpm shaker for 8 hours.
2. Then inoculated 5ml of bacterial solution in each 1L of 30µ L/mL kanamycin LB liquid medium.
3. When the OD value of the bacterial solution at 600nm reached 0.8-1.0, 500µ L IPTG solution of 1M was added to each L of bacterial solution, and the culture was performed on a 37 ° C,220 rpm shaker for 8-10 hours.
4. Finally, the obtained bacterial solution was centrifuged at 3500RCM for 20 minutes to obtain the precipitated bacteria.
Protein Purification
Since the recombinant Mfp5 expressed in E.coli is mostly in inclusion bodies, we need to add denaturants(here we used guanidine hydrochloride refer to the literature[9]) during purification to maintain the soluble state of the protein. In order to obtain high purity protein, we added 6*His tag to Mfp5CDS and purified it by nickel ion affinity chromatography. The buffer formula and purification steps are as follows:
Buffer preparation *Lysis buffer: 6 M guanidine hydrochloride, 50 mM potassium phosphates, 300 mM sodium chloride, pH 7.4*Wash buffer: 6 M guanidine hydrochloride, 50 mM potassium phosphates, 300 mM sodium chloride, 50 mM imidazole, pH 7.4
*Elution buffer: 6 M guanidine hydrochloride, 50 mM potassium phosphates, 300 mM sodium chloride, 250 mM imidazole, pH 7.4
Mfp5 purification
Suspended cell pellets with 10 ml of lysis buffer per gram of wet cells and lysed it at 37°C, 220 rpm for 20 min. The cell suspension was then sonicated on ice for 30 min with a sonicator using 5 s on/ 5 s off cycles. Sonicated cell suspension was incubated at 37°C, 220 rpm, 40 min for ful dissolution of Mfp5.
The suspension was centrifuged at 20000 g for 20 min at 18°C, and the supernatant was collected to be incubated with nickel media at 37°, 30 rpm for 1 hour. Then put the mixture into the column to let it flow through. After washing with 5-10 column volumes of wash buffer, Mfp5 was eluted by 1-2 column volumes of elution buffer.
SDS-PAGE Analysis
We ran SDS-PAGE after each mfp5-1 purification. Fig.2a is the results of our first purification. It was obvious that a great amount of mfp5-1 was expressed in BL21 (compared samples before induction and after induction), and it totally dissolved in the lysis buffer. After elution, we got purified mfp5-1, but some mfp5-1 still remained on nickel medium. Since Fig.2a lacked flow through and washing samples, we did another purification, which was Fig.2b.
Fig.2b almost shows the same results as Figure 2 A. We could find the band of mfp5-1 in flow-through, indicating that the amount of mfp5-1 had saturated nickel medium. Moreover, low concentration imidazole could elute some mfp5-1 as well.
We found there was an unexpected band between 20-25 kDa in washing and elution samples(Fig.2b), which is not shown in Figure 2 A. It may be caused by the nickel medium since we used it to purify mfp5-2 before purification of mfp5-1 and did not clear it totally. The band of mfp5-2 is actually between 20-25 kDa.


Fig.2b(right): SDS-PAGE of second purification of mfp5-1
Modification of Tyrosine Residues
Only when the tyrosine residue of Mfp5 is converted into dopamine can the protein become adherent. This step requires tyrosinase catalysis, so we first replace the purified protein buffer until the environment is suitable for tyrosinase to work, and then add enzymes to complete the modification. The buffer formula and modification steps are as follows:
Buffer preparation
*Gradient buffer 1: 4 M guanidine hydrochloride, 50 mM potassium phosphates, 300 mM sodium chloride, 250 mM imidazole, pH 7.4
*Gradient buffer 2: 2 M guanidine hydrochloride, 50 mM potassium phosphates, 300 mM sodium chloride, 250 mM imidazole, pH 7.4
*Gradient buffer 3: 0.5 M guanidine hydrochloride, 50 mM potassium phosphates, 300 mM sodium chloride, 250 mM imidazole, pH 7.4
*Dialysis buffer: 100 mM sodium acetate, pH 5.5
*Storage buffer: 5% acetic acid
Mfp5 modification
Purified protein solutions were first dialyzed in gradient buffer 1, gradient buffer 2, gradient buffer 3 at 4°C for 8 hours each successively to decrease the concentration of guanidine hydrochloride.
Then protein solutions were dialyzed in dialysis buffer at 4°C for 8 hours to entirely replace its buffer. Dialyzed proteins were then diluted to a concentration of 4 mg/ml in dialysis buffer with 100 mM ascorbic acid and filtered. Tyrosinase was added to a final concentration of 250 U/ml, and the mixture was incubated at 37°C, 220 rpm for 30 min. After the reaction, the solution was filtered, and enzyme activity in the solution was quenched by adding 0.2 ml of 6 N HCl per ml of reaction. The sample was then dialyzed in 5% acetic acid and stored in 4°C.
Yield Calculation
After nickel ion affinity chromatography elution, we tested the OD value of the washing sample at 280nm and calculated the average yield. The result turned out to be 24mg per liter of bacteria solution. After modification, we tested the OD value again and found out the yield became 8mg per liter of bacteria solution or so, and the loss during modification is up to 2/3.
Mfp5-1 Adhesion Analysis
The adhesion test experiments of Mfp5-1&Mfp5-2 were carried out simultaneously as a control experiment, so the data of both Mfp5-1 and Mfp5-2 would be presented here.
To characterize as much as possible the viscosity of tyrosine enzyme-modified mfp5-1 and mfp5-2, take 20ul of the concentrated protein solution(concentration: mfp5-1=50mg/ml,mfp5-2=40mg/ml) to attach the PCR tube and the tube cover(Fig.3 top left and top right) (The PCR tube cover is trimmed and polished to a round face with a diameter of 7mm)to the center of the petri dish and perform a viscidity test after 48 hours of drying in a 37-degree oven.
Lift the petri dish at a certain height through the PCR tube and add the glass beads one by one to the petri dish until the last glass bead is added to cause the petri dish to fall off with the PCR tube(Fig.3 bottom left and bottom right). The viscosity of the added protein can be calculated by weighing the total weight of the Petri dish and glass beads.

Each experiment was recorded with a video camera, and every moment of falling off was recorded.
Video.1We calculated the results by the following steps:

| None |