Part:BBa_E1010:Experience
This experience page is provided so that any user may enter their experience using this part.
Please enter
how you used this part and how it worked out.
RANDOM SEQUENCE FOUND WITHIN PART
CGCTGATAGTGCTAGTGTAGATCGC is found after the RFP stop codon and before the BioBricks suffix. Should not affect transcription or translation of RFP, but good to keep note of it especially in analyzing sequencing results. (KP of siGEM)
- Please note that the above sequence is the old "barcode" sequence added to all of the original CDSs in the early BioBrick part collections. I.e., it's not a random sequence. See https://parts.igem.org/cgi/htdocs/barcodes.cgi for more information (D. Endy).
- FURTHER NOTE The Registry is not displaying barcodes on any of the original parts. The presented sequence information is wrong. This is a serious bug in the Registry that need to be fixed (D. Endy). Drew 14:34, 1 November 2010 (UTC)
Applications of BBa_E1010
User Reviews
UNIQfcc561119abd765e-partinfo-00000000-QINU
|
•••••
Immudzen |
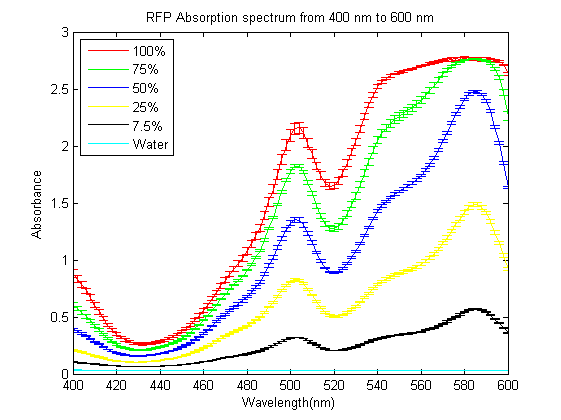
As part of the 2013 CU Boulder project we worked on separating RFP from AmilCP and during that process we ran into a problem that the fluorescence of RFP is too close to the absorption of AmilCP to tell them apart. What we ended up doing was measuring the spectrum of RFP from 400nm to 600nm. What we found is that RFP has a secondary absorbance peak at 502nm which is well clear of AmilCP. Under the devices we had access to this secondary peak also remained in the linear region of our device over a much wider concentration range. We also found that when running on an agarose gel RFP will run down on the gel while AmilCP runs up on the gel. |
|
•••••
HIT-Harbin |
1)Measuring absorbance of RFP We grew E.coli without device(BBa_J04450) and bacteria with parts BBa_J04450 in same volume of LB until stationary phase. Taking E.coli without device as background, we measured the absorbance of bacteria with BBa_J04450 (RFP have two absorption peak, 504nm and 585nm figure1).But absorbance in 504nm and 585nm is higher than 1,which present a bad linear relation between absorbance and concentraton. RFP has absorption in 450nm,and absorbance is between 0.1 and 1(better linear relation).Occasionally, we find a RFP standard curve under 450nm on the web.Before the mensuration, we diluted the two groups according to table1. We took the mean of two measures as the useful data. " Fig.1 RFP absorbance varying with wave length Table 1 Dilution of Two groups of bacteria " Fig 2. The relationship between RFP concentration and absorbance(OD450)
" Fig 3. RFP standard curve obtain from the web <p> Through the standard curve, we can convert the relative concentration to theabsolute concentration, and finally get the relationship between IPTG concentration and RFP concentration. Compared to crushing cells to separate RFP, our method is simpler and easy topractice. Moreover, our relative concentration curve is credible. If the standard curve is reliable, our calculated result of RFP will be precise. |
|
•••••
Carnegie_Mellon 2013 |
Characterization of the Photostability of mRFP1 XL10 Ultracompetent cells were transformed with BBa_E1010 cloned with BBa_B0034 as the RBS and BBa_R0010 as the wild-type lac promoter and induced overnight with IPTG.The overnight was bleached for 180 minutes with HBO100 (100W Mercury-arc lamp). Fluorescence data was taken using a Tecan Safire II with the parameters shown in Table 3. Fluorescence values are shown in Table 4.
|
|
••••
KAIST_iGEM_2012 |
 Figure 1. E.coli strain MG1655 expressing BBa_E1010 under control of BBa_K907005 after overnight culture. 3mL culture with M9 media in 14ml round bottom tube(left), and centrifuged cells in eppendorf tube(right). The expression of BBa_1010 is clearly observed with naked eye after overnight culture.
|
|
•••
DTU_igem_2010 |
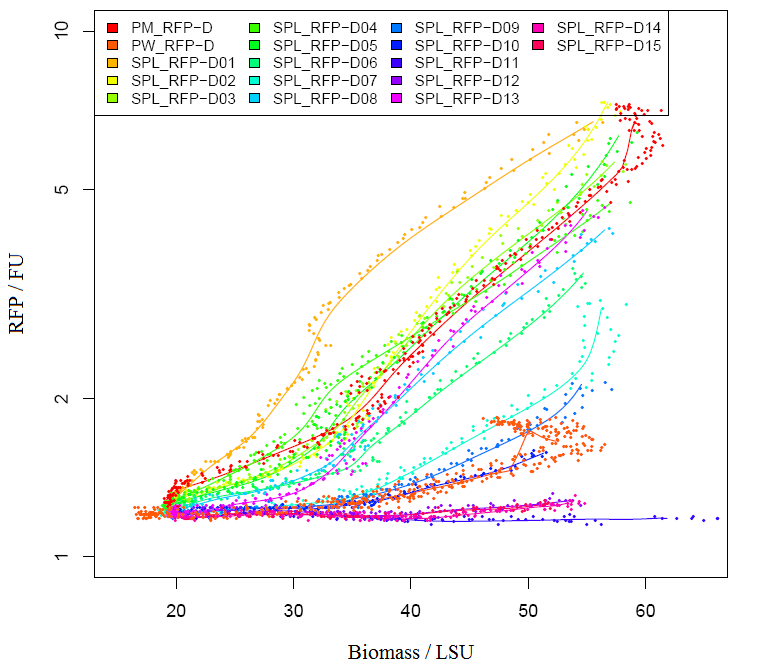
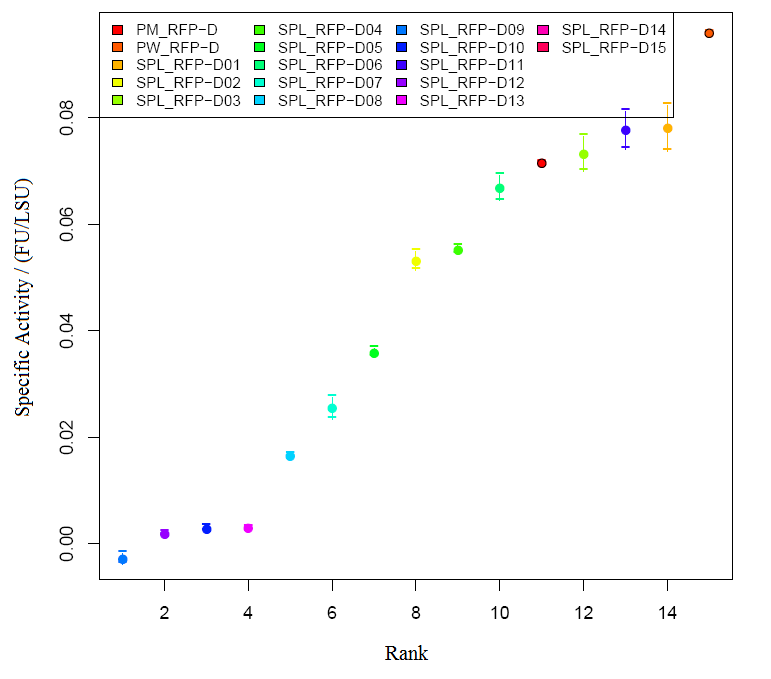
Characterization of RFP BBa_E1010 Method Results
|
|
Antiquity |
This review comes from the old result system and indicates that this part did not work in some test. |
|
Nkessler |
We successfully used this part for a read out system, e.g. in BBa_K389016. Additionally we compared it with a luciferase: BBa_K389004. |
UNIQfcc561119abd765e-partinfo-00000012-QINU

 1 Registry Star
 "
"
 "
"
"
" "
"
 "
"


