Difference between revisions of "Part:BBa B0034"
(→Improvement from iGEM 2021 SZPT-China) |
|||
| Line 21: | Line 21: | ||
definition of 100% strength in our measurement. | definition of 100% strength in our measurement. | ||
</html> | </html> | ||
| + | |||
| + | ==KEYSTONE_2022 Characterization== | ||
| + | As a biobrick RBS (Ribosome-Binding Site), we used it to be assembled with several CDS, such as ClSS_S533A (Part Number: BBa_K4274000) ,CmR29M2-ClSS_S533A (Part Number:BBa_K4274001),ERG20 (Part Number: BBa_K849001), ERG20_F96W(Part Number: BBa_K4274002). | ||
| + | |||
| + | ===Santalene production in <i>E.coli</i> DH5α=== | ||
| + | After engineering, <i>E. coli</i> could utilize both MEP pathway and MVA pathway for the universal precursors isopentenyl diphosphate (IPP) and dimethylallyl diphosphate (DMAPP), then synthesize santalene with the help of FPP Synthase (FPPS) and santalene synthase (SS). Except heterologously expressed MVA pathway and ERG20 of <i>Saccharomyces cerevisiae</i> and santalene synthase of <i>Clausena lansium</i> (<i>Cl</i>SS), several modifications upon ERG20 or <i>Cl</i>SS by amino acid mutation, binding to a hydrophillic tag and the construction of fusion protein were tested for the higher yield of santalene. Therefore, with the help of the co-transformation of pMVA plasmid with various pW1 plasmids, including pW1_CE, pW1_CEM, pW1_TCEM and pW1_CEM_FL, different strains like CE, CEM, TCEM, CEM_FL were successfully constructed (Figure 1). The complete pathway we designed for producing santalene in <i>E. coli</i> is illustrated in Figure 1. | ||
| + | |||
| + | [[Image:Parts-keystone-santalene1.jpeg|thumbnail|750px|center|'''Figure 1:''' | ||
| + | Construction and expression of santalene. (a) Enzymes and some of the reaction intermediates necessary for the production of santalene through the MEP pathway and MVA pathway. (b) Schematic representing the structure of pMVA, pW1_CE, pW1_CEM, pW1_TCEM and pW1_CEM_FL transformed into <i>E.coli</i> DH5α ∆TnaA. ]] | ||
| + | |||
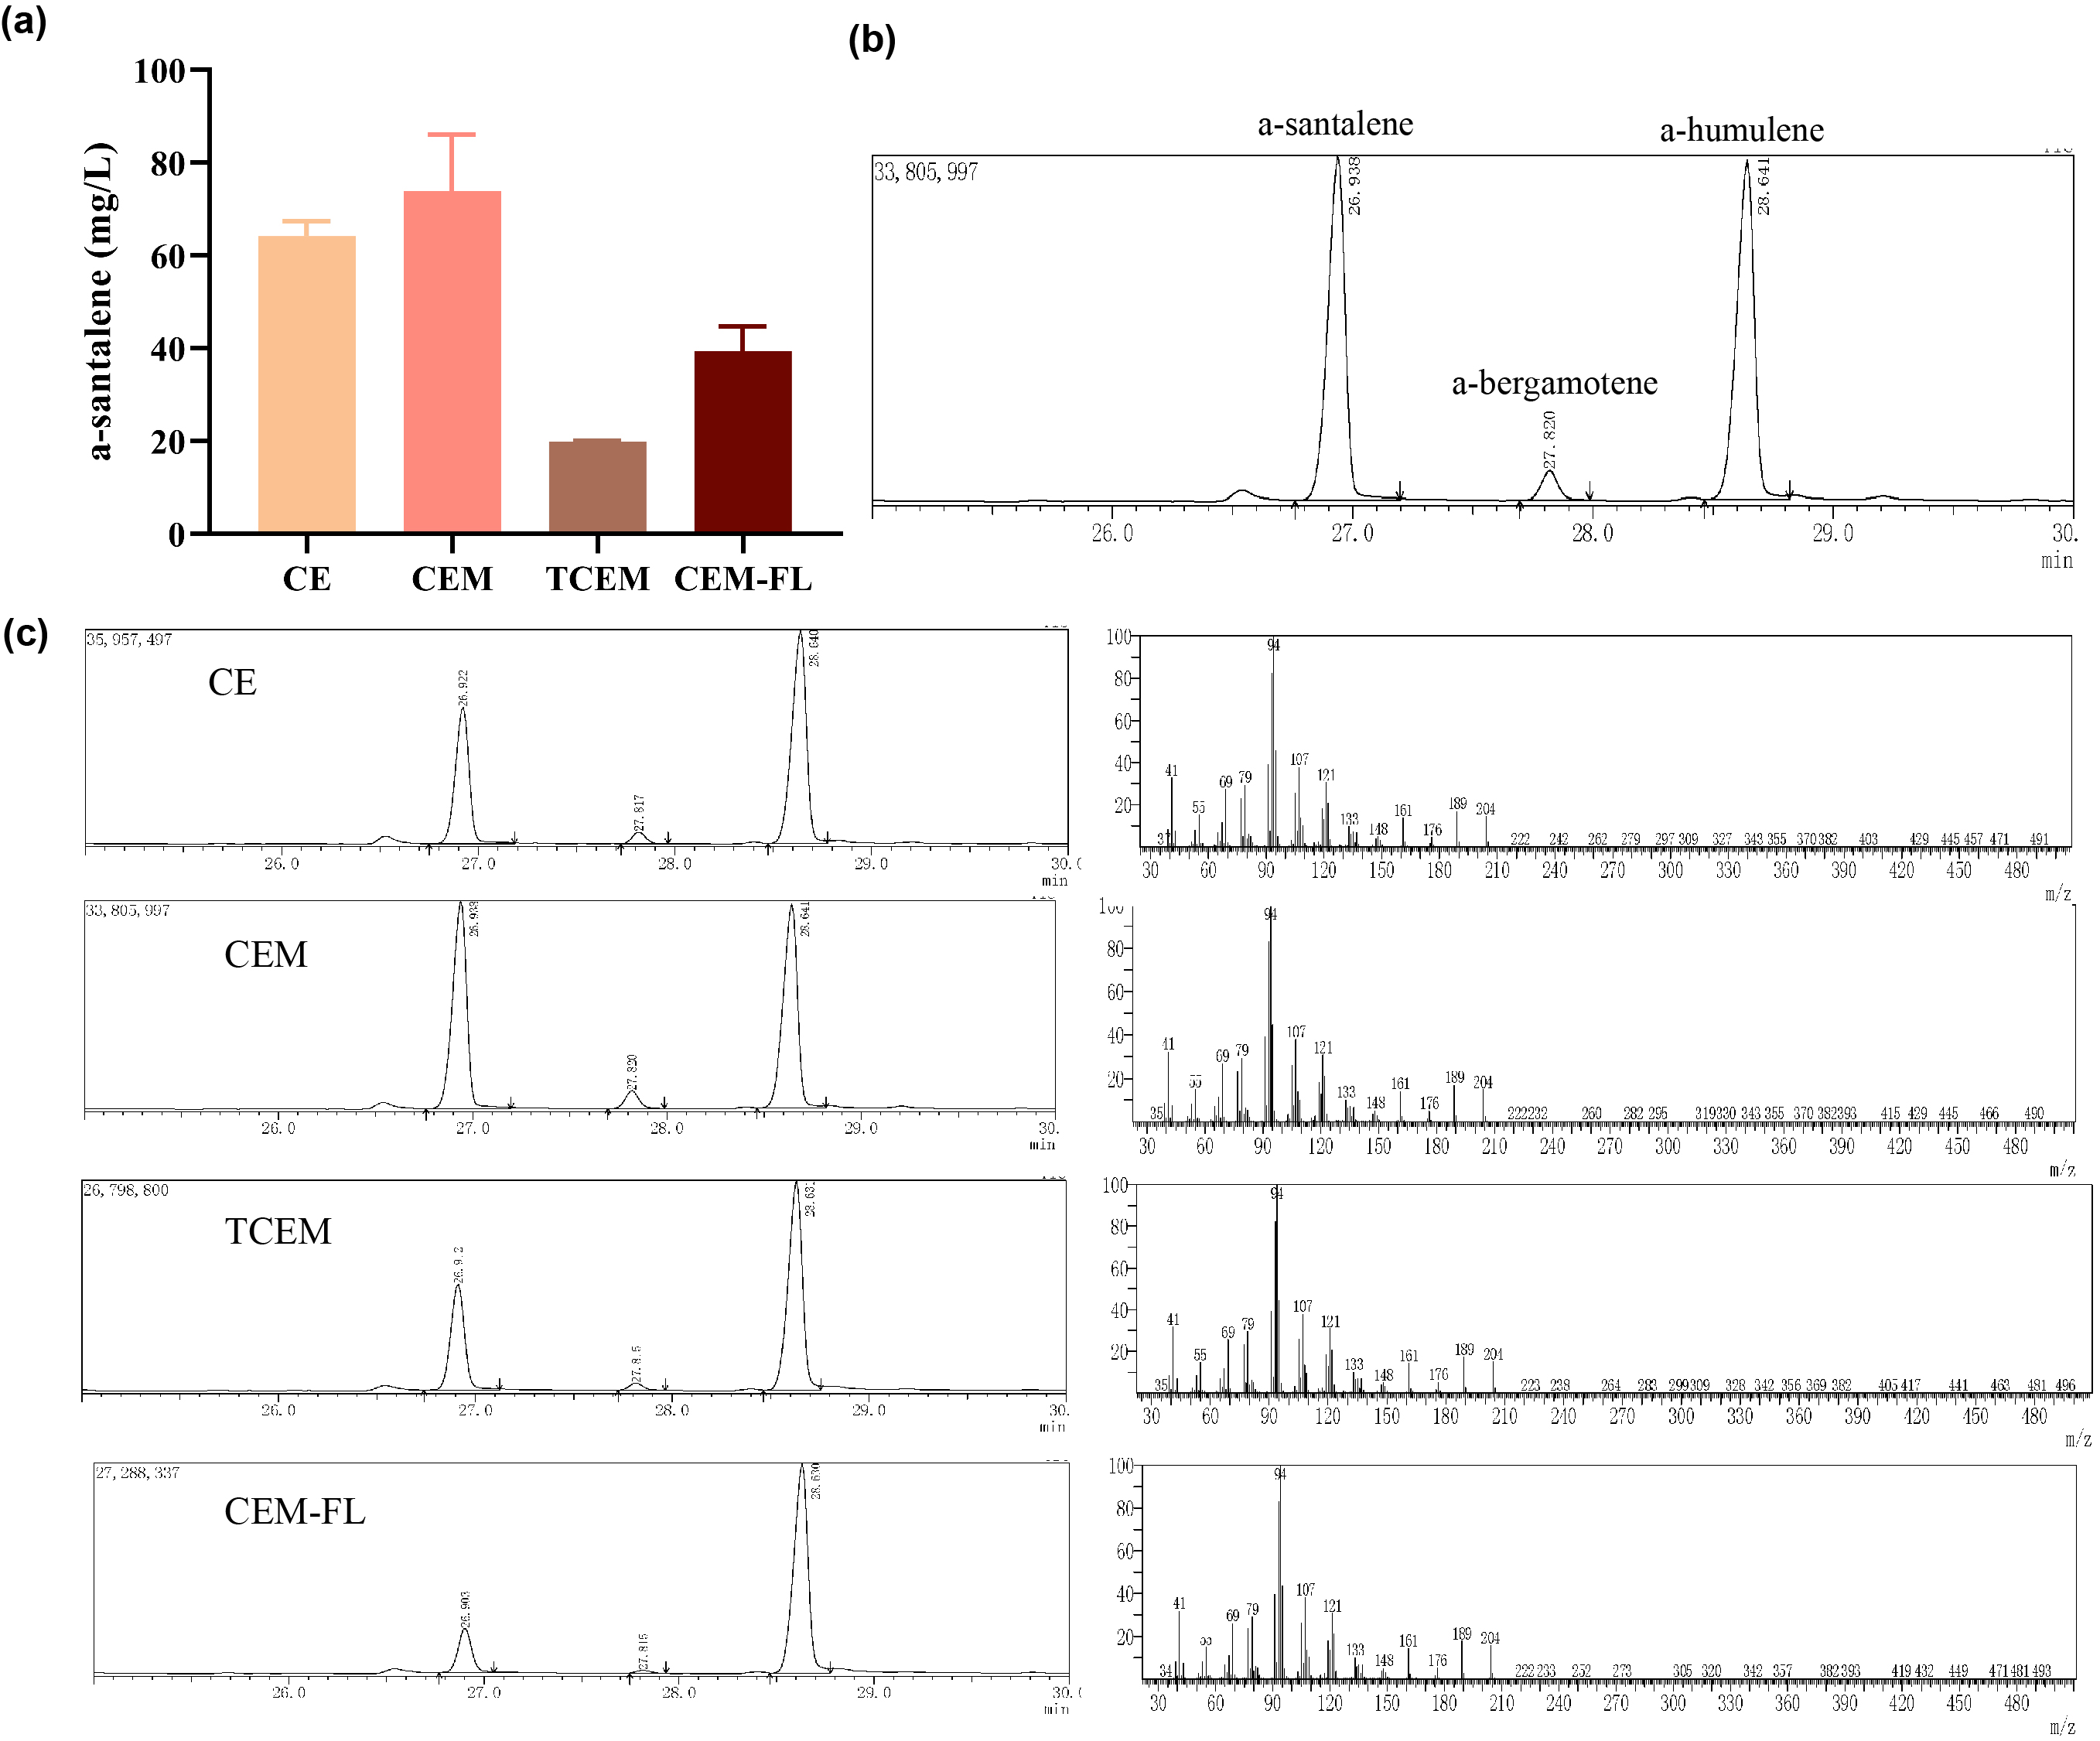
| + | Afterwards, the various engineering of E.coli DH5α ∆TnaA mentioned above were used for santalene production. After rapid centrifugation, the supernatant of dodecane was spiked with with 0.475 g/L a-humulene as an internal standard, and then injected into GC/MS for verification of α-santalene production. It turned out that all samples from four strains appeared a significant peak at the retention time of 26-27 min, and various peak area of different samples exhibited santalene production with differing levels, indicating the general success of E. coli engineering. It can be concluded that the E. coli strain CEM (with pW1_CEM plasmid) produces the maximal level of α-santalene compared to other strains (73.93 mg/L). Furthermore, our study elucidates that the mutation of 96th amino acid into tryptophan could increase the yield of α-santalene by about 20%, substantiating the prominent performance of ERG20F96W in enhancing the supply of FPP and α-santalene production in E. coli (Figure 2). | ||
| + | |||
| + | [[Image:Parts-keystone-santalene2.jpeg|thumbnail|750px|center|'''Figure 2:''' | ||
| + | Quantification analysis of α-santalene production. (a) Measurement santalene production of different strains by GC/MS results. (b) Quantification of α-santalene is analyzed with 0.475 g/L α-humulene as an internal standard. And the GC/MS results demonstrate that the peaks at the retention time of 26-27 min and 28-29 min respectively were α-santalene and α-humulene. (c) GC/MS results of samples originated from CE, CEM, TCEM and CEM-FL strains.]] | ||
| + | |||
| + | |||
===Contribution=== | ===Contribution=== | ||
Group: Valencia_UPV iGEM 2018 | Group: Valencia_UPV iGEM 2018 | ||
Revision as of 12:28, 12 October 2022
RBS (Elowitz 1999) -- defines RBS efficiency
RBS based on Elowitz repressilator.
Usage and Biology
IIT Madras 2016's Characterization
Modelling
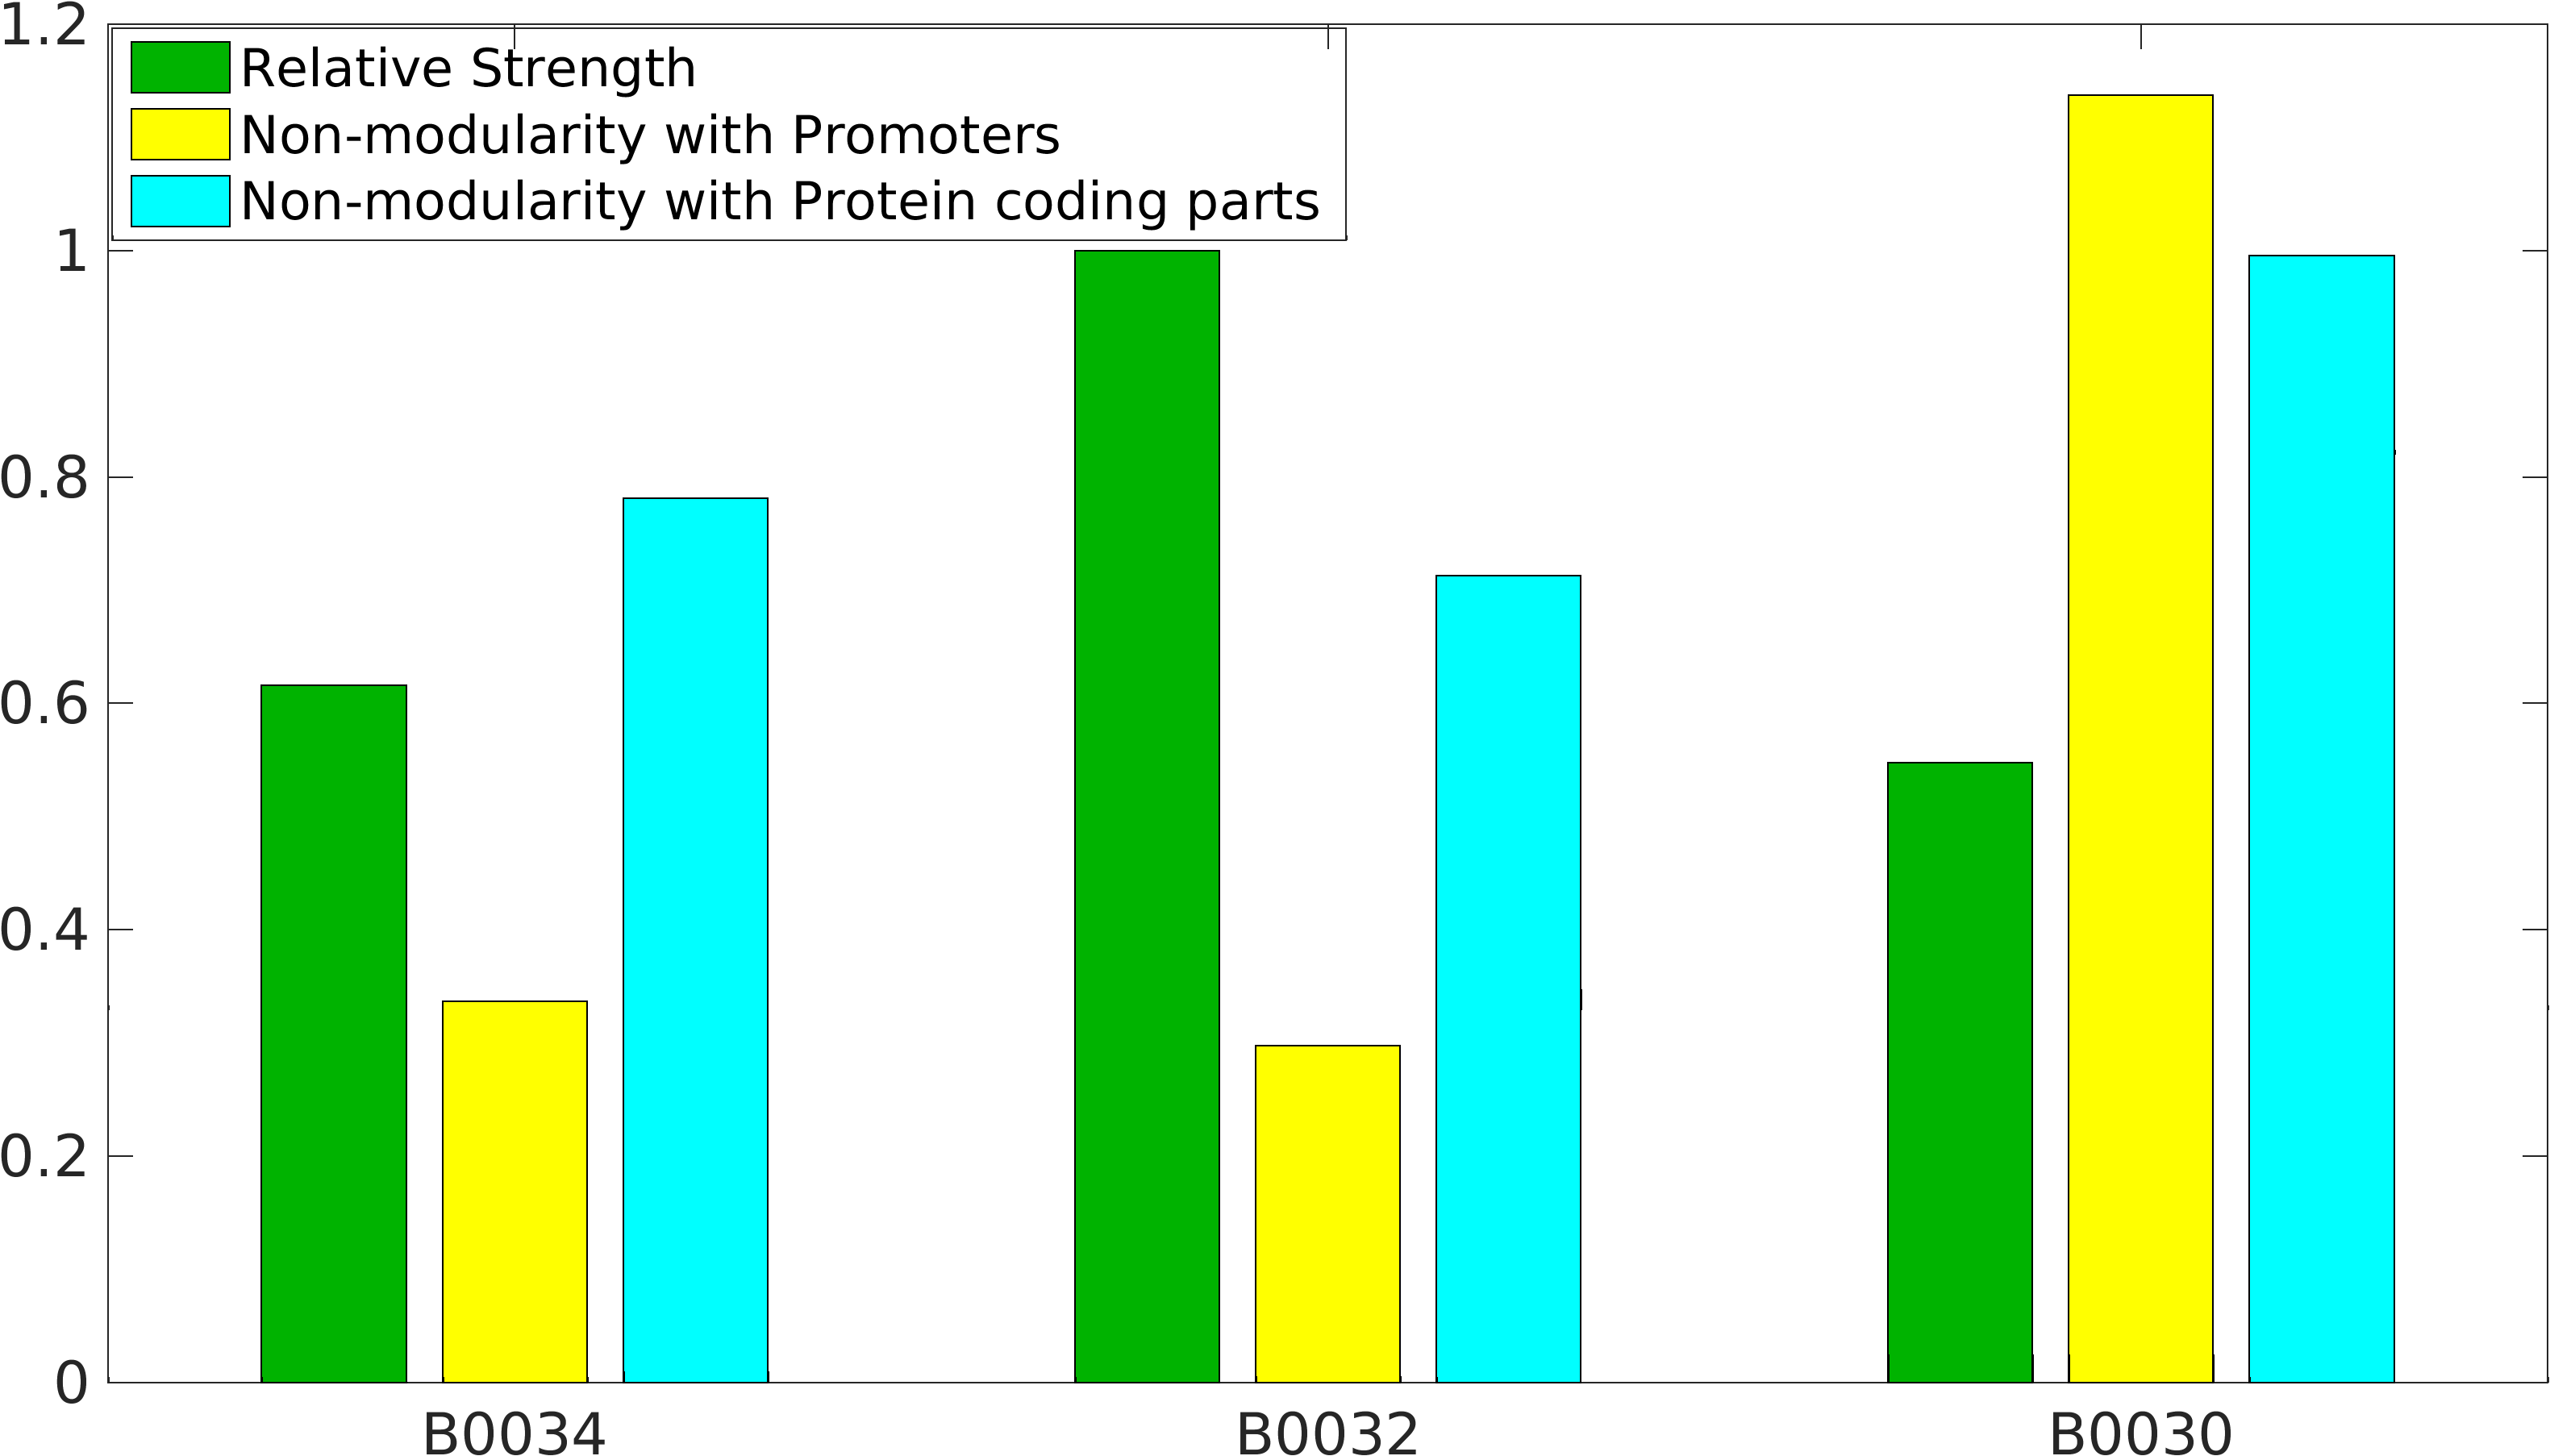
Global non-modularity towards promoters & protein coding parts and relative strength was estimated for RBSs B0030, B0032, B0034 in our [http://2016.igem.org/Team:IIT-Madras/Model#Modularity_of_RBS_parts modelling]
Experimentation
Biobrick RBSs B0030, B0031, B0032, B0034 were used in our 'Noise in Device' experiment to understand the role of RBS parts in giving rise to noise.
Note: The Elowitz RBS is the definition of efficiency 1.0.
Team Warsaw 2010's measurement
definition of 100% strength in our measurement.KEYSTONE_2022 Characterization
As a biobrick RBS (Ribosome-Binding Site), we used it to be assembled with several CDS, such as ClSS_S533A (Part Number: BBa_K4274000) ,CmR29M2-ClSS_S533A (Part Number:BBa_K4274001),ERG20 (Part Number: BBa_K849001), ERG20_F96W(Part Number: BBa_K4274002).
Santalene production in E.coli DH5α
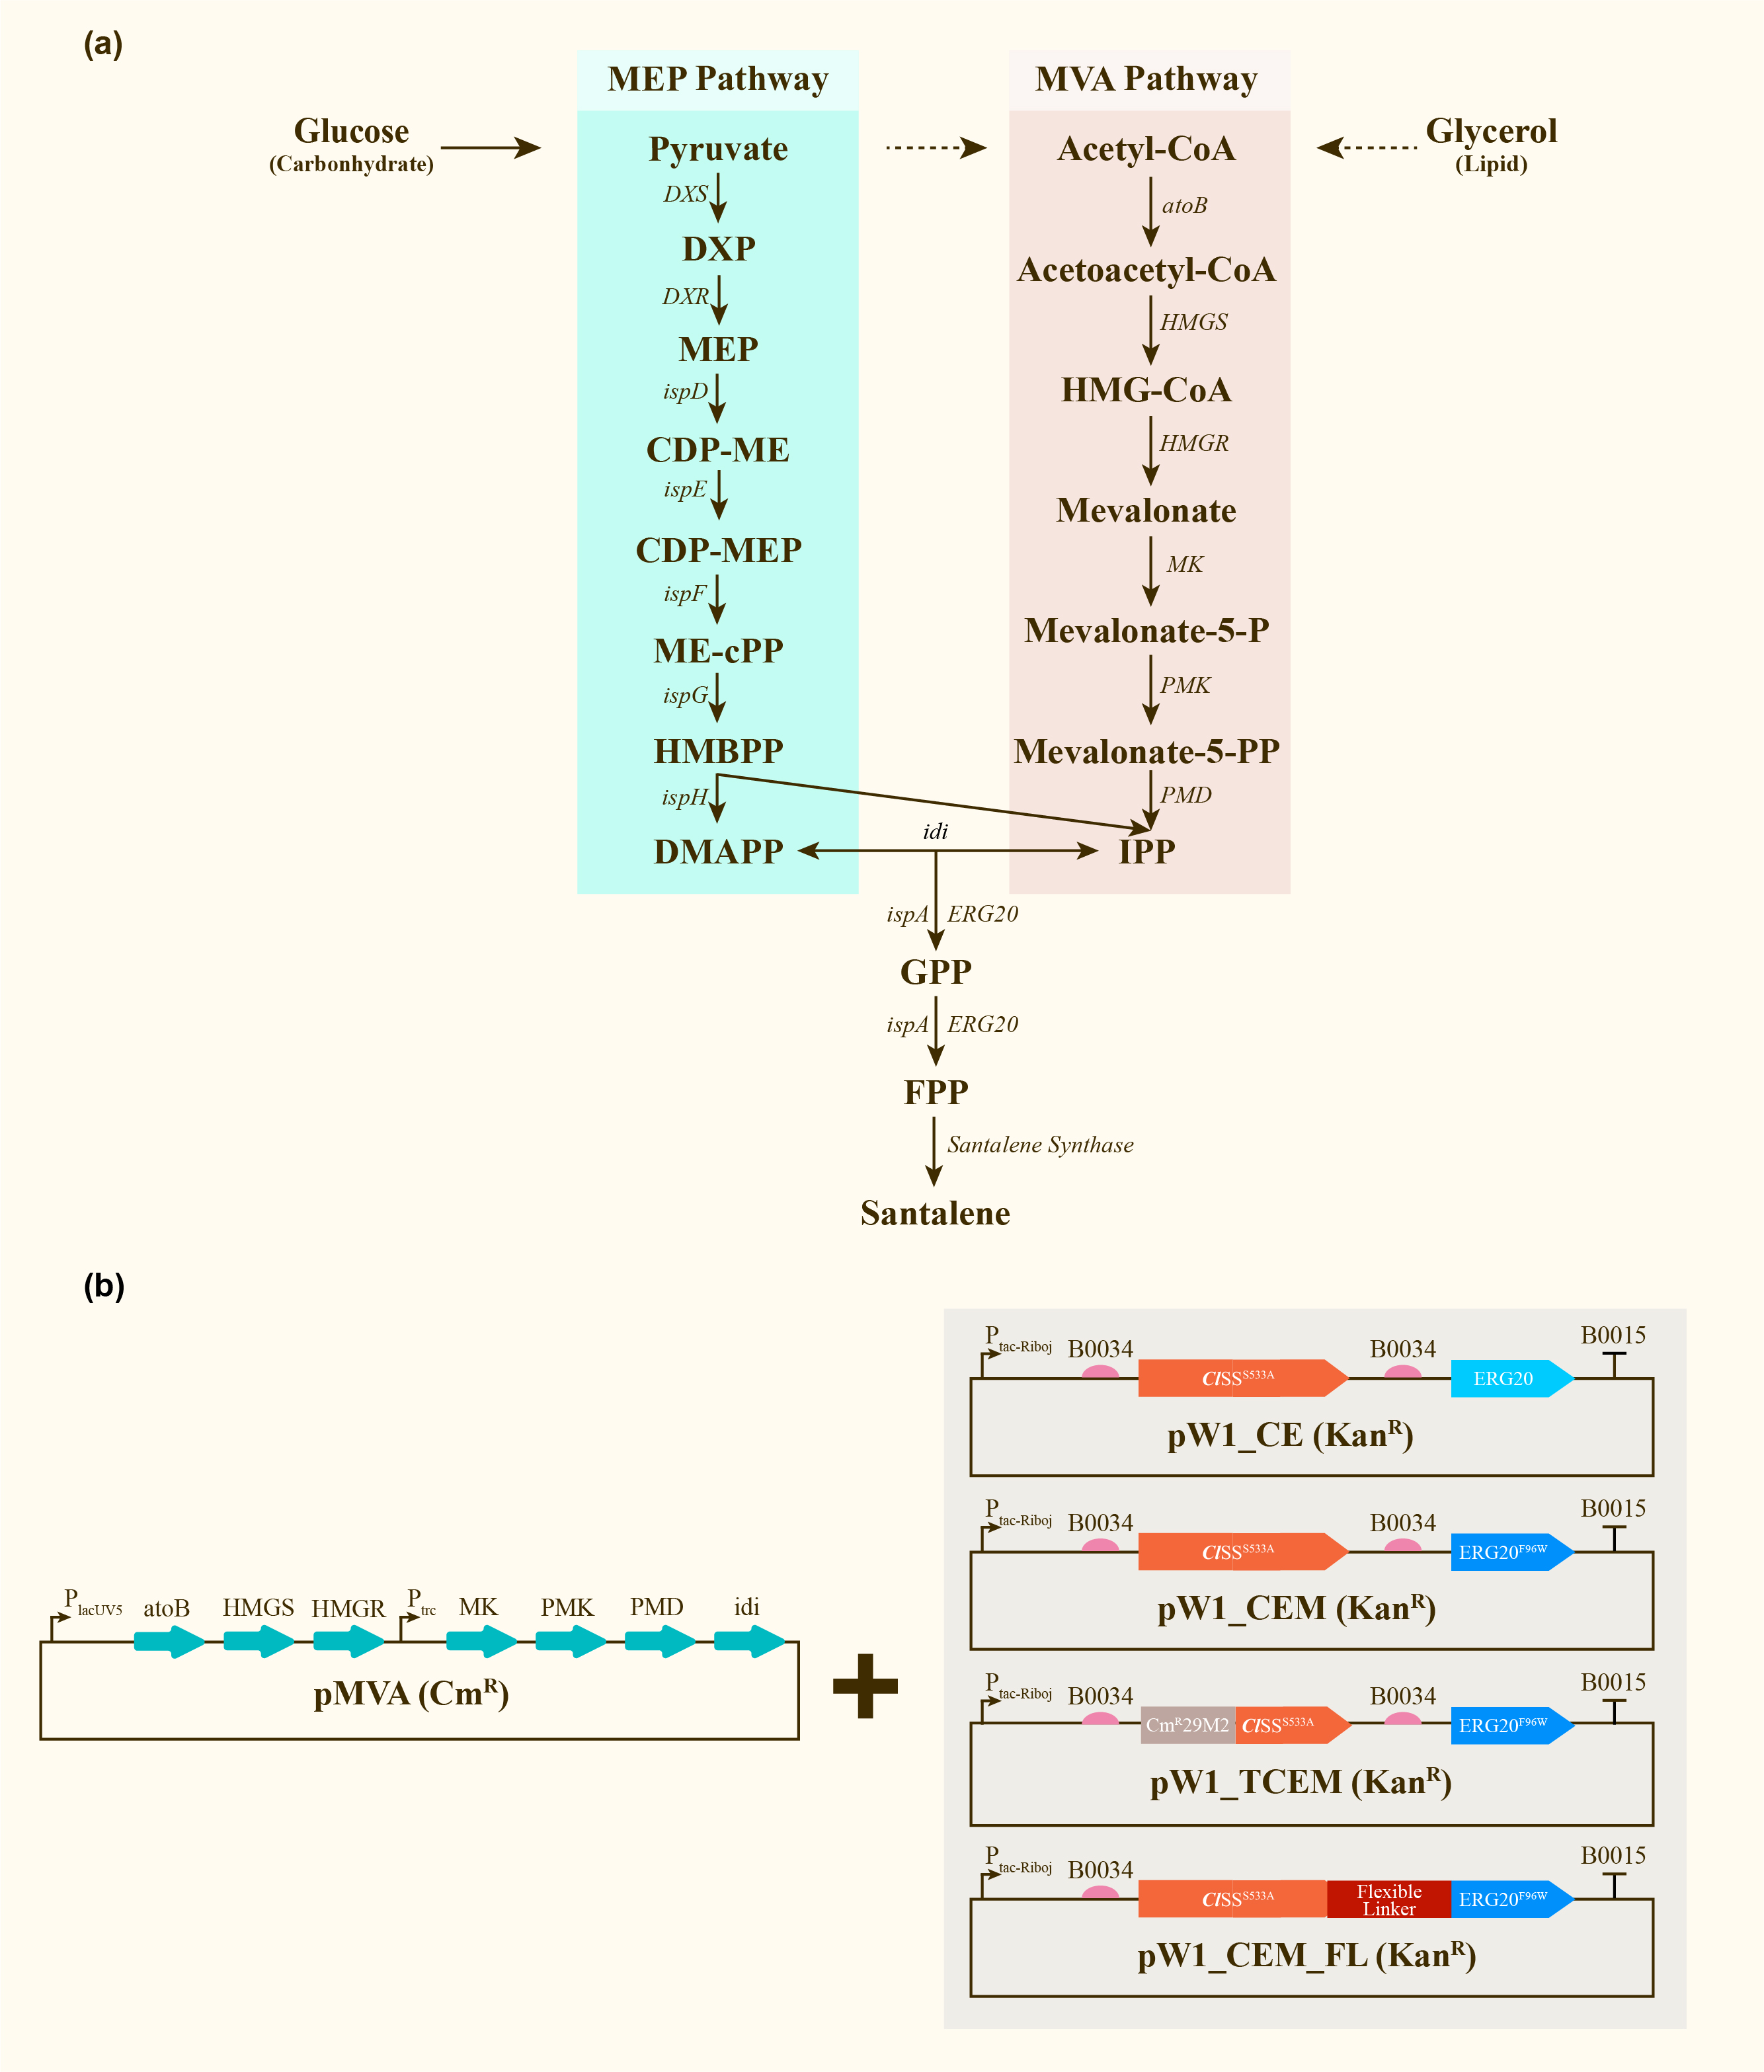
After engineering, E. coli could utilize both MEP pathway and MVA pathway for the universal precursors isopentenyl diphosphate (IPP) and dimethylallyl diphosphate (DMAPP), then synthesize santalene with the help of FPP Synthase (FPPS) and santalene synthase (SS). Except heterologously expressed MVA pathway and ERG20 of Saccharomyces cerevisiae and santalene synthase of Clausena lansium (ClSS), several modifications upon ERG20 or ClSS by amino acid mutation, binding to a hydrophillic tag and the construction of fusion protein were tested for the higher yield of santalene. Therefore, with the help of the co-transformation of pMVA plasmid with various pW1 plasmids, including pW1_CE, pW1_CEM, pW1_TCEM and pW1_CEM_FL, different strains like CE, CEM, TCEM, CEM_FL were successfully constructed (Figure 1). The complete pathway we designed for producing santalene in E. coli is illustrated in Figure 1.
Afterwards, the various engineering of E.coli DH5α ∆TnaA mentioned above were used for santalene production. After rapid centrifugation, the supernatant of dodecane was spiked with with 0.475 g/L a-humulene as an internal standard, and then injected into GC/MS for verification of α-santalene production. It turned out that all samples from four strains appeared a significant peak at the retention time of 26-27 min, and various peak area of different samples exhibited santalene production with differing levels, indicating the general success of E. coli engineering. It can be concluded that the E. coli strain CEM (with pW1_CEM plasmid) produces the maximal level of α-santalene compared to other strains (73.93 mg/L). Furthermore, our study elucidates that the mutation of 96th amino acid into tryptophan could increase the yield of α-santalene by about 20%, substantiating the prominent performance of ERG20F96W in enhancing the supply of FPP and α-santalene production in E. coli (Figure 2).
Contribution
Group: Valencia_UPV iGEM 2018
Author: Adrián Requena Gutiérrez, Carolina Ropero
Summary: We have adapted the part to be able to assemble transcriptional units with the Golden Gate method and we have done the characterization of this RBS.
Documentation:
BBa_K2656011 is the RBS B0034 standardized into the Golden Braid assembly method. It also includes the BioBrick equivalent scar in the 3' extreme, so the insertion of this supplementary bases ensure correct spacing for the CDS expression when assembled into a TU.
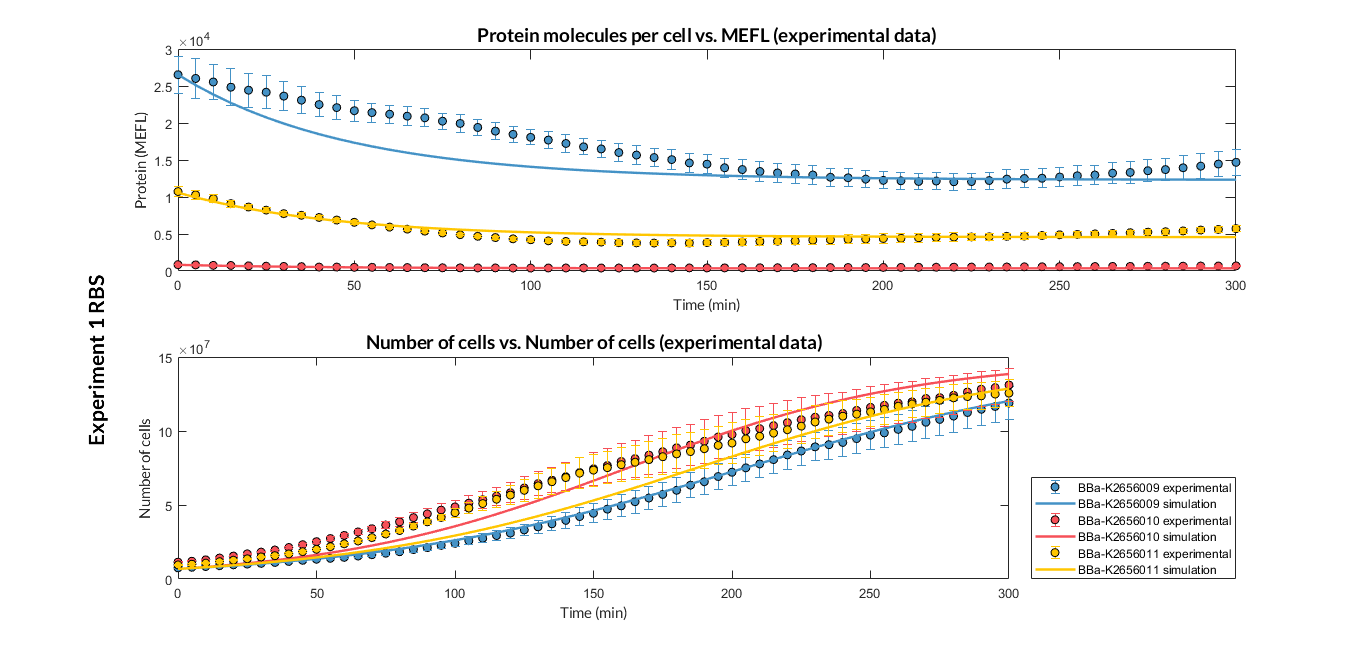
Characterization of the this part was performed with the transcriptional unit BBa_K2656101 , which was used in a comparative RBS expression experiment with composite parts BBa_K2656101 and BBa_K2656102. They all were assembled in a Golden Braid alpha1 plasmid using the same promoter, CDS and terminator.
By using this [http://2018.igem.org/Team:Valencia_UPV/Experiments#exp_protocol experimental protocol], we have obtained the parameters to valide our [http://2018.igem.org/Team:Valencia_UPV/Modeling#models constitutive model]and rationale choose its [http://2018.igem.org/Team:Valencia_UPV/Modeling#optimization optimization values] based on each RBS tested.
| Table 1. Optimized parameters from experimental data (BBa_K2656009 RBS). | |||
| Parameter | Value | ||
| Translation rate p | p = 0.082 min-1 | ||
| Dilution rate μ | μ = 0.01631 min-1 | ||
We have also calculated the relative force between the different RBS, taking BBa_K2656009 strong RBS as a reference. Likewise, a ratio between p parameters of the different RBS parts and p parameter of the reference RBS has been calculated.
| Table 2. BBa_K2656008 (GB BBa_B0032 RBS) relative strength and p ratio. | |||
| Parameter | Value | ||
| Relative strength | 0.371 | ||
| p parameter ratio (pRBS/pref) | 0.398 | ||
Shanghai_HS_United 2019's characterization
BBa_B0034 RBS (Elowitz 1999) -- defines RBS efficiency
All the construction is type IIS standard assembly. The different scar may effect the RBS efficiency for expression.
culture
Material: LB medium (2mL), pSB1K3-RBS-A-GFP, pSB1K3-RBS-B-GFP, pSB1K3-RBS-D-GFP, pSB1K3-GFP, pSB1K3-LacZ (BBa_K3136014, BBa_K3136015, BBa_K3136017, BBa_K3136007)
1. Take several test tubes and add to 2mL Kan medium respectively.
2. Take the cultured pSB1K3-GFP, pSB1K3-LacZ, pSB1K3-RBS-A-GFP, pSB1K3-RBS-B-GFP, pSB1K3-RBS-D-GFP, use the needle tip to take a small amount, and put it onto the shaking table.
3. Measure the fluorescence value and the OD value before and after centrifugation.
Results:
In this experiment, RBS (Elowitz 1999) -- defines RBS efficiency is same as pSB1K3-GFP.
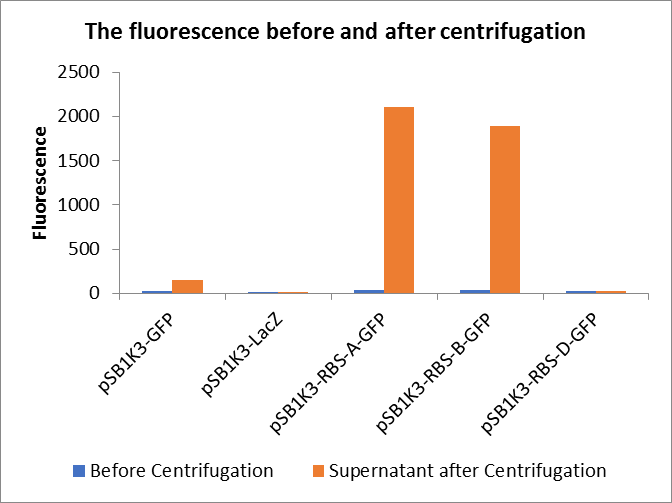
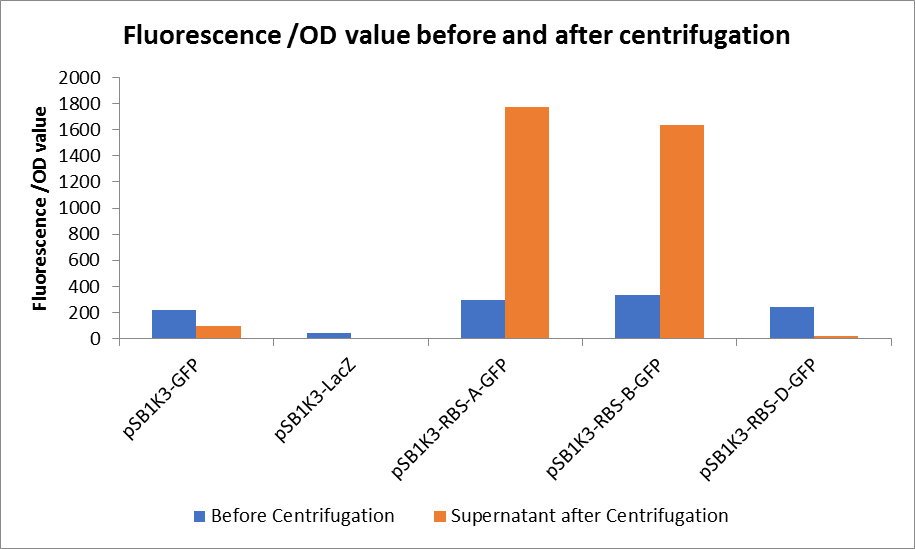
Through series of procedures, we have measured the fluorescence value before and after centrifugation (Fig1). The fluorescence of pSB1K3-GFP, pSB1K3-LacZ and pSB1K3-GFP, pSB1K3-LacZ have no differences whatever before or after centrifugation. But after centrifugation, the fluorescence of pSB1K3-RBS-A-GFP and pSB1K3-RBS-B-GFP all increased substantially.
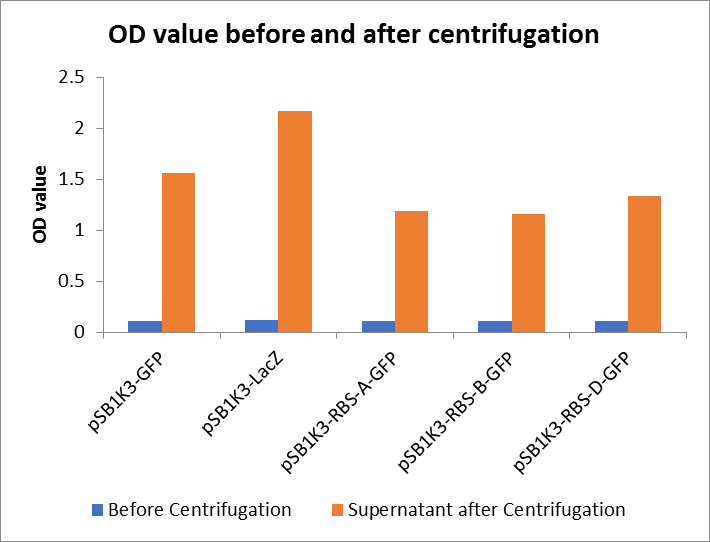
As shown in Fig2, the OD value of all samples before centrifugation was always lower than after centrifugation. Without the background interference of OD value, we can see the results clearly(Fig3). The fluorescence of pSB1K3-GFP hardly changed. It demonstrated that pSB1K3-GFP expressed a little. The intensity of RBS site in pSB1K3-GFP was weak.
(1) Protein Electrophoresis
Material: pSB1K3-LacZ, pSB1K3-GFP, pSB1K3-RBS-A-GFP, pSB1K3-RBS-B-GFP, pSB1K3-RBS-D-GFP, loading solution (6 μL), deionized water (1000 μL), marker solution, Coomassie brilliant blue dye. Note: pSB1K3-LacZ, pSB1K3-GFP, pSB1K3-RBS-A-GFP, pSB1K3-RBS-B-GFP, pSB1K3-RBS-D-GFP are used for collaboration with the team Shanghai_HS_United, and these plasmids were expression in strain E. coli DH10B.
1. Add 24 μL pSB1K3-LacZ, pSB1K3-GFP, pSB1K3-RBS-A-GFP, pSB1K3-RBS-B-GFP, pSB1K3-RBS-D-GFP, to 1.5mL tube respectively, and then add 6 μL loading.
2. Add 500 μL deionized water and centrifuge the tubes respectively.
3. Add another 500 μL deionized water, blow and suspend the solution.
4. Put the tubes 99℃ water for 15 minutes.
5. After heating, centrifuge the tubes for 5min.
6. Take and install the gel, add the electrophoresis buffer to the sample hole, and check if there is any leakage. Add marker, to the first and last sample holes, add pSB1K3-LacZ,pSB1K3-GFP and pSB1K3-RBS-A-GFP, pSB1K3-RBS-B-GFP, pSB1K3-RBS-D-GFP, MG1655 bpul, DH10B bpul, BL21(DE3) bpul to the other sample holes, respectively.
7. Connect the electrophoresis device to the power supply. Connect the positive electrode to the tank and the negative electrode to the slot for electrophoresis. The voltage is adjusted to 160V.
8. Turn off the power supply and disconnect the electrode until the bromophenol blue reaches the bottom of the release adhesive. Remove the glass sheet from the electrophoresis device and then remove the gel.
9. Soak the gel in Coomassie brilliant blue dye and dye it in a horizontal shaking bed for 15 min.
Observe the protein bands.
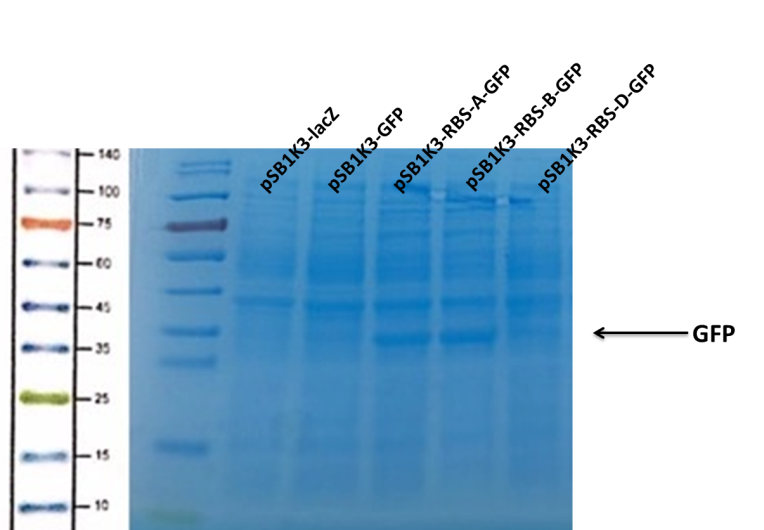
We can see that the lane of pSB1K3-GFP have no band(Fig4) at the location of GFP. It has been showed a low expression of pSB1K3-GFP and a feeble intensity of the RBS. Thus, the intensity of RBS was very important for the expression of proteins. The higher the intensity of RBS was, the more proteins expressed.
Sequence and Features
- 10COMPATIBLE WITH RFC[10]
- 12COMPATIBLE WITH RFC[12]
- 21COMPATIBLE WITH RFC[21]
- 23COMPATIBLE WITH RFC[23]
- 25COMPATIBLE WITH RFC[25]
- 1000COMPATIBLE WITH RFC[1000]
Functional Parameters: Austin_UTexas
Burden Imposed by this Part:

Burden is the percent reduction in the growth rate of E. coli cells transformed with a plasmid containing this BioBrick (± values are 95% confidence limits). This BioBrick did not exhibit a burden that was significantly greater than zero (i.e., it appears to have little to no impact on growth). Therefore, users can depend on this part to remain stable for many bacterial cell divisions and in large culture volumes. Refer to any one of the BBa_K3174002 - BBa_K3174007 pages for more information on the methods, an explanation of the sources of burden, and other conclusions from a large-scale measurement project conducted by the 2019 Austin_UTexas team.
This functional parameter was added by the 2020 Austin_UTexas team.
Improvement from iGEM 2021 SZPT-China
Biology
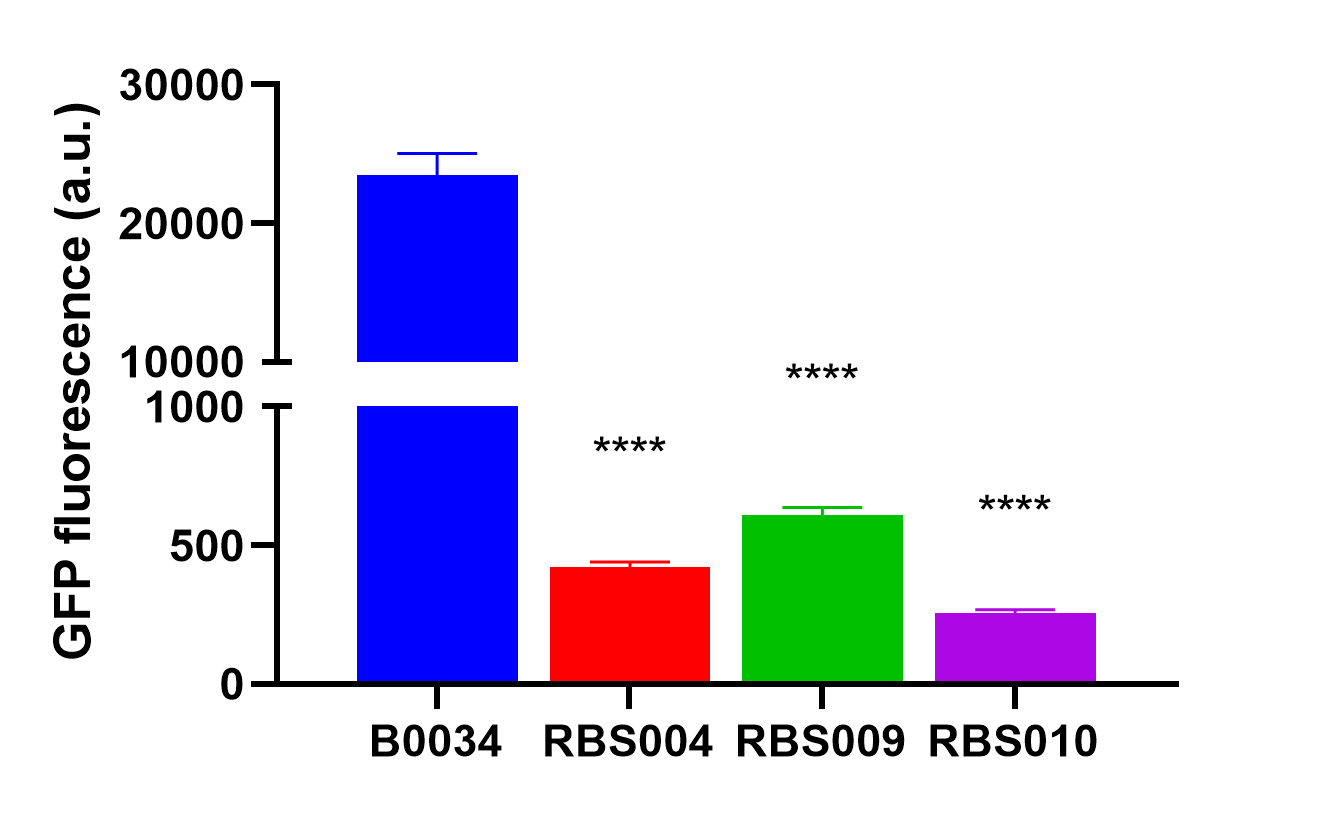
Fluorescence quantification was performed using the B0034 construct J23100-B0034-sfGFP-rrnB T1 (BBa_K3740058).
Usage
by the abovemetioned RBS004 (BBa_K3740018), RBS009 (BBa_K374008), and RBS010 (BBa_K3740010) to obtain an array of resultant plasmids as listed in Table 1. These plasmids were then transformed into E. coli DH5α, we quantified the fluorescence intensity when the optical absorbance of bacterial culture at 600nm was around 0.2. And were analyzed with the fluorescent proteins expressed by RBS004, RBS009, and RBS010, respectively.
Characterization
The average fluorescence intensity of sfGFP induced by B0034.
References
[1] Zhang H M , Chen S , Shi H , et al. Measurements of Gene Expression at Steady State Improve the Predictability of Part Assembly[J]. Acs Synthetic Biology, 2016, 5(3):269.

