
Part:BBa_K1847008
lldRO1-J23117-lldRO2
Collection of promoters regulated by LldR.
Sequence and Features
- 10COMPATIBLE WITH RFC[10]
- 12INCOMPATIBLE WITH RFC[12]Illegal NheI site found at 78
Illegal NheI site found at 101 - 21COMPATIBLE WITH RFC[21]
- 23COMPATIBLE WITH RFC[23]
- 25COMPATIBLE WITH RFC[25]
- 1000COMPATIBLE WITH RFC[1000]
Usage and Biology

The natural promoter of LldR (Part:BBa_K822000) consists of two operators (O1 and O2) and a promoter which is intercalated between the operators. It regulates the expression of the lldPRD operon, and it is involved in L-lactate metabolism. This promoter is repressed by a dimer of LldR, possibly by forming a DNA loop that does not allow the RNA polymerase to bind to the promoter. LldR can also have a function as an activator [1]. The repression of the promoter can be removed by lactate.
Characterization of the promoter
We wanted to know how the promoter would respond to the lactate presence and how important is the architecture of the promoter in this response. For this regard, we built several promoters. Part:BBa_K1847002, Part:BBa_K1847003, Part:BBa_K1847004, Part:BBa_K1847005, Part:BBa_K1847006, Part:BBa_K1847007, Part:BBa_K1847008, and Part:BBa_K1847009.
Genetic design for characterization with LldR
To test our promoter we designed a plasmid containing the promoter with sfGFP in a medium copy plasmid pSEVA261 and transformed it into Escherichia coli TOP10. Then, we added a second plasmid containing lldR with a medium strong promoter (Part:BBa_J23118) and a strong RBS (Part:BBa_B0034) in pSEVA371 backbone. According to literature [1], LldR will repress the promoter and by the addition of lactate the production of GFP will start, as the repressor will be removed.
Genetic design for characterization with LldP-LldP
The second step for our characterization was to add an L-lactate permease (LldP), which despite its name is an active transporter of L-lactate, D-lactate and glycolate. To understand the effect of LldP (L-lactatep permease) in our system, we tried the following conditions:
- Medium copy plasmid with the promoter and sfGFP+ J23114-B0032-lldP-lldR (LldP and LldR are under the control of the same weak promoter) in low copy number plasmid
- Medium copy plasmid with the promoter and sfGFP + J23118-B0032-lldP-lldR (LldP and LldR are under the control of the same medium promoter) in low copy number plasmid
Characterization in a different medium
DMEM and RPMI mediums for mammalian cells where used to characterize this promoter. Two conditions were tested:
- Plasmid with the promoter and sfGFP + J23118-B0032-lldR
- Plasmid with the promoter and sfGFP+ J23118-B0034-lldP-lldR
Plate reader
E. coli TOP10 strains were grown overnight in Lysogeny Broth (LB) containing kanamycin (50 µg/mL) and chloramphenicol (12.5 µg/mL) at 37°C and 200 rpm. Cultures were diluted 1:50 in fresh LB with the corresponding antibiotic and transferred to a 96-well plate (200 µL/well). Cultures were grown for 90 min to arrive to exponential phase and then different concentrations of lactate were added. Samples were always made in triplicates and a blank of LB with the corresponding lactate concentration was done. During 7 h the absorbance at OD600 and fluorescence (excitation 488 nm and emission 530 nm) were measured with intervals of 7 min. The plate was always kept at 37°C in a Tecan Infinite M200 Pro Plate Reader. We calculated dose-response curves from the exponential phase of the bacteria after normalizing fluorescence by optical density.
Modeling
Each experimental data set was fitted to a Hill function using the Least Absolute Residual method (Fitting Toolbox in MatLab).

Where:
- al: leakiness in µM/min
- mu: constant in µM/min
- KM: half-maximum effective concentration (a representation of sensitivity) in µM
- n: Hill coefficient (a representation of cooperativity), unitless
| J23118-B0034-lldR | J23118-B0034-lldP-lldR | J23114-B0032-lldP-lldR | |
|---|---|---|---|
| Coefficient values | KM=1075 (889.5, 1261) | KM=1751 (918.5, 2584) | KM=337.7 (152.4, 522.9) |
| al = 479.3 (-142.2, 1101) | al = 550 (-1635, 2735) | al = 3444 (2571, 4317) | |
| mu = 7311 (6583, 8039) | mu = 1.318e+04 (1.03e+04, 1.607e+04) | mu = 4886 (3817, 5954) | |
| n1 = 1.326 (1.063, 1.588) | n1 = 0.9388 (0.5614, 1.316) | n1 = 1.09 (0.531, 1.649) | |
| Goodness to fit | sse: 4.2545e+07 | sse: 6.4285e+08 | sse: 2.7027e+08 |
| rsquare: 0.9964 | rsquare: 0.9879 | rsquare: 0.9743 | |
| fe: 7 | dfe: 7 | dfe: 7 | |
| adjrsquare: 0.9949 | adjrsquare: 0.9828 | adjrsquare: 0.9633 | |
| rmse: 2.4653e+03 | rmse: 9.5831e+03 | rmse: 6.2137e+03 |

As can be seen in the picture above, when PlldR GFP is alone, the fluorescence levels do not vary with lactate concentration. However, if PlldR GFP is expressed in a system with constitutive expression of LldR, at low concentrations of lactate there is repression of the promoter, while at high concentrations there is activation. Activation is higher when there is constitutive expression of LldP-LldR. KM is shifted regarding the wild-type promoter, which makes this promoter more sensitive.
The promoter has higher ON/OFF ratios than the wild-type promoter (see Table 1). Its KM is higher than the one from the wild-type promoter, meaning that is has lower affinity for the substrate.
This promoter is one from our designed and tested synthetic promoters based on the wild-type PlldR. In the following table, one can see the ON/OFF ratios and the KM of the wild-type promoter and the three more prominent members of the library.
Table 1: ON/OFF ratio
| LldR | Additional LldP | |||
|---|---|---|---|---|
| J23118-B0034-lldR | J23118-B0034-lldP-lldR | J23114-B0032-lldP-lldR | ||
| Part:BBa_K822000 (wild-type) | 10.35 | 8.04 | 1.16 | |
| Part:BBa_K1847008 | 15.26 | 23.96 | 1.42 | Increasing promoter strength |
| Part:BBa_K1847009 | 2.5 | 24.34 | 0.96 | |
| Part:BBa_K1847007 | 2.15 | 3.85 | 1.29 | |
Table 2: KM (µM)
| J23118-B0034-lldR | J23118-B0034-lldP-lldR | J23114-B0032-lldP-lldR | |
|---|---|---|---|
| Part:BBa_K822000 (wild-type) | 955 | 1930 | 720.2 |
| Part:BBa_K1847008 | 1075 | 1751 | 337.5 |
| Part:BBa_K1847009 | 977.5 | 2361 | 459.8 |
| Part:BBa_K1847007 | 697.7 | 1977 | 1337 |
The graph below shows the behavior of our promoter in two mediums usually used for mammalian cell cultures. The promoter does not respond to lactate concentrations in DMEM while in RPMI it shows a behavior similar to the one in LB.

| RPMI | DMEM | |||
|---|---|---|---|---|
| J23118-B0034-lldR | J23118-B0034-lldP-lldR | J23118-B0034-lldR | J23118-B0034-lldP-lldR | |
| Coefficient values | K=3.389e+04 (-1.7e+05, 2.378e+05) | K=173.6 (15.19, 331.9) | K=5e+04 (-2.563e+05, 3.563e+05) | K = 448.4 (52.45, 844.3) |
| al = 136.2 (130.8, 141.7) | al = 253 (-584.6, 1091) | al = 230.3 (202.7, 258) | al = 314.1 (138.6, 489.5) | |
| mu = 92.3 (-659.7, 844.3) | mu = 1735 (863.1, 2607) | mu = 253.2 (-1098, 1605) | mu = 1085 (907.3, 1263) | |
| n1 = 3.165 (-13.87, 20.2) | n1 = 1.7 (0.05844, 3.341) | n1 = 1.5 (fixed at bound) | n1 = 0.7 (fixed at bound) | |
| Goodness to fit | sse: 939.5028 | sse: 1.6713e+07 | sse: 1.8073e+05 | sse: 5.1609e+06 |
| rsquare: 0.9640 | rsquare: 0.8846 | rsquare: 0.7522 | rsquare: 0.9608 | |
| fe: 7 | dfe: 7 | dfe: 8 | dfe: 8 | |
| adjrsquare: 0.9485 | adjrsquare: 0.8351 | adjrsquare: 0.6902 | adjrsquare: 0.9510 | |
| rmse: 11.5851 | rmse: 1.5452e+03 | rmse: 150.3044 | rmse: 803.1891 | |
Characterization and improvement of lactate sensors using lldRO1-J23117-lldRO2 promoter in D-Alanine knock-out auxotrophic bacteria
Group: Team NUS_Singapore 2016
Authors: Keshiniy Madivannan, Janice Darikho and Nguyen Hoang Diem Phuong
Introduction
Due to their ability to deregulate normal cellular energetics, cancer cells are found to undergo aerobic glycolysis followed by lactic acid fermentation in the cytosol, resulting in the elevated production and accumulation of L-lactate in the surrounding environment [2][3][4]. The RIOT sensor collection was designed to detect increased level of L-lactate produced by tumor cells in the microenvironment. A lactate-sensitive promoter obtained from 2015 ETH_Zurich team, lldRO1-J23117-lldRO2 (Part:BBa_K1847008) was used as starting material. They characterized this part by ligating it to a strong RBS Part:BBa_B0034 and sfGFP. This combination was quite leaky which resulted in the high expression of the GFP reporter in the absence of lactate (Figure 3).
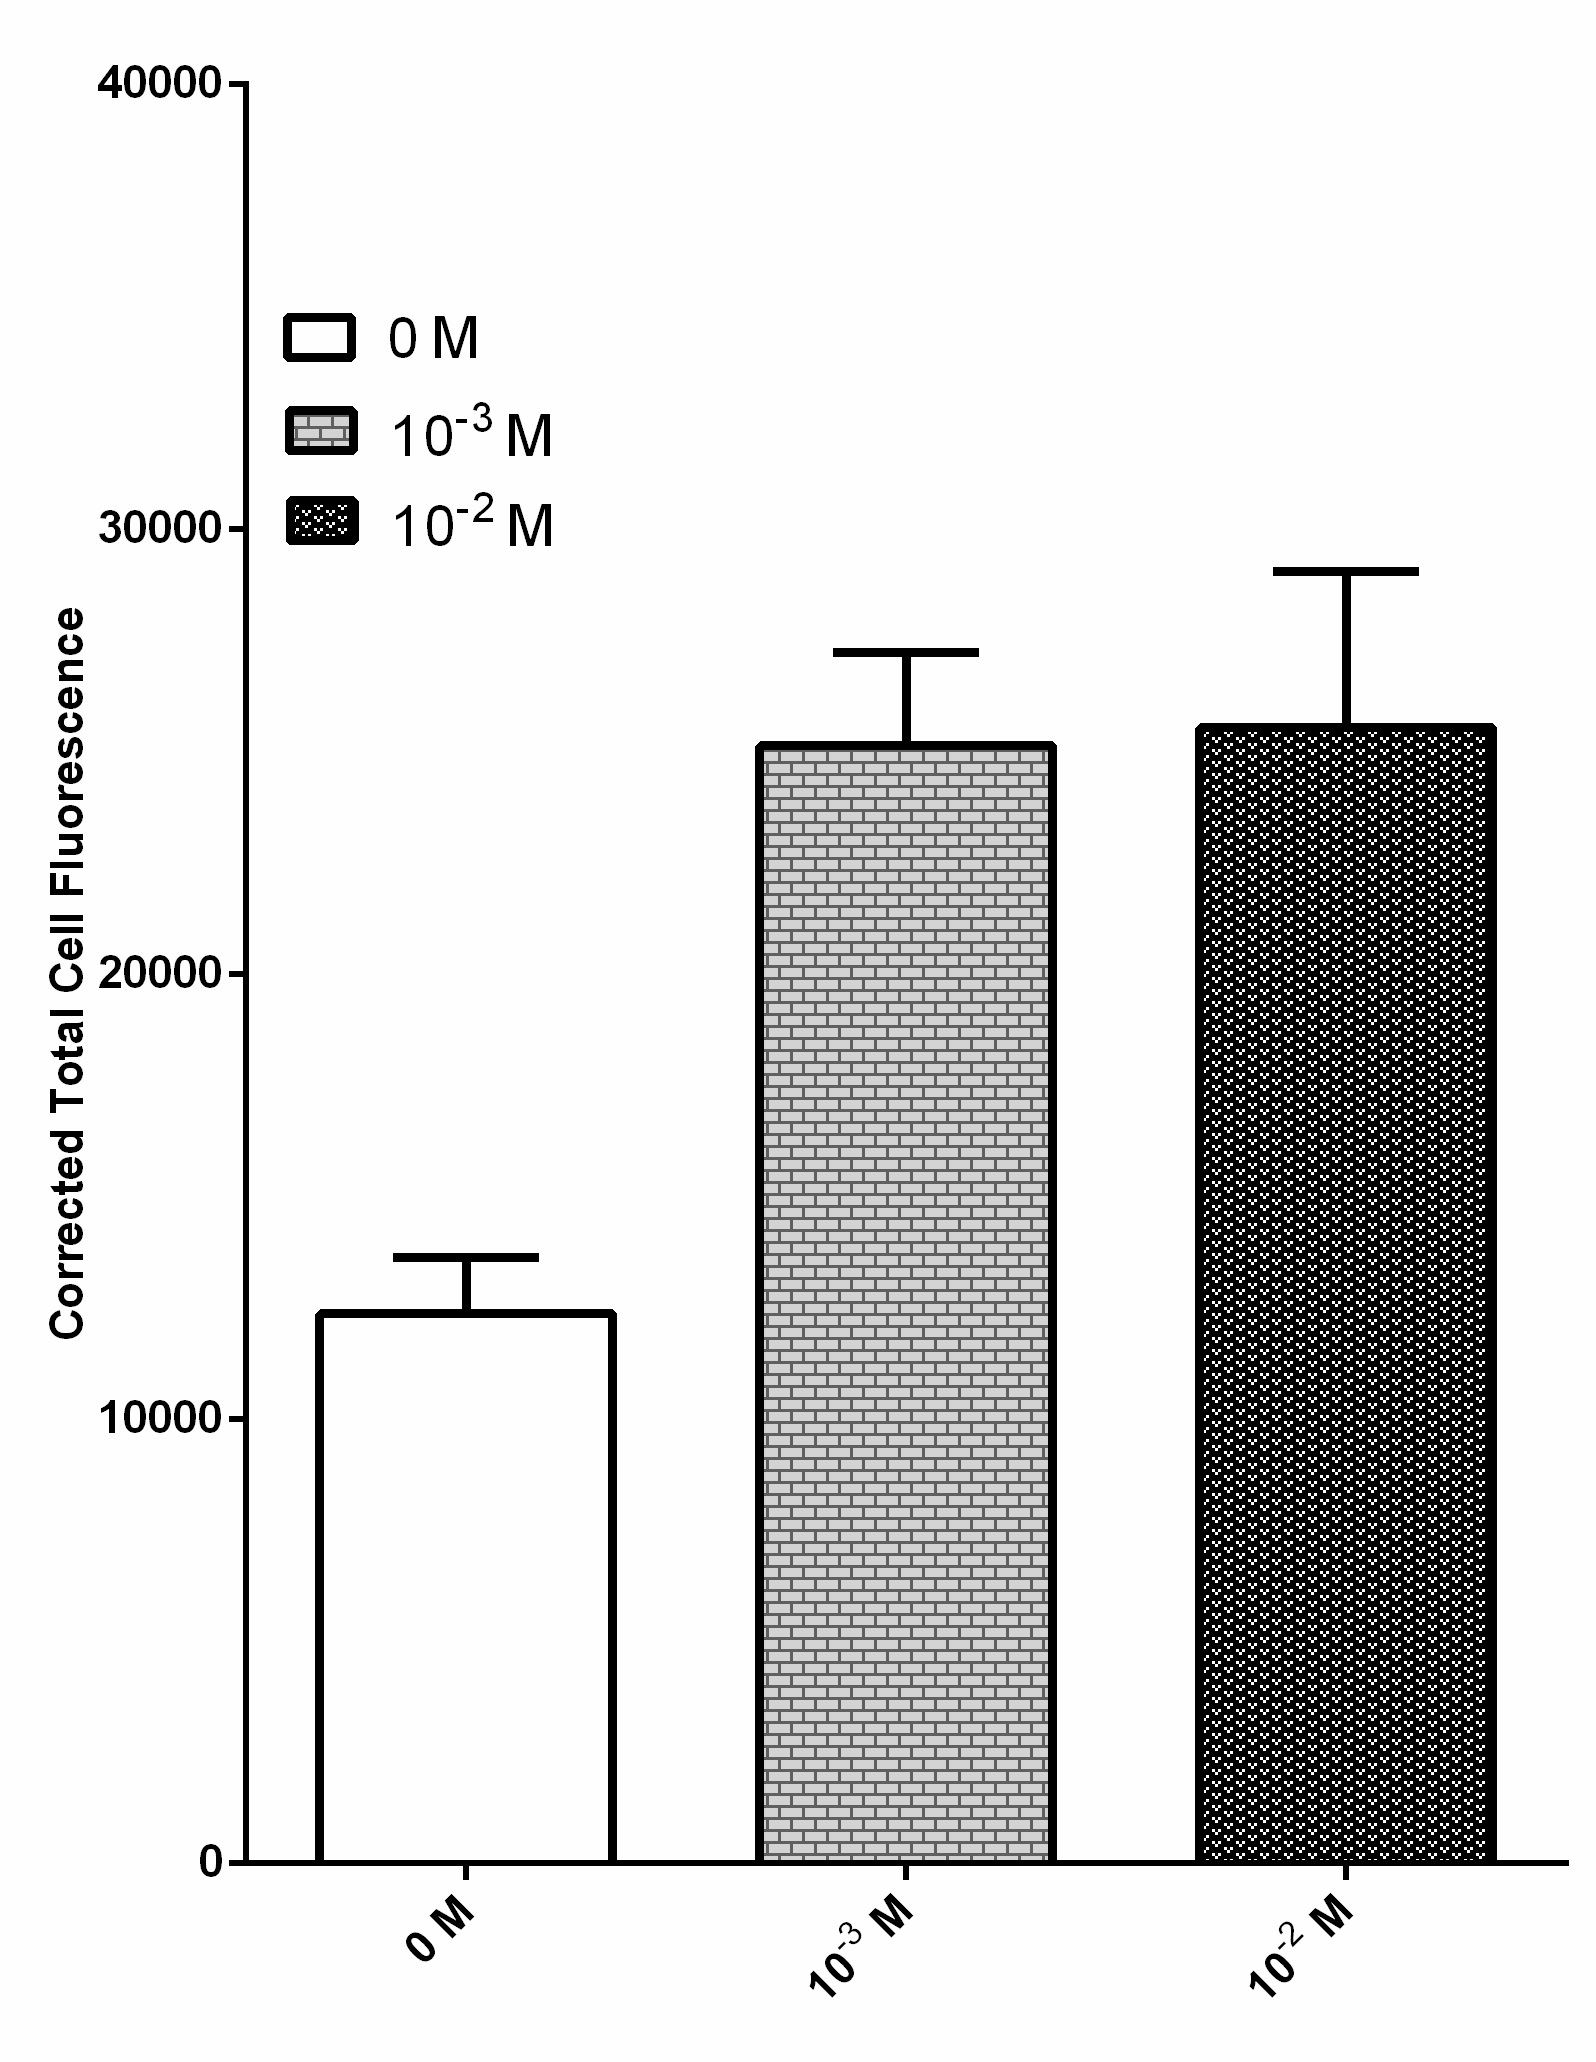
Overnight culture of bacteria transformed with this sensor was diluted and incubated with various lactate concentration including 0 M, 10-3 M and 10-2 M. Fluorescent images of each condition were processed by ImageJ software to obtain the corrected total cell fluorescence. n = 40 and the error bars stands for SEM
Our new designed lactate sensing plasmid has been engineered to minimise basal expression of reporter gene without lactate. We minimise the basal expression of our reporter by linking different strength RBS parts with lldRO1-J23117-lldRO2 promoter obtained from 2015 ETH_Zurich team (Figure 4). Our engineered sensors have little or no basal expression and significant increase in reporter output (either by GFP or Alanine Racemase, ALR expression) in the presence of lactate. Our strategy allows strict amount of reporter expression, thus increasing sensitivity of lactate detection, and minimise false positive results. ALR is an enzyme responsible for the synthesis of D-alanine, an essential amino acid required for bacterial survival [5]. Transformed bacteria expressing our ideal sensor are expected to survive in small numbers in mild lactate concentration from the microenvironment. Once the bacteria are exposed to the increased lactate concentration in the tumor microenvironment, these bacteria will start to grow rapidly and this will significantly enhance the detection of tumor or delivery of biomolecules into tumor cells.

RIOT sensors 1 (Part:BBa_K1897019) and 7 (Part:BBa_K1897021) contain the lldRO1-J23117-lldRO2 promoter (Part:BBa_K1847008), a coding sequence of Alanine Racemase and a t0 lambda terminator.However, RIOT sensor 1 contains a strong RBS (Part:BBa_B0034) while RIOT sensor 7 contains a weak RBS (Part:BBa_B0033) which has efficiency of about 1% relative to the strong RBS.
Methods
We transformed E. coli Nissle ∆alr, a D-alanine auxotrophic mutant bacteria [6] with our RIOT sensors plasmid which express ALR reporter in the presence of elevated L-lactate. Without the expression of ALR in this knockout bacteria, the bacteria will not survive. However, in the presence of L-lactate, the RIOT sensor is able to express the reporter gene, ALR, thus increasing growth rate of the mutant bacteria. Therefore, the performance of RIOT sensors were assessed by the growth rate of transformed bacteria over a range of lactate concentration in M9 minimal media via natural logarithm (LN) of OD600.
Results
D-alanine knockout auxotrophic mutant bacteria were transformed with plasmids containing ALR gene under the control of RIOT sensor 1 or 7 which are lactate sensitive promoters (Figure 4). The overnight culture were spun down, washed and resuspended with M9 minimal media without D-alanine supplement. Then, samples were subjected to different treatments as shown below (Figure 5).
- M9 without D-alanine supplement
- M9 with 50 µg/ml D-alanine supplement
- M9 with addition of lactate concentration range of 10-4 to 10-2 M.
Figure 5A shows that E. coli Nissle∆alr expressing RIOT sensor 1 were able to grow and survive even without the addition of lactate. The growth rate for the transformed bacteria were similar regardless of the lactate concentration. On the contrary, E. coli Nissle∆alr transformed with RIOT sensor 7 showed different growth rate corresponding to the changes in lactate concentration (Figure 5B).

The growth rate of the mutant bacteria expressing the various RIOT sensor , with or without lactate were measured by taking the absorbance of OD600 nm at various timepoints for a total of 6 hr . We use the natural log of the OD600nm reading to reflect the growth rate of bacteria expressing different RIOT sensor with different lactate concentration.
(A) RIOT sensor 1: p70-34-ALR-Terminator (Part:BBa_K1897019) consists of lldRO1-J23117-lldRO2 promoter ligated to a strong RBS (Part:BBa_B0034) and Alanine Racemase (ALR). N=1
(B) RIOT sensor 7: p70-33-ALR-Terminator (Part:BBa_K1897021) consists of lldRO1-J23117-lldRO2 promoter ligated to a weak RBS (Part:BBa_B0033) and ALR. N=3 and the error bars stand for SEM.
We used linear regression analysis to fit our data of bacterial growth rate using four data points of LN (OD600) values from 90 to 180 min of each sensor. This is because the growth rate of each constructs appeared to deviate from each other at the 90-minute time point (Figure 5).
Table 3: Comparisons of bacteria growth rate between RIOT sensor 1 and 7
RIOT sensor 1: p70-34-ALR-Terminator (Part:BBa_K1897019) consists of lldRO1-J23117-lldRO2 promoter ligated to Alanine Racemase ( N=1 ± SEM).
RIOT sensor 7:p70-33-ALR-Terminator (Part:BBa_K1897021) consists of lldRO1-J23117-lldRO2 promoter ligated to a weak RBS (Part:BBa_B0033) and ALR (N=3 ± SEM).
Doubling time – LN (2) / Growth rate
| RIOT sensor No. | Lactate concentration (M) | Growth rate (min-1) | Doubling time (min) | R square |
|---|---|---|---|---|
| 1: p70-34-ALR-Terminator | 10-4 | 0.00935 ± 0.000594 | 74.3 ± 4.73 | 0.992 |
| 10-3 | 0.0107 ± 0.000505 | 64.9 ± 3.06 | 0.996 | |
| 10-2 | 0.00659 ± 0.000173 | 105.2 ± 2.76 | 0.999 | |
| 7: p70-33-ALR-Terminator | 10-4 | No growth was observed | ||
| 10-3 | 0.00756 ± 0.000789 | 92.7 ± 9.67 | 0.979 | |
| 10-2 | 0.00880 ± 0.000863 | 79.5 ± 7.80 | 0.981 | |
Discussion and Conclusion
The rate and the level of reporter gene expression of each individual sensor plasmid at each condition was analysed by the growth rate of transformed bacteria using linear regression analysis. The slope of each fitted linear line represents the growth rate of bacteria. Our results shown in Figure 5 suggested that RIOT sensor 1, p70-34-ALR-Terminator (Part:BBa_K1897019) exhibited high leakiness in reporter gene expression, regardless of the lactate concentration tested. Moreover, Table 3 showed that transformed bacteria with sensor 1 under different treatments appeared to have similar initial growth rate compared to those were grown in the media containing D-alanine supplement (0.008 – 0.009 min-1, p-value < 0.01). This is because the amount of ALR expressed at the lowest lactate concentration is likely to be sufficient to convert enough L-alanine into D-alanine, which help the bacteria to survive. The insignificant differences in growth rate of bacteria treated with various lactate concentrations indicated that RIOT sensor using lldRO1-J23117-lldRO2 promoter ligated with strong RBS designed by ETH_Zurich 2015 was not sensitive enough to detect small changes in lactate concentration in the tumour microenvironment.
In contrast, our RIOT sensor 7, p70-33-ALR-Terminator (Part:BBa_K1897021) exhibited very minimal leakiness without the presence of lactate. The transformed bacteria were unable to grow in the absence or at low lactate concentration (10-4 M). Addition of lactate at high concentration (10-3 and 10-2 M) rescued the transformed bacteria grown in media without D-alanine. According to Table 3, the growth rate of bacteria transformed with sensor 7 grown in lactate concentration of 10-4 M was not significantly different from zero. RIOT sensor 7 also showed an increase in growth rate or a decrease in doubling time from 92.7 to 79.5 minutes when lactate concentration increased from 10-3 M to 10-2 M.
In conclusion, we have characterized the output of lldRO1-J23117-lldRO2 (Part:BBa_K1847008 from ETH_Zurich 2015) in a new chassis which was E. coli Nissle ∆alr, a D-alanine auxotrophic mutant bacteria to detect lactate in tumour microenvironment. The characterization result of RIOT sensor 7 shows that we have successfully minimized the leakiness and enhance the sensitivity to lactate of sensor using the lldRO1-J23117-lldRO2 promoter from ETH_Zurich without adding LldP and LldR. Bacteria transformed with sensor 7 are expected to be able to survive in small numbers in mild lactate concentration of the blood and once reaching tumour site, their growth will be increased by the high lactate concentration there, which will enhance the detection signal or the delivery of biomolecules into tumour cells.
References
- J Bacteriol. 2008 Apr; 190(8): 2997–3005.
- Alfarouk, K.O., Verduzco, D., Rauch, C., Muddathir, A.K., Bashir, A.H., Elhassan, G.O., Ibrahim, M.E., Orozco, J.D.P., Cardone, R.A., Reshkin, S.J. and Harguindey, S. (2015). Glycolysis, tumor metabolism, cancer growth and dissemination. A new pH-based etiopathogenic perspective and therapeutic approach to an old cancer question. Oncoscience, 2(4), p.317.
- Chen, Z., Lu, W., Garcia-Prieto, C., & Huang, P. (2007). The Warburg effect and its cancer therapeutic implications. Journal of bioenergetics and biomembranes, 39(3), 267-274.
- Vander Heiden, M. G., Cantley, L. C., & Thompson, C. B. (2009). Understanding the Warburg effect: the metabolic requirements of cell proliferation. Science, 324(5930), 1029-1033.
- Walsh, C. T. (1989). Enzymes in the D-alanine branch of bacterial cell wall peptidoglycan assembly. Journal of biological chemistry, 264(5), 2393-2396.
- In Young Hwang, Elvin Koh, Adison Wong, John C. March, William E. Bentley, Yung Seng Lee and Matthew Wook Chang (2016). Engineered probiotic microbes eliminate and prevent pathogen infection in the mammalian gut. Manuscript submitted.
Characterization of the Lactate inducible promoter in BL21(DE3) with sfGFP as the reporter
Group: IISER_Tirupati 2019
Authors: Amartya Pal, Mrugank Dake, Megha Maria Jacob
The regulatory element lldR binds to the lldRO1 and lldRO2 (the operator regions) and inhibit transcription. J23117 is a promoter intercalated between the operators. lldR dimer represses the transcription possibly by forming a DNA loop which doesn’t allow the RNA polymerase to bind the promoter. Upon binding of L-Lactate to LldR, however, this transcriptional suppression is lost and instead lldR complex with L-Lactate remains bound to LldRO1 acting as a transcriptional activator.
Characterization of the promoter
We wanted to recheck how this part would respond to different lactate concentration. To efficiently produce our reporter protein (sfGFP), that will later be replaced by YebF-IL12, we have used RBS of different strengths. (Part:BBa_K3110040, Part:BBa_K3110041, Part:BBa_K3110042)
But due to time constraint and consecutive failures, we could only characterize the strong RBS.
Genetic design for characterization
To test this part we have designed two plasmids:
- O1-P-O2 -RBS-sfGFP-terminator in a medium copy plasmid pSB1C3
- P-RBS-sfGFP-terminator in another pSB1C3 (Same Promoter without the operator regions) - as a control
So, in the presence of lactate, L-Lactate should bind to LldR and enhance the expression of sfGFP where we have O1PO2 upstream of sfGfP.
Experimental Procedure
- We chose BL21(DE3) as our chassis and transformed both the plasmids in BL21(DE3) separately. Cultured them in M9-Glycerol(with Chloramphenicol of concentration 34 ng/ul) for 14-16 hrs at 37C, 200 r.p.m.(Primary Culture). After that, we put the secondary culture of both at an OD of O.1 in M9-Glycerol medium (With Chloramphenicol concentration- 34 ng/ul) and kept at 37C for 5-6 hours.
- Once the OD of the secondary culture reached 0.4, we transferred the culture to 96 well microtiterplate with appropriate blank (M9 + required lactate concentration) after induction with different concentrations of lactate (0 mM, 0.01 mM, 0.03 mM, 0.06 mM, 0.1 mM, 0.3 mM, 0.6 mM, 1 mM, 3 mM, 6 mM, 10 mM, 13 mM, 16 mM, 20 mM) and kept in plate reader. Our assays were done in technical triplicates and repeated thrice with different biological samples.
- We used the Gen5 software to program the plate reader. The cultures were kept at 37degC with orbital shaking at 282cpm for 27:30 mins. This was followed by reading OD (at 600 nm) and then fluorescence at 480 excitation and 510 emission with 70 gain. This was iterated over cycles set for 8hrs.
- Analysed the data after completion of the program.
Results
- Corrected Fluorescence = Fluorescence (Sample) - Fluorescence (Blank)
- Corrected OD = OD (Sample) - OD (Blank)
- Normalized Fluorescence = Corrected Fluorescence / Corrected OD
Plotted the graph of Normalized Fluorescence with time and also against different lactate concentrations at 480 min time point. Each experimental data set was fitted to a Hill function (using origin).

As can be seen in the graph, when P-RBS-sfGFP is there, the fluorescence level is not varying much with an increase in L-lactate concentration. But, in the case of O1PO2-RBS-sfGFP, fluorescence level has increased significantly. The absence of operator sites in the control sequence leads to no response of the construct towards changing concentrations of lactate. However, in our test sample, in the presence of lactate, lactate binds to LldR and acts as a transcriptional activator leading to a sigmoidal expression of sfGFP. As the lactate concentration is increasing, the amount of free LldR(Repressor) inside the cell is decreasing as well as the LldR bound to Lactate (activator) is increasing - so, the rate of sfGFP expression is also increasing with higher Lactate (up to a certain concentration). After lldR is saturated with L-Lactate, the sfGFP expression becomes steady. The lactate concentration of around 20mM seems to be toxic to the bacteria, hence causing slightly lower sfGFP expression. This is contradictory to the literature which mentions lactate concentration than 100mM is toxic and hence further validation for this point is required. The construct gives a clear sigmoidal pattern for detection of lactate with a threshold of around 0.45 mM. This is a bad threshold since the construct might fail to distinguish Cancerous vs Non-cancerous microenvironments, both of which have lactate concentration than 0.45mM. Hence we have intended to use this construct in combination with our library of four gene constructs: lldD, lldP+lldD, lldR+lldD and lldP+lldR+lldD under promoter and RBS of different strengths.
We hypothesized that, if we can increase the amount of Lactate Dehydrogenase inside the cell, it will cleave some amount of Lactate. So, the surge in sfGFP expression should be seen in a higher concentration of lactate induction.
Genetic Design for the Characterization with lldD
So, we designed the following gene construct to produce more LldD (L-Lactate dehydrogenase) in a different plasmid (pSB3K3): <bold>Medium Promoter-Strong RBS-lldD-Terminator</bold> (Part:BBa_K3110007) We used medium promoter and cloned into a low copy number plasmid so that the amount of lldD inside the cell shouldn’t be too high to cleave all the lactate inside the cell and there is no lactate left inside the cell to induce O1PO2. Also, pSB3K3 and pSB1C3 are compatible plasmids and hence can be co-transformed. Then we co-transformed the 3 constructs in BL21(DE3) in 2 different combinations:
- Medium P-Strong RBS-lldD (in pSB3K3) + O1PO2-Strong RBS-sfGFP (in pSB1C3)
- Medium P-Strong RBS-lldD (in pSB3K3) + P-Strong RBS-sfGFP (in pSB1C3)

From the above graph, We observed an increase in threshold to 2 mM as we expected. Although this might not be able to differentiate cancer from non-cancerous cells. However, an increase of threshold suggests that our idea of using lldD as the modulator will work. To clearly understand the effect of ectopic lldD on O1PO2, we plotted the graphs for only O1PO2-Strong-RBS-sfGFP and O1PO2-Strong-RBS-sfGFP along with lldD together.
Comparison between only O1PO2 and O1PO2 along with lldD

From this picture We can clearly see an increase in threshold from 0.45 mM (without lldD) to 2 mM (with lldD) as we expected. Another, major drawback that we observed from this was a decrease in sensitivity i.e. even at sub-threshold lactate levels, the fluorescence observed in the presence of lldD was high. Not only this, at the aforementioned threshold levels, the intensity was lower than in the case without lldD. This could be rectified by using lldP and lldR along with lldD.</p>
BBa_K1847008 characterization by Humboldt_Berlin 2021 in Salmonella Typhimurium minicells using GFP, click here for more details.
References
- Aguilera, L., Campos, E., Gimenez, R., Badia, J., Aguilar, J., & Baldoma, L. (2008). Dual Role of LldR in Regulation of the lldPRD Operon, Involved in L-Lactate Metabolism in Escherichia coli. Journal of Bacteriology, 190(8), 2997–3005. doi:10.1128/jb.02013-07
- Vander Heiden, M. G., Cantley, L. C., & Thompson, C. B. (2009). Understanding the Warburg effect: the metabolic requirements of cell proliferation. Science, 324(5930), 1029-1033.
Fluorescence is used to characterize the detection range of lldRO1-J23117-lldRO2 promoter
Group: NEFU_China 2019
Authors:Yuhan Liu
Fluorescence is used to characterize the detection range of lldRO1-J23117-lldRO2 promoter.
Introduction
In order to know whether lldRO1-J23117-lldRO2 promoter could work and whether the bacteria using lldRO1-J23117-lldRO2 promoter could respond to the tumor microenvironment, we used different concentrations of lactic acid to induce bacteria and EGFP as the reporter protein to observe whether lldRO1-J23117-lldRO2 promoter were effective.
Methods
(1) E. coli was cultured in LB-medium at 37℃ for about 10 h.
(2) Different volumes of calculated lactic acid were added into the already muddy LB-medium and cultured at 25℃ for 8 ~ 10 h.
(3) The fluorescence intensity was observed with the microplate reader.
Result
We observed that EGFP was expressed by E.coli nissle 1917 under different lactic acid concentrations, with the lowest induced concentration up to 1mM lactic acid. This indicates that lldRO1-J23117-lldRO2 promoter is available in E.coli nissle 1917.This part had improved by iGEM19_NEFU_China, and you can See More Information Here.

| None |