Part:BBa_K731721
|
T7 terminator
The characterization of this part was done by the Trento iGEM team 2012 using the new platforms for terminator characterization that they have built and submitted to the Registry as BBa_K731700 and BBa_K731710. |
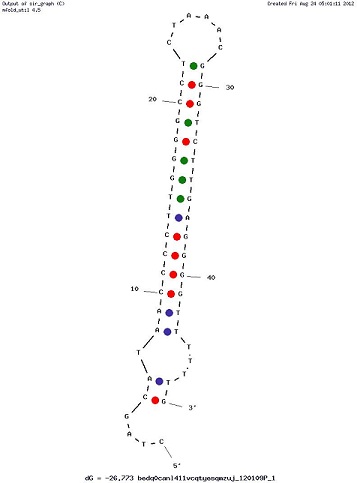
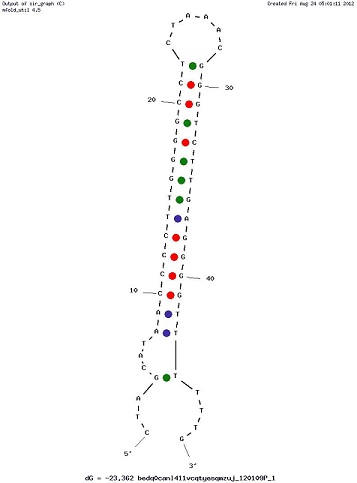
Examples of Secondary Structures
Usage and biology
We made some preliminary analyses to define the best procedure to characterize this terminator using BBa_K731700 and BBa_K731710. We found that the emission from mVenus was much stronger than the mCherry emission, resulting in some spectral overlap. To improve the quality of the data, off-peak excitation and emission wavelengths were identified that minimized the effect. Therefore, mVenus was excitated at 485 nm (excitation peak is at 515 nm), and the emission of mVenus was collected at its maximum position, i.e. 528 nm. The maximum mCherry excitation wavelength was used (587 nm), but the emission of mCherry was read at 615 nm, as opposed to the maximum at 609 nm. Here is a summary of these wavelengths:
| Standard Excitation (nm) | Standard Emission (nm) | Modified Excitation (nm) | Modified Emission (nm) | |
| mCherry | 587 | 609 | 587 | 615 |
| mVenus | 515 | 528 | 485 | 528 |
TABLE 1. Standard and modified excitation and emission wavelengths
The activity of this part was analyzed both with T7 and E. coli RNA polymerases in vivo and with T7 RNA polymerase in vitro.
The activity of this terminators was measured as the ratio between the two proteins' levels using the equation found in literature for termination efficiency.
Doing this measurements, however, we realized that terminators can have an effect also on mCherry expression, enhancing it. This effect was previously described Abe. As a consequence of this unexpected outcome, we defined other two parameters that are here summarized in addition to the literature definition of termination efficiency.
The parameters used to analyze the data are:
apparent termination efficiency, calculated with the equation found in literature Nojima, 
raw termination efficiency, that does not consider the mCherry contribution 
relative increase in the upstream gene expression, 
where
-Vs is the A206K Venus peak’s intensity of the construct with the terminator of interest inserted in the prefix-suffix linker
-Vc is the A206K Venus peak’s intensity of the control construct without intervening terminator
-Cs is the mCherry peak’s intensity of the construct with the terminator inserted
-Cc is the mCherry peak’s intensity of the control construct
In vivo measurements:
Our experiments exploited an E. coli lysogen strain carrying T7 RNA polymerase and lacIq. Additionally, the cells, i.e. E. coli BL21(DE3) pLysS, also contained a plasmid encoding T7 lysozyme and chloramphenicol resistance. T7 lysozyme is a natural inhibitor of T7 RNA polymerase activity, thus reducing background expression of the target genes. The T7 RNA polymerase is behind a lacUV5 promoter.
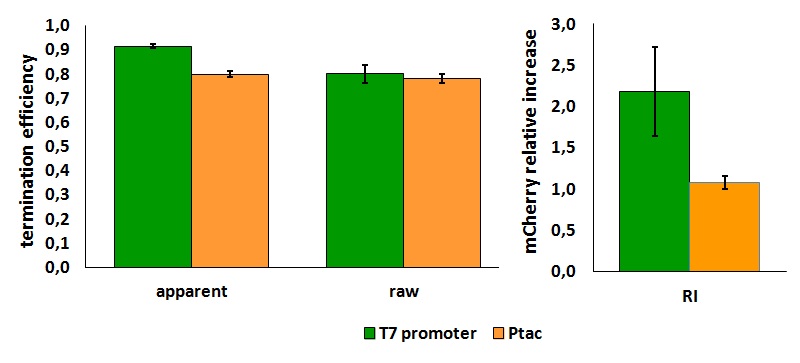
FIGURE 1. T7 bacteriophage terminator's effect on protein expression with two different RNA polymerases
The data shown in figure 1 were acquired in two different days. For each day 4 different replicates were measured at different times.
Briefly, BL21(DE3)pLysS were grown in 10 mL of LB until an OD of 0.6 was reached and induced with 0.5 mM IPTG. After 3 hours of induction, 4 separate aliquots of 1 mL were taken and sonicated 3 times for 10 seconds at intervals of 30 seconds. After sonication the samples were diluted 1:2 with PBS 1X directly into a cuvette and incubated overnight at 4°C. Fluorescence measurements were taken with a Cary Eclipse Varian fluorimeter with a window ranging from 450 nm to 700 nm, a slit of 5nm, a voltage of 570V for the characterization with T7 polymerase and of 520V for the measurements with E. coli RNA polymerase.
It is worth to highlight that the apparent and the raw transcriptional termination efficiencies, shown in figure 1, are essentially different from both a mathematical and a biological point of view. More specifically, raw termination efficiency is determined just by the expression of the downstream gene, while the apparent termination efficiency represents the variations that occur in the expression of both genes up- and down-stream of the terminator. They are in the same chart just for a comparison purpose.
For more information about the protocol we adopted to take these in vivo measurements, see BBa K731700 and BBa K731710 measurements.
In vitro measurements:
We performed the in vitro analysis only with the T7 RNA polymerase.
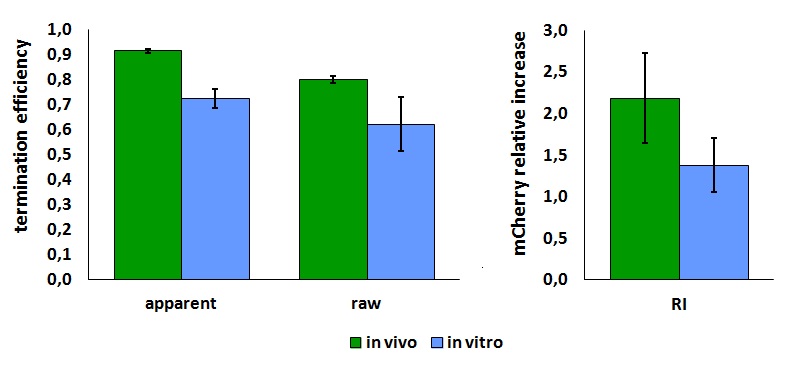
FIGURE 2. T7 bacteriophage terminator's effect on in vitro protein synthesis with the T7 RNA polymerases
Cell free measurements were done with the PurExpress kit from New England Biolabs, using 250 ng of DNA previously purified by ethanol precipitation, following the protocol suggested by the manufacturer. Measurements were done with a PTI fluorimeter using the same excitation and emission wavelengths used for the in vivo measurements.
Note that the in vivo data are the same shown above; they are reported here to aid comparison.
We submitted also this Part inside both BBa_K731700 (T7 promoter backbone) and BBa_K731710 (tac promoter backbone) as, respecitively, BBa_K731701 and BBa_K731702. We hope that this could be helpful for anyone who want to verify and further delve into our results.
More information about the procedure used, the results obtained and our considerations can be found in the [http://2012.igem.org/Team:UNITN-Trento| Trento iGEM 2012 wiki page].
References
<biblio>
- Nojima pmid=16379390
- Abe pmid=9150882
</biblio>
Functional Parameters
| biology | T7 bacteriophage |
| direction | Forward |
| forward_efficiency | 0.915 +/- 0.008 with T7 promoter; 0.80 +/- 0.01 with Ptac |
Functional Parameters: Austin_UTexas
Burden Imposed by this Part:

Burden is the percent reduction in the growth rate of E. coli cells transformed with a plasmid containing this BioBrick (± values are 95% confidence limits). This part exhibited a significant burden. Users should be aware that BioBricks with a burden of >20-30% may be susceptible to mutating to become less functional or nonfunctional as an evolutionary consequence of this fitness cost. This risk increases as they used for more bacterial cell divisions or in larger cultures. Users should be especially careful when combining multiple burdensome parts, as plasmids with a total burden of >40% are expected to mutate so quickly that they become unclonable. Refer to any one of the BBa_K3174002 - BBa_K3174007 pages for more information on the methods and other conclusions from a large-scale measurement project conducted by the 2019 Austin_UTexas team.
This functional parameter was added by the 2020 Austin_UTexas team.
Contribution by CU-Egypt 2022
We measured the expression of Coh and Doc under the T7 Terminator [BBa_K3396000, BBa_K4165003] to compare the termination efficiency of different transcribe genes.
GST-DOC vs GST-COH

          Figure 3. This figure shows the extraction of GST-DOC vs GST-COH using Chemical and sonication methods, this
          figure proves that there is a significant difference between the expression of the Docs and Coh2 protein.
                     Although modulatory parts for transcription and translation are the same.
His-DOC vs His-COH

Figure 4. This figure shows the extraction of GST-DOC vs GST-COH using Chemical and sonication methods.
Mathematical Modeling of GST-DOC with T7 Promoter
Transcription rate and translation rate under T7 promoter
The mathematical modeling was based on our code for calculating transcription and translation according to thermodynamic laws and ODE (You can find it on our wiki). The results were validated and compared with the wet lab showing the same rates.

              Figure 5. this figure shows the results from the transcription and translation code, showing
   the variation of mRNA and protein concentrations with time compared with the wet lab results (2mM IPTG concentration)
Mathematical modeling of His-Doc with T7 promoter
The mathematical modeling was based on our code for calculating transcription and translation according to thermodynamic laws and ODE (You can find it on our wiki). The results were validated and compared with the wet lab showing the same rates.
Transcription rate and translation rate under T7 promoter
the mathematical modeling was based on our code for the calculation of transcription and translation (you can find it in the code section), besides the estimated results from the wet lab.

              Figure 6. this figure shows the results from the transcription and translation code, showing.
   The mRNA and protein concentrations varied with time compared with the wet lab results (2mM IPTG concentration).
| biology | T7 bacteriophage |
| direction | Forward |
| forward_efficiency | 0.915 +/- 0.008 with T7 promoter; 0.80 +/- 0.01 with Ptac |


