
Part:BBa_K1758333
Lead repressor under control of constitutive promoter and strong RBS Lead repressor under the control of a constitutive promoter with lead induceble promoter and 5´untranslated region in front of a sfGFP for detection.
Usage and Biology
For our biosensor we use parts of the chromosomal lead operon of Cupriavidus metallidurans (Ralstonia metallidurans). The promoter that we use is PbrA. This part of the operon is regulated by the repressor pbrR. The PbrR protein mediates Pb2+-inducible transcription. PbrR belongs to the MerR family, which are metal-sensing regulatory proteins (Borremans et al., 2001). Our sensor system is comprised of PbrR, which is under the control of a constitutive promoter and PbrA as well as a 5’ untranslated region, which controls the transcription of a sfGFP. The sfGFP protein is the measuring output signal.
Sequence and Features
- 10COMPATIBLE WITH RFC[10]
- 12INCOMPATIBLE WITH RFC[12]Illegal NheI site found at 465
Illegal NheI site found at 488 - 21COMPATIBLE WITH RFC[21]
- 23COMPATIBLE WITH RFC[23]
- 25COMPATIBLE WITH RFC[25]
- 1000INCOMPATIBLE WITH RFC[1000]Illegal SapI.rc site found at 640
Results
in vivo characterization
In addition to the other heavy metal sensors, we constructed a sensor for lead detection. It consists of the repressor PbrR which binds at the operator box downstream of the pbrAP promoter. The binding of the repressor is reversible in the presence of Pb2+ Ions. Those ions can weakened the repressors binding and hence, all genes downstream of the pbrAP promoter can be expressed. Like the former sensors this one encloses a sfGFP for detection via fluorescence. So if no lead is present in the media, the repressor binds to the operator box and the pbrAP promoter is blocked meaning that the transcription of sfGFP is prevented. No fluorescence signal is the results. By supplementation of lead, the repressor is separated from the operator box and the genes downstream of the promoter can be expressed.
The pbrAP promoter, the operator box and the PbrR repressor are parts of the chromosomal lead operon of Cupriavidus metallidurans (figure 1). This was cloned and transformed into E.coli KRX. This operon includes now the promoter pbrAP ( BBa_K1758332 )), which is regulated by the repressor PbrR. The PbrR belongs to the MerR family, of metal-sensing regulatory proteins, and is Pb2+-inducible. Our sensor system comprises pbrR ( BBa_K1758330 ) BBa_K1758330 ), which is under the control of a constitutive Promoter and pbrAP and a 5’ untranslated region, which controls the transcription of a sfGFP and increases the fluorescence. Fluorescence implemented by sfGFP protein is the measured output signal (figure 2 and figure 3).


The kinetic of our sensors response to different lead concentrations is shown in figure 2. The first 40 hours show a strong increase in fluorescence. After that the increase in fluorescence reaches a plateau. For better visualization the kinetics of figure 2 are represented as bars in figure 3. A fluorescence level difference for 60 min, 150 min and 650 min is represented.
The results of the lead sensor show no significant differences between the different concentrations (figure 3). This might be due to the pbrAP’s weak promoter strength in E. coli. Further reasons are most likely in the weak repressor binding to its operator. So, we suggest for the usage of this sensor, it has to be optimized. Moreover we were lacking time for further in vivo characterizations and different experimental setups. Hence, we did not use this sensor in further experiments regarding Cell-free-Protein-synthesis (CFPS). In the future a characterization in the CFPS systems would be desirable.
IISER Pune 2019 - Characterisation
The emission and excitation spectra for the part was also determined as the reporter gene is sfGFP, a fluorescent protein.
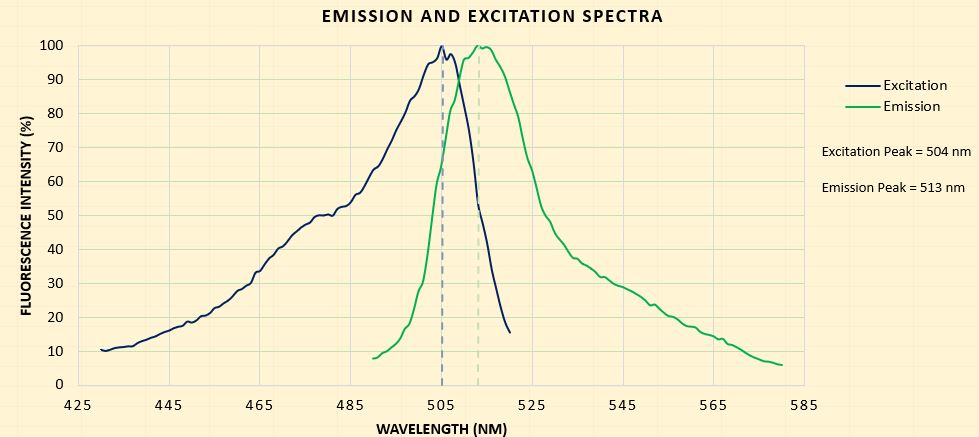
| Excitation Wavelength Measurement (nm) | 490 - 580 |
| Emission Wavelength (nm) | 513 |
| Emission Wavelength Measurement (nm) | 430 - 520 |
| Excitation Wavelength (nm) | 504 |
For characterization of this part, we noted the endpoint fluorescence readouts to determine the difference in fluorescence intensity over a range of lead concentrations. This characterization has been performed in E.coli DH5a cells by inducing the culture with the required amount of lead at an OD600 of 0.8 and then fluorescence is measured at saturation.


A linear fit has been done in the range of 0uM - 15 uM (as predicted by the model). This fit can then be used to predict the lead concentration of a sample based on the fluorescence intensity.

Modelling the Biosensor
A deterministic model based on Stamatakis et al,(2009) was made to describe the dynamics of the system. The biosensor model uses Mass action kinetics are used for processes such as repression, derepression and dimerisation. Hill functions and Michaelis Menten kinetics are used for describing dynamics of mRNA and protein production. Proper approximations are chosen in places where the parameters are unknown.
In the biosensor and in the bioremediation system, the GFP used is superfolder GFP (sf-GFP). This is the case for all instances of GFP mentioned in the biosensor modelling.
Time series
We first have the time series plot of the GFP fluorescence intensity

In the above graph we see that the number of GFP molecules reaches its maximum value in about one hour. The GFP stays constant after this till 100 minutes and then a decrease in GFP is observed. This is the behaviour of the system in 5 µM of Lead.
The constant value of GFP is observed because of a balance in the derepression and repression mechanisms. This would be the state of the system if not for the degradation of the GFP. The longer half-life of the sf-GFP used makes taking measurements easier. For faster degrading GFPs, fluorescence would have to be measured at the exact time for all samples to compare GFP readouts.
Modification of RBS (Ribosome Binding Site)
It was observed that changing the rate of transcription of the proteins was changing the GFP readout for various Lead concentrations. Seen in the graph below

From the graph above we see that changing the rate of transcription can change the range of detection of the biosensor. This is because the range linear GFP increase is different for different transcription rates. Transcription rate is true for the model though, in the real system the transcription rate would mean the RBS binding affinity. To change RBS binding affinity we change the RBS. We wanted a biosensor that could show good contrast of GFP readout in the range of 0µM to 10µM of Lead. Various RBSs were chosen from the RBS/Cat page. This page lists RBSs with their descriptions and binding efficiencies (if known).
Comparing experiment data with the model
Experiments were performed to measure the GFP readout of the cell at various concentrations of Lead. The values obtained are compared to those obtained by the model in the graph below.

Most points lie on the line predicted by the model. The error bars plotted show the standard error of the experiment plot points. This graph shows that the model predictions match the experiment results within limits of error. Hence these parameters can be used for further predictions to improve biosensor.
Improving the Biosensor

Fig.2 and Fig.4 show that biosensor systems with lower rate of translation can be used to measure lower concentrations of Lead and vice-versa. This implies that lower rates of translation correspond to more sensitivity of the biosensor. However this sensitivity is only at low Lead concentrations because as seen in Fig.2, less efficient RBS systems show saturation of GFP at higher Lead concentrations. Fig.4 shows that using a weaker RBS (less efficient RBS) gives us more contrast in the range of 0µM to 10µM. This is the range of detection that we want to work in, since the local river has Lead concentration in the range of 4µM to 7µM.
Team Florida Characterization Data
We took several metal promoter parts from the distribution kit given to us by iGEM. However most of the parts did not come with the repressor and therefore we only picked BBa_K1758333 (lead) and BBa_K1758343(mercury).
We used a 96-well plate to measure the RFU and GFP of the cultures containing the corresponding metal promoters.
96 Well Plate Set-Up

In 5 mL culture:
Hg/Pb
- Low: 0.5mL of 10 mg/mL stock = 1ug/uL
- Medium: 0.5mL of 1 mg/mL stock = 0.1ug/uL
- High: 0.5mL of 0.1mg/mL stock = 0.01 ug/uL
Cr
- Low: 2.5uL of 0.1 mg/mL stock = 0.05ug/uL
- Medium: 2.5uL of 1 mg/mL stock = 0.5ug/uL
- High: 2.5uL of 10mg/mL stock = 5 ug/uL
Cu
- Low: 1uL of 10 mg/mL stock = 2ug/uL
- Medium: 2.5uL of 10 mg/mL stock = 5ug/uL
- High: 5uL of 10mg/mL stock = 10 ug/uL

Some cells with other metal promoters were emitting fluorescence even before we induced the cells with the toxins. As a result, the metal promoters are unaffected by the inducers and do not work effectively.

Looking at the graph, with increasing concentration of relevant levels of inducer(toxin) the relative fluorescence units are not increasing as expected.

In regards to BBa_K1758333, there is a fold change between the GFP uninduced lead and GFP low induced lead RFU average measurements. But after looking over the two replicate GFP low induced data measurements, one of the values is slightly larger than the other so the data values are inconsistent. Therefore, we cannot make any conclusions about the fold change in the GFP mercury low induced RFU measurement. The fold change values for the GFP medium and high induced RFU measurements showed that the fluorescence expression was decreasing as the inducer concentration increased. Therefore we can conclude that the Lead promoter did not work. Team Bielefeld also concluded that there were no significant differences in fluorescence response for the lead promoter.