
Part:BBa_K1758310
Chromium repressor under control of constitutive promoter and strong RBS
Repressor for chromium responsive promoter ChrP under the control of the konstitutive promoter (K608002)
Usage and Biology
We used this repressor for our chromium sensor. Originaly its from Ochrobactrum triti ci5bvl1. We codon optimized it for use in E.coli. It is essential for our chromium sensor device BBa_K1758312. In combination with BBa_K1758313,BBa_K1758314 this part cerates our chromium sensor.
Sequence and Features
- 10COMPATIBLE WITH RFC[10]
- 12INCOMPATIBLE WITH RFC[12]Illegal NheI site found at 55
Illegal NheI site found at 966
Illegal NheI site found at 989 - 21COMPATIBLE WITH RFC[21]
- 23COMPATIBLE WITH RFC[23]
- 25INCOMPATIBLE WITH RFC[25]Illegal AgeI site found at 124
- 1000COMPATIBLE WITH RFC[1000]
in vivo
The chromium sensor (BBa_K1758313) was constructed by using the basic construction we showed in Our biosensors. We work with the chromate inducible operon of Ochrobactrum tritici 5bvl1 which enables a resistance for chromium VI and superoxide. For our sensor we used the CrVI dependent repressor chrB which was introduced by team BIT 2013 (BBa_K1058007), and optimized this sequence for the use in E. coli . The repressor protein becomes deactivated by the binding of Cr6+-ions The associated chromium responsive promoter is chrP (introduced by BIT 2013) (BBa_K1058007). For output we used sfGFP and a 5’UTR untranslated region in front of sfGFP to optimize the expression of the reporter protein and increase its fluorescence (see figure 2).
Our sensor for chromium detection consists of ChrB the repressor and the chromate specific promoter ChrP. The promoter is regulated by ChrB, which binds Cr6+-ions. Behind the promoter is a sfGFP for detection of a fluorescence signal.


We tested our in vivo chromium sensor with sfGFP as reporter gene, to test the functionality of the system. Moreover we tested different chromium concentrations. The kinetic of our sensors response to different chromium concentrations is shown in figure 3. The first 30 hours show a strong increase in fluorescence. After that the increase in fluorescence is slower. For better visualization the kinetics of figure 3 are represented as bars in figure 4. A fluorescence level difference for 60 min, 150 min and 650 min is represented.
Our data lead to the conclusion that in a cell based system it is possible to detect chromium. In contrast to our expectations with higher chromium concentrations we got lower fluorescence levels. These observations needed further investigation. Additionally the bar chart showed that the chromium sensor needs a long time to get different fluorescence levels at different chromium concentrations in in vivo experiments. The bar chart showed significant differences between the chromium concentrations after 650 minutes.
in vitro
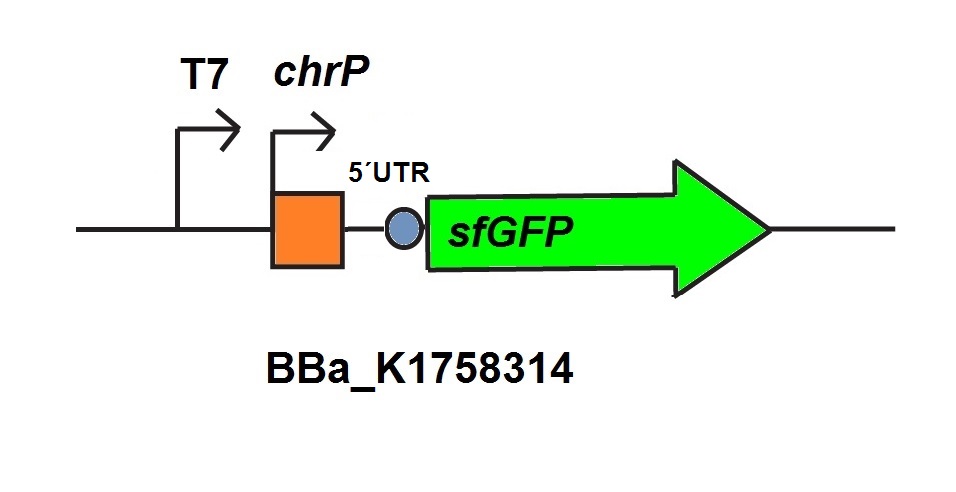
For the characterization of the chromium sensor with CFPS we used parts differing from that we used in vivo characterization. For the in vitro characterization we used a cell extract produced from cells which contain the plasmid (BBa_K1758310). The plasmid contains the gene chrB under the control of a constitutive promoter, so that the cell extract is enriched with repressor molecules. In addition to that we added plasmid-DNA of the chromium specific promoter chrP with 5’UTR-sfGFP under the control of T7-promoter (BBa_K1758314 (figure 6))to the cell extract. The T7-promoter is needed to get a better fluorescence expression.


Chromium’s influence on the cell extract as shown in figure 7 is minimal for low concentrations. Higher chromium concentrations have a measurable impact on the viability of the cell extract, which is visible at concentrations of 120 µg/L and obvious at concentrations of 240 µg/L chromium.

The decrease of fluorescence for higher chromium concentrations in chromium specific cell extract is shown in figure 8. An increase of fluorescence at higher chromium concentrations would have been expected resulting out of the induction of the chromium sensor. A factor which should be considered is the influence of high chromium concentrations to the cell extract. The test for influence of chromium on the specific cell extract, illustrated in figure 7 showed that the influence of chromium at low concentrations is not significant. But the graphic shows that high concentrations of chromium induce fatal damages to the cell extract.

Taking the influence of different chromium concentrations under consideration measured fluorescence can be normalized on chromium’s influence on the cell extract (figure 9). Normalized data suggest, that higher concentrations of chromium induce fluorescence in relevance to chromium’s influence on the cell extract.


In addition to the measurements of our chromium sensor in CFPS we measured our chromium inducible promoter with the repressor of team Dundee (figure 10, 11), which works similar to ours. In contrast to our repressor only first 15 codons of their repressor are codon-optimized. Measurements with their repressor showed tendencies similar to our measured repressor. After normalization induction with higher chromium concentrations showed a detectable fluorescence response for both measured datasets.
References
Guidelines for drinking-water quality (2011). 4th ed. Geneva: World Health Organization, zuletzt geprüft am 20.08.2015.
Mitchell D. Cohen; Biserka Kargacin; Catherine B. Klein; and Max Costa: Mechanisms of Chromium Carcinogenicity and Toxicity, zuletzt geprüft am 19.08.2015.
Paustenbach, Dennis J.; Finley, Brent L.; Mowat, Fionna S.; Kerger, Brent D. (2003): Human health risk and exposure assessment of chromium (VI) in tap water. In: Journal of toxicology and environmental health. Part A 66 (14), S. 1295–1339. DOI: 10.1080/15287390306388.
WHO (2003): Mercury in Drinking-water Background document for development of WHO Guidelines for Drinking-water Quality, checked 15.08.15
| None |