
Part:BBa_K1758314
Chromium responsive promoter under T7-promoter with UTR-sfGFP
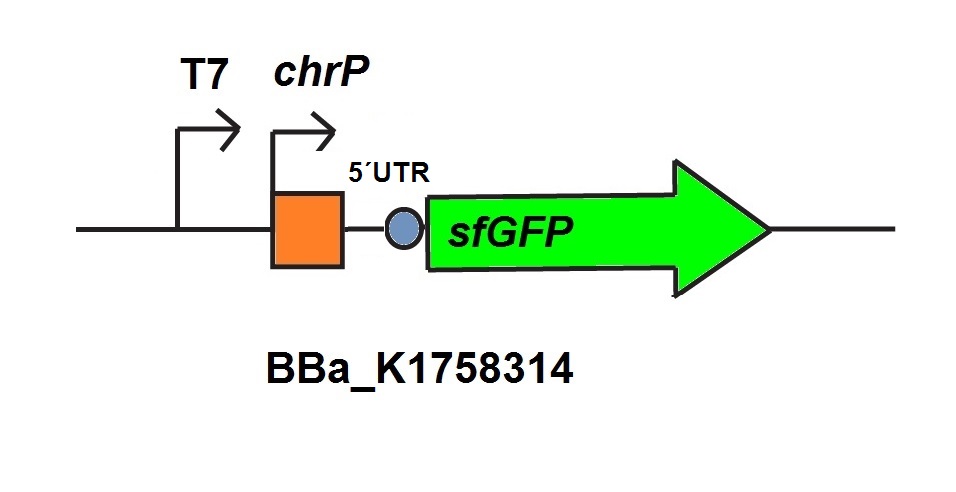
Chromium induceble promoter under the control of a T7 promoter with 5´untranslated region and sfGFP for detection
Usage and Biology
This part is essential for our in vitro characterization of our chromium sensor. The edition of T7 promoter to BBa_K1758313 enables us to characterize this sensor in our CFPS. We used this promoter for our chromium sensor. Originaly its from Ochrobactrum triti ci5bvl1. this part cerates our chromium sensor. </html> Sequence and Features
- 10COMPATIBLE WITH RFC[10]
- 12COMPATIBLE WITH RFC[12]
- 21INCOMPATIBLE WITH RFC[21]Illegal BglII site found at 167
- 23COMPATIBLE WITH RFC[23]
- 25COMPATIBLE WITH RFC[25]
- 1000INCOMPATIBLE WITH RFC[1000]Illegal SapI.rc site found at 260
in vitro
For the characterization of the chromium sensor with CFPS we used parts differing from that we used in vivo characterization. For the in vitro characterization we used a cell extract produced from cells which contain the plasmid (BBa_K1758310). The plasmid contains the gene chrB under the control of a constitutive promoter, so that the cell extract is enriched with repressor molecules. In addition to that we added plasmid-DNA of the chromium specific promoter chrP with 5’UTR-sfGFP under the control of T7-promoter (BBa_K1758314 (figure 6))to the cell extract. The T7-promoter is needed to get a better fluorescence expression.


Chromium’s influence on the cell extract as shown in figure 7 is minimal for low concentrations. Higher chromium concentrations have a measurable impact on the viability of the cell extract, which is visible at concentrations of 120 µg/L and obvious at concentrations of 240 µg/L chromium.

The decrease of fluorescence for higher chromium concentrations in chromium specific cell extract is shown in figure 8. An increase of fluorescence at higher chromium concentrations would have been expected resulting out of the induction of the chromium sensor. A factor which should be considered is the influence of high chromium concentrations to the cell extract. The test for influence of chromium on the specific cell extract, illustrated in figure 7 showed that the influence of chromium at low concentrations is not significant. But the graphic shows that high concentrations of chromium induce fatal damages to the cell extract.

Taking the influence of different chromium concentrations under consideration measured fluorescence can be normalized on chromium’s influence on the cell extract (figure 9). Normalized data suggest, that higher concentrations of chromium induce fluorescence in relevance to chromium’s influence on the cell extract.


In addition to the measurements of our chromium sensor in CFPS we measured our chromium inducible promoter with the repressor of team Dundee (figure 10, 11), which works similar to ours. In contrast to our repressor only first 15 codons of their repressor are codon-optimized. Measurements with their repressor showed tendencies similar to our measured repressor. After normalization induction with higher chromium concentrations showed a detectable fluorescence response for both measured datasets.
| None |