
Part:BBa_K1033917
gfasPurple, purple chromoprotein (incl RBS, J23110)
This chromoprotein from the coral Galaxea fascicularis, gfasPurple (also known as gfasCP), naturally exhibits strong color when expressed. The protein has an absorption maximum at 577 nm giving it a purple color visible to the naked eye. Compared to many other chromoproteins, such as amilCP (BBa_K592009), amilGFP (BBa_K592010), spisPink (BBa_K1033932), asPink (BBa_K1033933) and aeBlue (BBa_K864401), the color development is slower. The color is readily observed in both LB or on agar plates after 24-48 hours of incubation. The protein gfasPurple is closely related to amilCP (BBa_K592009) and has significant sequence homologies with proteins in the GFP family.
Characterisation
The iGEM team of Rotterdam 2019 characterized this part more as part of the bronze criteria. This biobrick has been transformed into DH5alpha-cells. The cells have been pelleted from 15 mL cultures, resuspended in saline with 15 mL and gone through sonication at 20-24 amplitudes for 15 seconds. The supernatant was then collected for the experiments described below.
Two characterization experiments have been performed. First, full-spectrum analysis has been performed which not only tells us what the maximum absorbance is at which wavelength, but also what the absorbance is at all the other wavelengths with an additional 801-1000 nm extra analysis (so 300-1000 nm) to what the other team has done which is 300-800 nm. In figure 2 and 3 we can see the graph in which the absorbance maximum matches the 577 nm, but we can now also see what the absorbance is at the other wavelengths. The proteins have been lysed in saline, so the blank also is saline (figure 1).
The second characterization experiment was performed by tweaking the environment in which the protein exists. The team wanted to see if there would be any changes in absorbance when the proteins are in an acidic (pH0.3) or basic environment (pH 13.3). More pH-points have been tested, and there clearly is a shift in absorbance as seen in the chart when the pH goes up or down from its natural pH point: pH7.3. The proteins have been lysed in saline, so the blank also is saline. The tests have been performed twice in different wells of an 96-wells plate (figure 4 and 5).
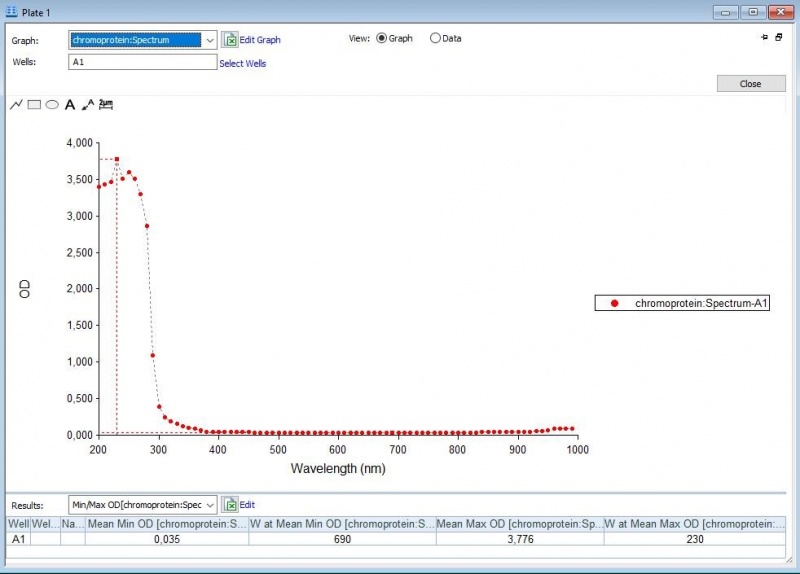
Figure 1: Negative control with saline.

Figure 2: Full spectrum analysis of gfasPurple.

Figure 3: Duplicate of the full spectrum analysis of gfasPurple.

Figure 4: Full spectrum pH-analysis of gfasPurple.

Figure 5: Duplicate of the full spectrum pH-analysis of gfasPurple.
Characterisation
Team: Humboldt_Berlin 2019
ExPASy ProtParam Results:
Number of amino acids: 220
Molecular weight: 24816.17 Da
Theoretical pI: 7.61
Total number of negatively charged residues (Asp + Glu): 24
Total number of positively charged residues (Arg + Lys): 25
Extinction coefficients:
Ext. coefficient 37610 M-1 cm-1
Abs 0.1% (=1 g/l) 1.516, assuming all pairs of Cys residues form cystines
Ext. coefficient 37360 M-1 cm-1
Abs 0.1% (=1 g/l) 1.505, assuming all Cys residues are reduced
Instability index: The instability index (II) is computed to be 39.71. This classifies the protein as stable.
Aliphatic index: 61.50
Grand average of hydropathicity (GRAVY): -0.544
In order to measure the absorbance spectrum of gfasPurple we transformed the construct (consisting of BBa_J23110 Promotor, BBa_B0034 RBS and gfasPurple coding sequence) into competent E. coli. After cultivation and we lysed the harvested cells according to this protocol.

Liquid culture of E. coli expressing gfasPurple

Cell pellet after centrifugation

Cleared cell lysate


The absorbance spectrum was measured for 24 samples of 150 µl lysate in 96-well plate on TECAN Plate Reader Infinite 200 Pro. In figure 1 you can see the absorbance spectrum including the respective standard deviation with a peak at 580 nm (compared to an excitation maximum of 577 nm in the literature [2]).
| Table 1. Parameters utilized for absorbance spectrum | |||
| Parameter | Value | ||
| Number of Samples | 24 | ||
| Wavelength Step Size | 2 | ||
| Absorbance Scan: Excitation Wavelength Measurement Range (nm) | [300-800] | ||
| Number of Flashes | 25 | ||
| Settle Time (ms) | 0 | ||

Source
Galaxea fascicularis. The protein was first extracted and characterized by Alieva et. al. under the name gfasCP (GenBank: DQ206394.1). This version is codon optimized for E coli by Genscript.
References
[http://www.ncbi.nlm.nih.gov/pubmed/18648549] Alieva, Naila O., et al. "Diversity and evolution of coral fluorescent proteins." PLoS One 3.7 (2008): e2680.
[1] Liljeruhm, Josefine et al. “Engineering a palette of eukaryotic chromoproteins for bacterial synthetic biology.” Journal of biological engineering vol. 12:8. 10 May. 2018, doi:10.1186/s13036-018-0100-0
Sequence and Features
- 10COMPATIBLE WITH RFC[10]
- 12INCOMPATIBLE WITH RFC[12]Illegal NheI site found at 7
Illegal NheI site found at 30 - 21COMPATIBLE WITH RFC[21]
- 23COMPATIBLE WITH RFC[23]
- 25COMPATIBLE WITH RFC[25]
- 1000COMPATIBLE WITH RFC[1000]
| None |