Part:BBa_E0030
enhanced yellow fluorescent protein derived from A. victoria GFP
-- No description --
<Allergen characterization of BBa_E0030
The Baltimore Biocrew 2017 team discovered that proteins generated through biobrick parts can be evaluated for allergenicity. This information is important to the people using these parts in the lab, as well as when considering using the protein for mass production, or using in the environment. The allergenicity test permits a comparison between the sequences of the biobrick parts and the identified allergen proteins enlisted in a data base.The higher the similarity between the biobricks and the proteins, the more likely the biobrick is allergenic cross-reactive. In the full-length alignments by FASTA, 30% or more amount of similarity signifies that the biobrick has a Precaution Status meaning there is a potential risk with using the part. A 50% or more amount of identity signifies that the biobrick has a Possible Allergen Status. In the sliding window of 80 amino acid segments, greater than 35% signifies similarity to allergens. The percentage of similarity implies the potential of harm biobricks’ potential negative impact to exposed populations. For more information on how to assess your own biobrick part please see the “Allergenicity Testing Protocol” in the following page http://2017.igem.org/Team:Baltimore_Bio-Crew/Experiments
For the biobrick Part: BBa_E0030, there was a 31.9 % of identity match and 56.5% similarity match to the top allergen in the allergen database. This means that the biobrick part is NOT of potential allergen status. In 80 amino acid alignments by FASTA window, no matches found that are greater than 35% for this biobrick. This also means that there is NOT of potential allergen status.
>Internal Priming Screening Characterization of BBa_E0030: Has 2 possible internal priming site between this BioBrick part and the VF2 primer.
The 2018 Hawaii iGEM team evaluated the 40 most frequently used BioBricks and ran them through an internal priming screening process that we developed using the BLAST program tool. Out of the 40 BioBricks we evaluated, 10 of them showed possible internal priming of either the VF2 or VR primers and sometime even both. The data set has a range of sequence lengths from as small as 12 bases to as large as 1,210 bases. We experienced the issue of possible internal priming during the sequence verification process of our own BBa_K2574001 BioBrick and in the cloning process to express the part as a fusion protein. BBa_K2574001 is a composite part containing a VLP forming Gag protein sequence attached to a frequently used RFP part (BBa_E1010). We conducted a PCR amplification of the Gag-RFP insert using the VF2 and VR primers on the ligation product (pSB1C3 ligated to the Gag + RFP). This amplicon would serve as template for another PCR where we would add the NcoI and BamHI restriction enzyme sites through new primers for ligation into pET14b and subsequent induced expression. Despite gel confirming a rather large, approximately 2.1 kb insert band, our sequencing results with the VR primer and BamHI RFP reverse primer gave mixed results. Both should have displayed the end of the RFP, but the VR primer revealed the end of the Gag. Analysis of the VR primer on the Gag-RFP sequence revealed several sites where the VR primer could have annealed with ~9 - 12 bp of complementarity. Internal priming of forward and reverse primers can be detrimental to an iGEM project because you can never be sure if the desired construct was correctly inserted into the BioBrick plasmid without a successful sequence verification.
For the BioBrick part BBa_E0030, the first location of the internal priming site is on the 111-118 base number of the BioBrick and on the 1-8 base number of the VF2 primer. The second location of the internal priming site is on the 449-455 base number of the BioBrick and on the 10-16 base number of the VF2 primer.
Usage and Biology
Sequence and Features
- 10COMPATIBLE WITH RFC[10]
- 12COMPATIBLE WITH RFC[12]
- 21COMPATIBLE WITH RFC[21]
- 23COMPATIBLE WITH RFC[23]
- 25COMPATIBLE WITH RFC[25]
- 1000COMPATIBLE WITH RFC[1000]
Functional Parameters: Austin_UTexas
Burden Imposed by this Part:

Burden is the percent reduction in the growth rate of E. coli cells transformed with a plasmid containing this BioBrick (± values are 95% confidence limits). This BioBrick did not exhibit a burden that was significantly greater than zero (i.e., it appears to have little to no impact on growth). Therefore, users can depend on this part to remain stable for many bacterial cell divisions and in large culture volumes. Refer to any one of the BBa_K3174002 - BBa_K3174007 pages for more information on the methods, an explanation of the sources of burden, and other conclusions from a large-scale measurement project conducted by the 2019 Austin_UTexas team.
This functional parameter was added by the 2020 Austin_UTexas team.
Estonia_TUIT 2021 team contribution
Enhanced yellow fluorescent protein (EYFP)
EYFP is a rapidly-maturing yellow/green fluorescent protein derived from Aequorea victoria (Nagai et al., 2002) that can be used for both mammalian and bacterial gene expression studies (Hentschel et al., 2013, Enhanced Yellow Fluorescent Protein (EYFP) Tubulin Localization | Nikon’s MicroscopyU). It is a weak dimer with high acid sensitivity that can be uniquely quenched by chloride ion (Cl-) (Nagai et al., 2002). Besides fast maturation of only 9 minutes, EYFP has quite a high quantum field of 0.67 units (EYFP :: Fluorescent Protein Database). EYFP is one of the brightest fluorescent proteins (brighter than EGFP, ECFP and mRFP1) (Jusuk et al., 2015) and therefore is specifically useful for super-resolution microscopy. The photostability of EYFP is 60 seconds which is lower than that of GFP and ECFP. EYFP has an excitation maximum at 513 nm wavelength and emission peak at 527 nm wavelength that can be seen on Figure 1.

Figure 1. The emission and excitation spectra of EYFP (EYFP :: Fluorescent Protein Database, 2021). The green line corresponds to the excitation spectrum, the yellow line corresponds to the emission spectrum. The excitation maximum of 513 nm, the emission maximum of 527 nm, the extinction coefficient of 67000M-1cm-1 and the quantum yield of 0.4 were recorded.
The confocal microscopy setup for visualisation of EYFP protein can be found in Table 1 (Imaging Fluorescent Proteins | Nikon’s MicroscopyU).
Table 1. Fluorescent Nikon microscope A1 HD25/A1R HD25 settings for EYFP.
| Excitation Laser (nm) | Excitation Filter CWL / BW (nm) | Dichromatic Mirror Cut-On (nm) | Barrier Filter CWL / BW (nm) | Relative Brightness (% of EGFP) |
| Argon (514) | 490/40 | 515LP | 540/30 | 151 |
References
- Nagai, T., Ibata, K., Park, E. S., Kubota, M., Mikoshiba, K., & Miyawaki, A. (2002). A variant of yellow fluorescent protein with fast and efficient maturation for cell-biological applications. Nature Biotechnology 2002 20:1, 20(1), 87–90. https://doi.org/10.1038/nbt0102-87
- Enhanced Yellow Fluorescent Protein (EYFP) Tubulin Localization | Nikon’s MicroscopyU. (n.d.). Retrieved October 19, 2021, from https://www.microscopyu.com/techniques/fluorescence/nikon-fluorescence-filter-sets/yellow-fluorescent-protein-excitation-yfp-hyq/enhanced-yellow-fluorescent-protein-eyfp-tubulin-localization
- EYFP :: Fluorescent Protein Database. (n.d.). Retrieved October 15, 2021, from https://www.fpbase.org/protein/eyfp/
- Jusuk, I., Vietz, C., Raab, M., Dammeyer, T., & Tinnefeld, P. (2015). Super-Resolution Imaging Conditions for enhanced Yellow Fluorescent Protein (eYFP) Demonstrated on DNA Origami Nanorulers. Scientific Reports 2015 5:1, 5(1), 1–9. https://doi.org/10.1038/srep14075
- Imaging Fluorescent Proteins | Nikon’s MicroscopyU. (n.d.). Retrieved October 15, 2021, from https://www.microscopyu.com/techniques/fluorescence/fluorescent-protein-imaging-parameters
2022 team HUS_United's contribution
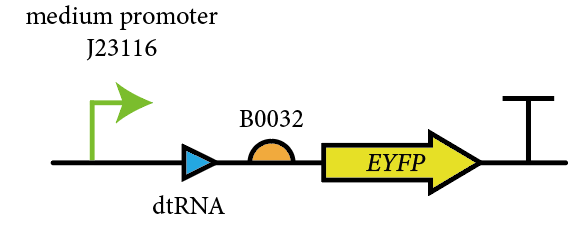
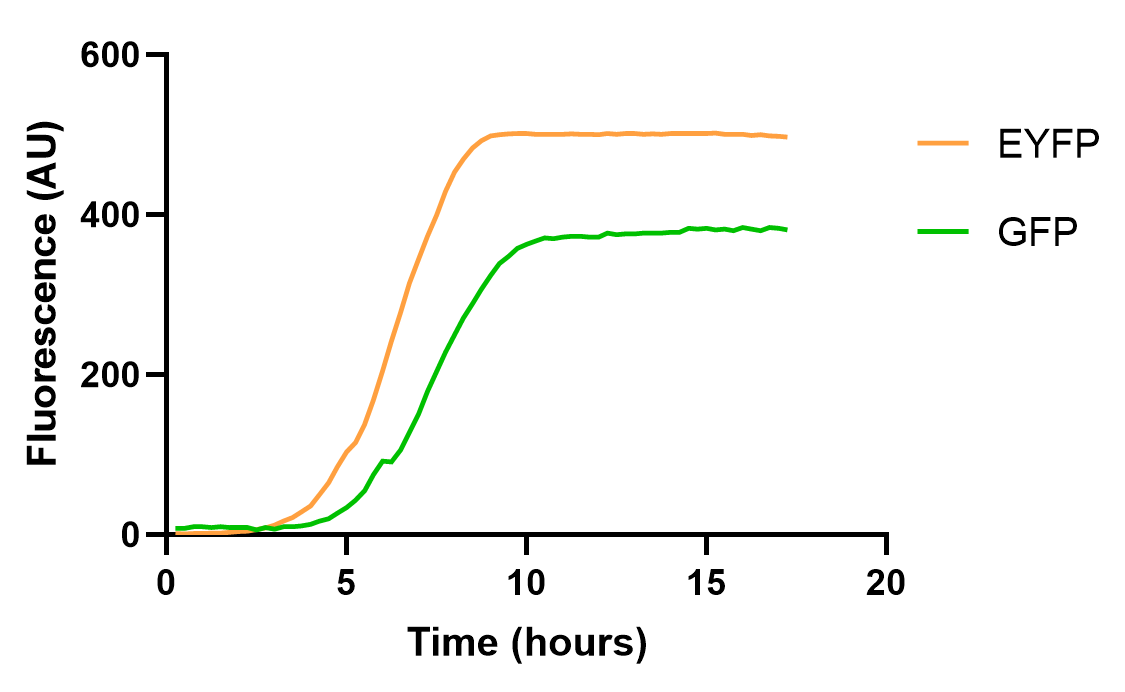
This year, we characterized BBa_E0030 for measuring its fluorescent curve under the control of J23106 and B0032, and compare it with GFP(BBa_E0030), to test the effect of the reporter gene on measurements.
The samples for measurement are prepared as follows:
1. Use inverse PCR to obtain the vector fragment
2. Commercially purchased single-stranded DNA integration fragments(promoter and RBS sequences) with two homologous arms are inserted into the linearized vector through HiFi assembly. (Approximately 50:1 in molar ratio)
3. E.coli DH5α competent cells are transformed with finished HiFi assembly reactions, and colonies are picked and sequenced on the next day.
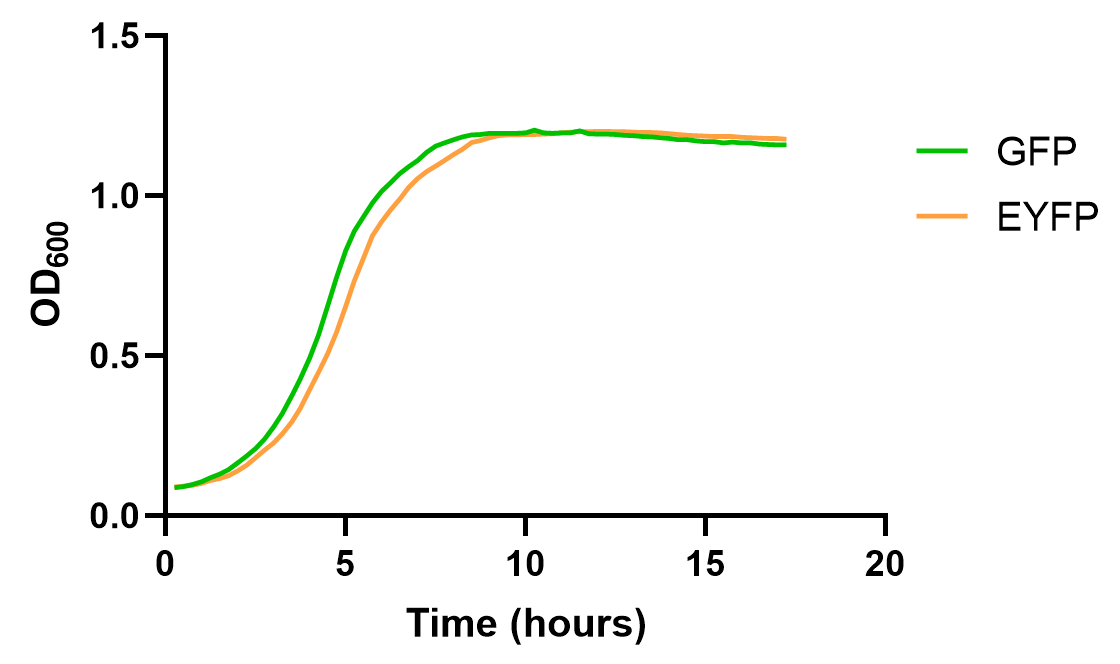
4. Colonies with correct sequences are cultured for 8h and then transferred to a microplate with 100-fold dilution, GFP fluorescence (excitation=488 nm, emission=515 nm) and OD600 are measured every 15 minutes for 16 h duration.
The results are as follows:
The result shows that EYFP and GFP hold different dynamics for fluorescence growth, partially due to the maturation and quenching of fluorescent proteins and different background signals. Yet, their growth curve is roughly the same. These results also emphasize the need for choosing appropriate reporter genes in measurement experiments.
//function/reporter/fluorescence
| abs | |
| color | Yellow |
| direction | Forward |
| emission | YFP |
| emit | 527 |
| excitation | |
| excite | 514 |
| kegg | |
| lum | |
| protein | EYFP |
| swisspro | |
| tag | None |

 1 Registry Star

