Part:BBa_K3037003
Fusion protein dCas9 + HRP (MBP/dCas9/linker/HRP/Strep-tag)
| Fusion protein | |
|---|---|
| Function | Colour detection of specific DNA sequences |
| Use in | Escherichia coli |
| RFC standard | Freiburg RFC25 standard |
| Backbone | pSB1C3 |
| Experimental Backbone | pOCC97 |
| Submitted by | Team: TU_Dresden 2019 |
Contents
- 1 Overview
- 2 Characterization
- 2.1 Outline
- 2.2 Experiments in Detail
- 2.2.1 1) Expression of our Full Construct (FC) in pOCC97 (BBa_K3037000): and testing the growth of E.coli.
- 2.2.2 2) SDS-PAGEs showing the expression assay over time
- 2.2.3 3) Image analysis of the expression in the SDS-PAGEs with ImageJ
- 2.2.4 4) Characterization of the single parts of the full construct
- 3 Sequence
- 4 References
Overview
The TU Dresden 2019 team has designed this BioBrick in order to allow for the quick detection of specific DNA sequences of interest (more information).
The Full Construct as it is shown in Figure 1 below, contains five individual parts each of which have been optimized for it. The MBP and Strep-tag allow purification via amylose resin and via Strep-columns, respectively. Additionally, the MBP enhances the expression of dCas9-fusion proteins, and the linker aids for the folding process. The dCas9 identifies the sequence of interest, and the HRP provides with an easily detectable amplified color readout. The single constructs were fused in pSB1C3 and pSB1A3, and finally, the full construct was inserted into the BBa_K3037000 vector for expression and characterization in Escherichia coli (E. coli).
The weight of the fusion protein was calculated in accordance to the number of base pairs. The sequence of our Full Construct is 924 bp/3 = 308 amino acids long, each amino acid weights on average 110 Dalton [1], which results in the final weight of approximately 230 kDa.
Biology
For more information regarding the biology, design and function of each of the basic parts, please check the individual registry pages:
- MBP: BBa_K3037001
- dCas9: BBa_K3037002
- Linker: BBa_K3037004
- HRP: BBa_K3037007
- Strep-tag: BBa_K823038
The expected parameters of the new protein (determined with ExPASy ProtParam tool) were determined to be:
- Extinction coefficient: 205750 L/(mol*cm)
- Estimated half-life > 30 hours in mammalian cells, >20 hours in yeast and >10 hours in E. coli
Characterization
Outline
We performed the following characterization experiments:
1) Expression of our Full Construct (FC) in pOCC97 (BBa_K3037000): and testing the growth of E.coli.
2) SDS-PAGEs showing the expression assay over time
3) Image analysis of the expression in the SDS-PAGEs with ImageJ
4) Characterization of the single parts of the full construct
Experiments in Detail
1) Expression of our Full Construct (FC) in pOCC97 (BBa_K3037000): and testing the growth of E.coli.
The full construct, once all the single parts were fused together, was cloned into our expression plasmid K3037000 (p0CC97). The correct insertion of our full construct into the plasmid was proven via restriction digest followed by agarose gel electrophoresis. For that, we performed a triple digest with PmlI, X and P and got several positive clones. On the right, the simulation of the digest in SnapGene is shown.
Furthermore, it was proven that the E. coli could grow normally after the induction of the fusion protein. For that, the development of the bacteria cultures was monitored by measuring the OD at 600 nm during different time points before and after induction with 1 mM IPTG.
As shown in the curve, the growth of the bacteria is not affected by the expression of the protein. Important to note here is that the expression of the full construct was performed in two slightly different POCC97 plasmids, that differ on their Ribosome Binding Site (RBS). Herein after they are going to be referred to as optimized and not optimized (read the registry page BBa_K3037000 to for more details regarding the difference between these two plasmids).
To go further, the expression of the full construct in pOCC97 at different temperatures was studied. For that, the optimized and not optimized pOOC97 were compared.
2) SDS-PAGEs showing the expression assay over time
After proving that the final construct was well inserted in our plasmid, the full construct was expressed overnight. The first expression was performed at 37°C for seven hours, induced with 1 mM IPTG. The result is shown below:
The same experiment was repeated several times at different temperatures and IPTG concentrations in both, the optimized and not optimized POCC97 to compare the best expression conditions. The results are shown in the Figures below.
Expression of Full Construct in pOCC97 not optimized at 18ÂșC and different IPTG concentrations
Expression of Full Construct in pOCC97 not optimized at 37ÂșC and different IPTG concentrations
Expression of the Full Construct in pOCC97 optimized at different temperatures and IPTG concentrations
3) Image analysis of the expression in the SDS-PAGEs with ImageJ
The previously shown SDS-pages were then further analysed by using the software ImageJ to correct for loading differences and be able to draw conclusions about the best conditions to express the Full Construct in POCC97.
Temperature and IPTG induction dependence of the optimized POCC97
Temperature and IPTG induction dependence of the not optimized POCC97
Comparison between optimized and not optimized POCC97
Conclusion
Based on this analysis it can be concluded that the optimal conditions for the expression of BBa_3037003 in POCC97 are 18ÂșC and 0.5 mM IPTG. The expression seems to be more stable over time for the optimized plasmid than for the non-optimized.
4) Characterization of the single parts of the full construct
a) Purification via MBP
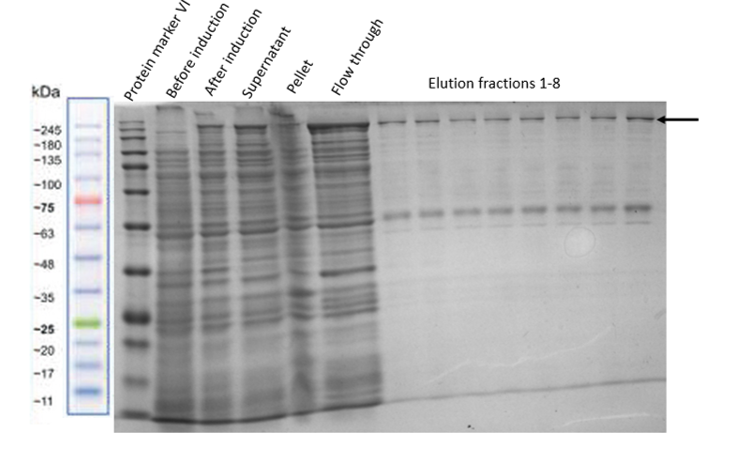
After proving that the Full Construct is expressed properly in our plasmid and improved its expression conditions, it was purified by using Amylose Resin to bind its MBP site. To test for the correct functioning of each single part of the fusion protein we performed different experiments. For that, two different protocols were used. On the one hand, an Amylose Resin column was used and on the other hand a batch binding solution was prepared. Better results were obtained with the latter one and therefore, in which the resin was pipetted into a falcon and incubated with the cell lysate for 1.5 hours on a rotator at 4°C. The purification is shown in the following Figure.
b) Activity assay of HRP
Investigating the activity of HRP in the Full Construct was done in a dynamic assay. The absorbance at 650 nm was measured over time with the substrate TMB (which is colorless but is converted into a blue product by oxidation through HRP). Furthermore, the addition of H2O2 catalyses the oxidation of the TMB since it acts as a electron donor, enhancing the blue product. The reaction can be stopped by adding an acidic solution (for example: HCl), which results in a yellow coloured-readout. See more information about the HRP activity in BBa_K1800002 To prove the correct activity of the HRP in our Full Construct we used bacteria expressing it, performed mechanical lysis on them, added the HRP substrate TMB followed by the addition of H2O2 and stopped the reaction by adding HCl. Bacteria not expressing the Full Construct were used as a negative control. The result can be seen very nicely in the following video:
To further verify the correct activity of the HRP, the absorbance at 650 nm of both cell lysates was performed. As it can be seen in the following Figure, the cell lysate that is not expressing the Full Construct show a much lower absorbance at 650 nm, than the lysate containing the Full construct. This means, that the HRP contained in Full Construct is working properly.
c) dCas9 activity
d) Strep-tag column purification
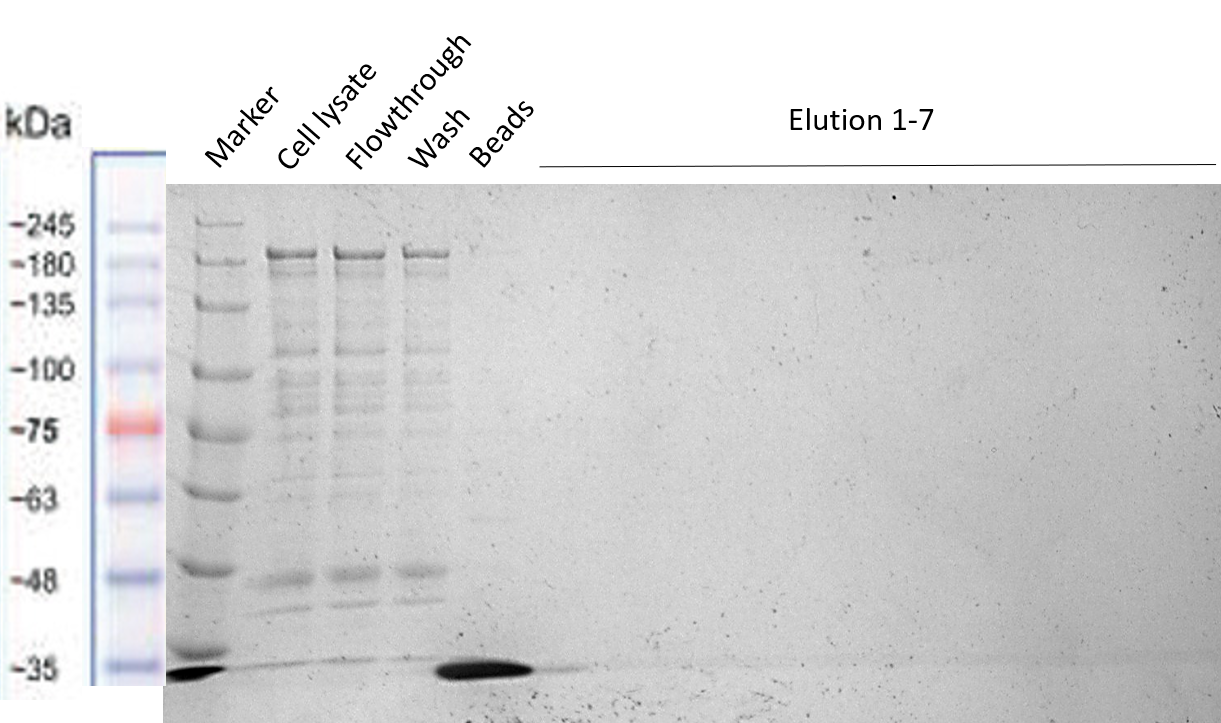
The reason to include a Strep-tag at the end of our Full Construct was to facilitate its purification. However, as already explained in the Registry page of the Strep-tag itself BBa_K823038, this BioBrick seems to not be working properly for column purification. The Strep-tag is probably meant to be used for Western Blots and not for column purification. That is why the purification via Strep-tag did not work (see Figure below). However, it was shown in the section before, that we were able to successfully purify it via the MBP.
Sequence
NOTE: For some reason the specified scar when aploaded the sequence was the one of the RFC25 standard but the registry shows the one of the RFC23
- 10COMPATIBLE WITH RFC[10]
- 12INCOMPATIBLE WITH RFC[12]Illegal NheI site found at 2302
Illegal NheI site found at 5500 - 21INCOMPATIBLE WITH RFC[21]Illegal BglII site found at 381
Illegal BglII site found at 5742
Illegal BamHI site found at 4581
Illegal BamHI site found at 5314
Illegal XhoI site found at 5826 - 23COMPATIBLE WITH RFC[23]
- 25COMPATIBLE WITH RFC[25]
- 1000INCOMPATIBLE WITH RFC[1000]Illegal BsaI site found at 79
References
| None |


