
 1 Registry Star
Part:BBa_I746909
superfolder GFP driven by T7 promoter
This is one of the constructs used to characterise superfolder GFP (see I746916 part description and http://openwetware.org/wiki/IGEM:Cambridge/2008/Improved_GFP for source and other information about this GFP variant)
iGEM TUDelft 2019
2019 iGEM TUDelftcharacterized this part in vitro.Summary
We performed an in vitro characterization of https://parts.igem.org/Part:BBa_I746909 by expressing the construct in a cell-free expression system and following the transcription and translation kinetics overtime using the plate-reader. We confirmed that the construct can be successfully expressed in vitro, leading to transcription and translation products already after one hour of expression. We believe that confirming construct activity and performing kinetics measurements using a cell-free expression system is a valid contribution to the development of the iGEM cell-free chassis data collection.
Overview
Protein production by cell-free expression systems, offers several advantages over in vivo protein production methods and is gaining more and more attention within the iGEM community. To increase the data collection and the characterization of the “iGEM cell-free chassis” parts we decided to follow the transcription and translation kinetics of this construct, which means we are following the RNA and protein that are being produced overtime in an environment with predetermined T7 RNA Polymerase concentration. Instead of using cell lysate we opted for the Protein Synthesis Using Recombinant Elements (PURE) system. The PURE system contains all the purified components found to be sufficient for the reactions involved in protein synthesis. The choice for a system that rely on purified protein is based on the fact that all the components of the system are known, this increases the controllability and the understanding of the processes undergoing in the expression reaction, thus allowing us to obtain a specific understanding of the construct undergoing characterization.
Method
The PUREfrex® system (GeneFrontier Corporation, Japan) is used for cell-free gene expression of construct to be characterized. Specifically, we employed PUREfrex®2.0 for its high protein yield and its prolonged expression lifetime in bulk.
The PUREfrex® kit consists of three separate solution:
- Solution 1: Solution I contains amino acids, NTPs, tRNAs and substrates for enzymes.
- Solution 2: Solution II consists of purified proteins involved in T7 RNAP based transcription and translational cofactors.
- Solution 3: Solution III contains 20 μM ribosomes, allowing for the translation of proteins.
The samples were:
- Blank: Blank: Solution I + SYBR Green
- DNA background: Solution I + BBa_I746909 (120 ng of DNA) + SYBRsafe(™)
- RNA measurement: Solution I + Solution I + BBa_I746909 (120 ng of DNA) + SYBRsafe(™)
- Protein measurement: Solution I + Solution II + Solution III + BBa_I746909 (120 ng of DNA)
Results
Successful cell-free expression of the construct BBa_I746909 was demonstrated.
The following graphs were generated and a logistic growth curve was fitted to the data.

Figure 1: GFP fluorescence timecourse over a period of 7 hours in PURE system.
Protein expression was followed for 7 hours, when the fluorescence (expression of GFP) is plotted over time, a classical sigmoidal expression curve could be observed (Figure 1). A logistic growth curve was fitted to the data:
f(t) = 24902.00/(1 + exp(-0.0144*(t-132.248)))
Since there was no absolute GFP standard only relative fluorescent levels are displayed. The protein expression showed a linear component of 200 minutes and reached a plateau after 7 hours. The fluorescent signal increase of 8.4 fold within the expression window.

Figure 2: RNA SYBR green fluorescence timecourse over a period of 7 hours in PURE system.
RNA production over time was followed in an expressing reaction deprived from ribosomes and containing SYBRsafe(™), a fluorescent intercalating DNA dye.The time course reaction of SYBRsafe(™) measurement is shown in Figure 2.
The RNA production curve was fitted using a logistic fit:
f(t) = 275.209/(1 + exp(-0.0062*(t+179.5988)))
The curve indicates a quick raise in RNA levels with a linear increase for 100 minutes and then flattening of to a plateau after 7 hours. The fluorescent signal observed in the first 20 minutes shows a sharp drop in intensity which seems to be due to an artifact of the DNA dye itself. The fluorescent signal increase of 1.3 fold within the expression window.
After 7 hours of expression, the RNA of the sample was isolated, purified and measured with a spectrophotometer. The reaction reached a final RNA concentration of 267.7 +- 2.75 ng.
Characterization: PR4 vs. T7


Group: Queens_Canada, 2019
Author: Ruben Warkentin
Summary: We compared the amount of GFP expressed under a constitutive promoter (medium promoter, strong RBS) to T7 expression. Some proteins fold better under constitutive promoters; however, nobody had yet directly compared the amount of protein produced between constitutive vs. T7 expression.
Methods
BioBricks were transformed and expressed in E. coli (BL21). BL21 cells were cultured to an OD600=0.6 and 100 uL of culture was transferred into a 96 well plate. Colonies were transfered in quadruplicate. The fluorescence intensity of GFP was measured with a multi-mode microplate reader. The iGEM standardized fluorescence protocol was used for fluorescence measurement standardization (https://www.protocols.io/view/calibration-protocol-plate-reader-fluorescence-cal-6zrhf56).
Results
We found that the T7 promoter produced about 2.6 times as much fluorescent signal as the constitutive PR4 promoter, indicating that T7 is much more efficient at producing GFP (Fig. 5). Interestingly, the production of GFP under PR4 did not increase beyond the level observed at 4 hours after inoculation. It seems that PR4 leads to an initial production of protein; however, after the initial expression the promoter seems to be shut off.

Promoter and RBS:
PR4: medium Promoter (J23110) strong RBS (B0034)
T7: T7 Promoter (BBa_I746909)
| sample | PR4 | T7 |
| Fluorescence 4 hrs (a.u.) | 2.24E+05 | 3.09E+05 |
| Fluorescence 16 hrs (a.u.) | 2.48E+05 | 8.00E+05 |
University of Exeter 2019's Characterisation
Experimental Data Collection
Plasmid pSB1C3-BBa_I746909 was extracted from the distribution kit and initially transformed into E. coli DH5α, for amplification, before transformation into E. coli BL21 and E. coli BL21(DE3). For transformation into E. coli BL21(DE3)pLysS, which is resistant to chloramphenicol, BBa_I746909 had to be cloned into an ampicillin resistant plasmid (pX1800) using restriction enzymes EcoRI and PstI (see protocols page). Cultures of E. coli carrying either pSB1C3-BBa_I746909 or pX1800-BBa_I746909 were grown in LB media with either 35μg/ml chloramphenicol or 100 μg/ml ampicillin as appropriate, in 96 well plates (200μl) at 37°C, 800 rpm. Cell growth was monitored by Optical Density (OD) at 600 nm (Tecan Infinite Plate reader) and calibrated using Cospheric monodisperse silica microspheres of a comparable size to E. coli (0.961 μm) (see Figure 1 below). Expression of sGFP was induced with 200μM of IPTG at an OD of 0.4. Protein expression was monitored by fluorescence (488 nm excitation, 520 nm emission) and calibrated using fluorescein isothiocyanate (see figure 2 below). After 24 h growth sGFP expression in individual cells was monitored by fluorescence using a BD FACS AriaIII Flow Cytometer (excitation laser (blue) 488 nm, emission 530/30 nm). Molecules of equivalent soluble fluorophore was calculated from a standard curve generated by running Takara Clontech AcGFP Calibration Beads with the same settings (see Figure 3 below). In addition, cell morphology was investigated using an Image Stream Mark II (Amnis-Luminex Corp.) Imaging Flow Cytometer configured with Bright Field (white light), Side-Scatter (785 nm) and GFP (excitation laser 488 nm, emission 533/55 nm).
Calibration
Although the iGEM InterLab study was not run this year we wanted to ensure that any fluorescence data that we reported was presented as comparable units rather than arbitrary units (AU) {iGEM ref}. We therefore followed the 2018 iGEM InterLab plate reader protocol to convert OD measurements to estimated number of cells. We performed a serial dilution of a known concentration of silica beads, measured the OD and produced the calibration curve in Figure 1.
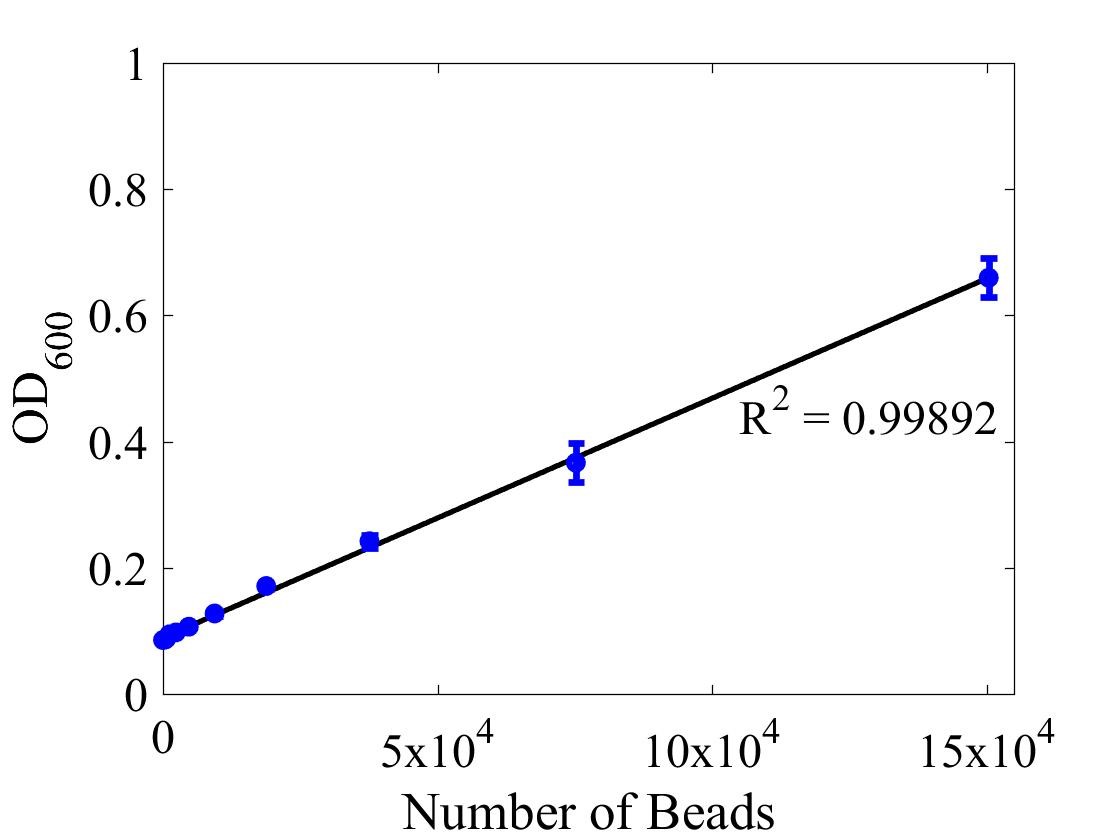
Figure 1: Graph showing optical density, measured at 600 nm, vs the number of silica beads. Measured in a 96 well plate with 200μl volumes. Error bars represent standard error of the mean, n = 4.
For bulk fluorescent measurements, again we followed 2018 iGEM InterLab plate reader protocol, by performing a serial dilution of a known concentration of fluorescein, measured fluorescence using the same excitation and emission wavelengths required by sGFP and produced the calibration curve in Figure 2.
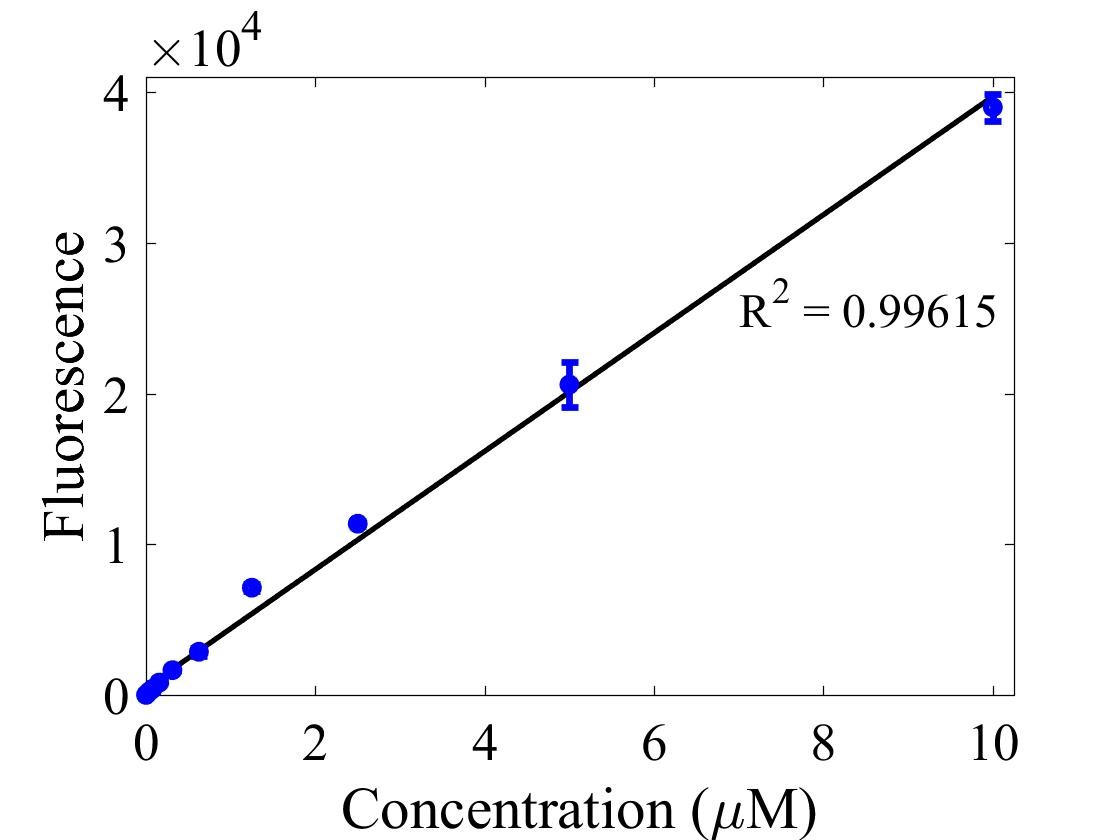
Figure 2. Graph showing fluorescence, measured at 488 nm excitation wavelength, 520 nm emission wavelength, vs concentration of fluorescein. Measured in a 96 well plate with 200μl volumes. Error bars represent standard error of the mean, n = 4.
The two calibration curves were then used to calculate Molecules of Equivalent Soluble Fluorophore (MESF) of each culture.
AcGFP Flow Cytometer Calibration beads consist of a mixture of six distinct populations that vary in the number of attached AcGFP molecules giving each population a distinct fluorescence.
Takara Clontech report a value for the corresponding Molecular Equivalent of Soluble Fluorophore (MESF) for each peak. The resulting histogram (Figure 3) was used to generate a standard curve of MESF vs fluorescence using the Flow Cytometer software, FlowJo.
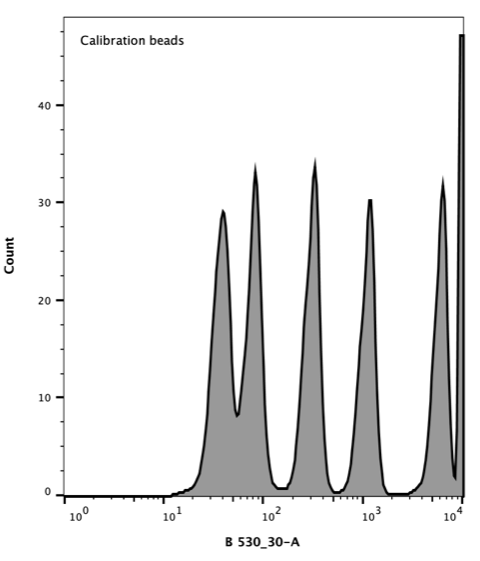
Figure 3. Flow cytometer histogram of AcGFP calibration beads. Excitation with 488 nm laser (blue), emission 530/30 nm.
Results
Growth of E. coli BL21-pSB1C3-BBa_I746909,E. coli BL21(DE3)-pSB1C3-BBa_I746909 and E. coli BL21(DE3)pLysS-pX1800-BBa_I746909 was monitored over 24 h and OD data converted to estimated number of cells using the calibration curve above, Figure 4.
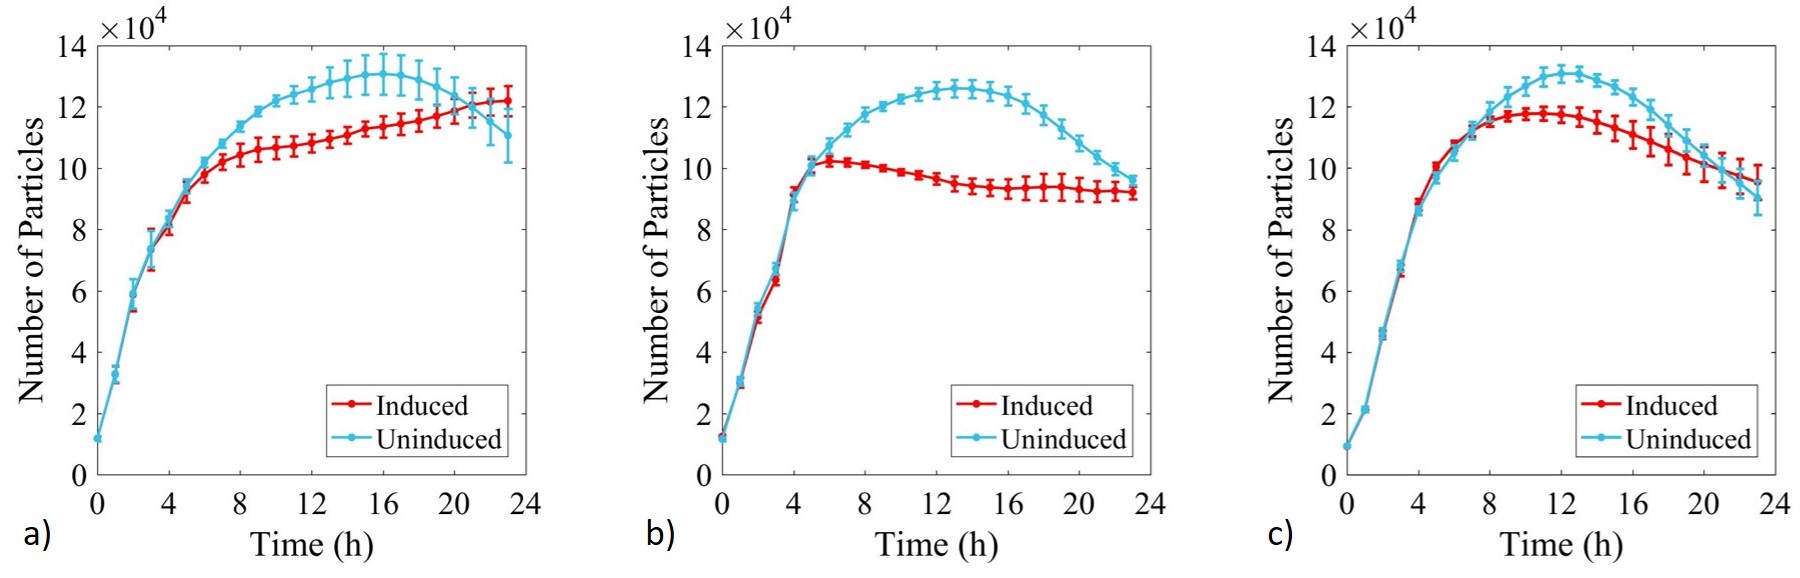
Figure 4: Calibrated growth curve data monitoring increase in number of estimated cells with time in cultures of: a) E. coli BL21-pSB1C3-BBa_I746909; b) E. coli BL21(DE3)-pSB1C3-BBa_I746909; and c) E. coli BL21(DE3)pLysS-pX1800-BBa_I746909. Measured in a 96 well plate with 200μl volumes. At OD = 0.4 sGFP expression was induced in half of the well cultures with 200μM of IPTG. Error bars represent standard error of the mean, n = 4.
Growth of uninduced cultures was consistent between strains and did not depend on type of antibiotic, with log phase lasting between 0 and 8 h. Addition of IPTG inhibited growth in all three cultures but more significantly in E. coli BL21(DE3)-pSB1C3-BBa_I746909 and E. coli BL21(DE3)pLysS-pX1800-BBa_I746909 where protein expression was expected.
Expression of sGFP was monitored during culture growth in the same experiment as above. Data was calibrated using the standard curves and presented in Figure 5.
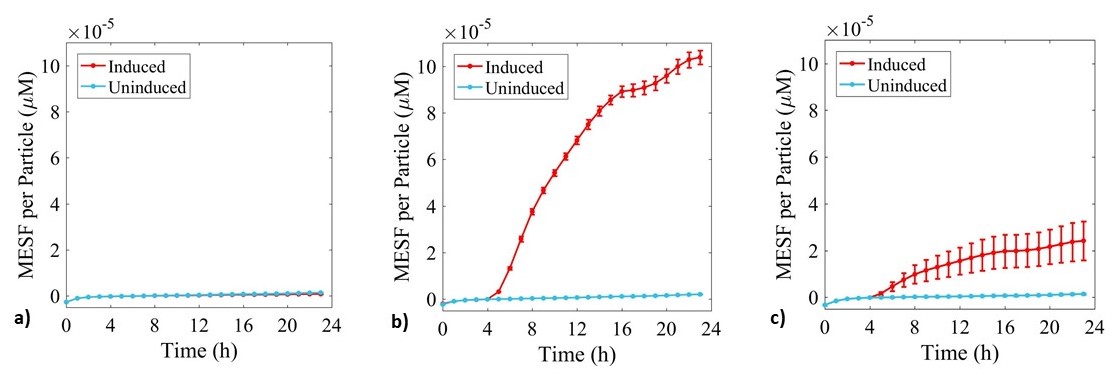
Figure 5: Fluorescence data monitoring increase in MESF with time in cultures of: a) E. coli BL21-pSB1C3-BBa_I746909; b) E. coli BL21(DE3)-pSB1C3-BBa_I746909; and c) E. coli BL21(DE3)pLysS-pX1800-BBa_I746909. Measured in a 96 well plate with 200μl volumes. At OD = 0.4 sGFP expression was induced in half of the well cultures with 200μM of IPTG. Error bars represent standard error of the mean, n = 4.
As expected, no sGFP expression was observed in cultures of E. coli BL21-pSB1C3-BBa_I746909 with or without addition of IPTG. Only after induction with IPTG was sGFP expression observed in cultures of E. coli BL21(DE3)-pSB1C3-BBa_I746909 and E. coli BL21(DE3)pLysS-pX1800-BBa_I746909 indicating that in this experiment there was no leakiness from the T7 promoter. Less sGFP expression was seen in cultures of E. coli BL21(DE3)pLysS-pX1800-BBa_I746909. Therefore, we concluded that for expression of the PETase and MHETase enzymes in our project, DE3 carrying E. coli strains would have sufficient control over expression from the T7 promoter and the additional pLysS was not required.
After 24 h, expression of sGFP in individual cells was determined via flow cytometry, Figure 6.
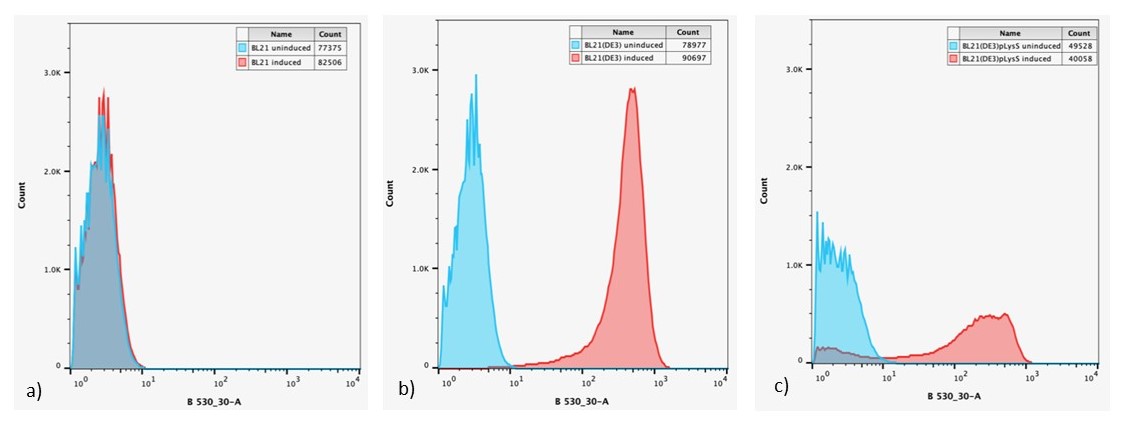
Figure 6: Overlaid flow cytometry histograms uninduced and induced cultures of: a) E. coli BL21-pSB1C3-BBa_I746909; b) E. coli BL21(DE3)-pSB1C3-BBa_I746909; and c) E. coli BL21(DE3)pLysS-pX1800-BBa_I746909 after 24 h growth.
Expression of sGFP, measured by fluorescence is only seen in IPTG induced cultures of E. coli BL21(DE3)-pSB1C3-BBa_I746909 and E. coli BL21(DE3)pLysS-pX1800-BBa_I746909, confirming the bulk fluorescence measurements. The lower expression seen in the bulk cultures of E. coli BL21(DE3)pLysS-pX1800-BBa_I746909 appear to arise from the fact that only a small population of cells are giving rise to the bulk fluorescent signal, rather than all cells having a lower fluorescence.
The geometric mean of MESF per cell for each population was calculated using the FlowJo flow cytometry software and presented in Figure 7.
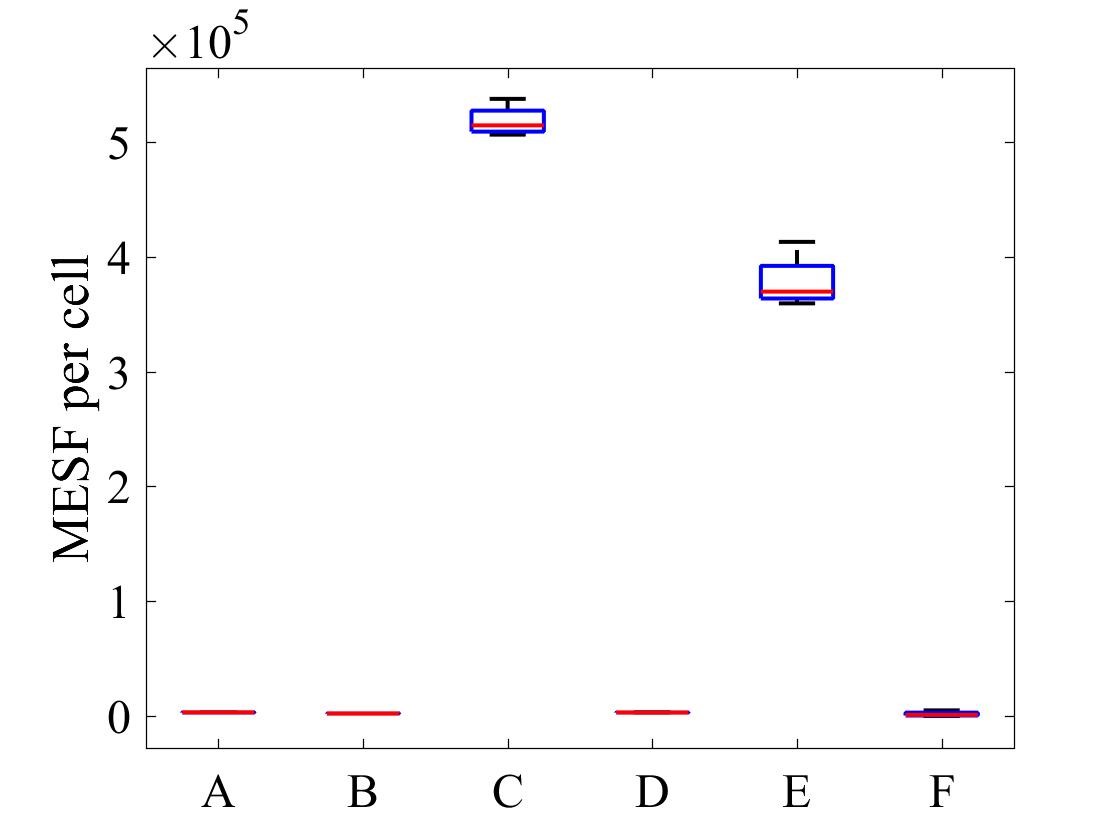
Figure 7: MESF per cell for E .coli strains A) E. coli BL21-pSB1C3-BBa_I746909 induced, B) E. coli BL21-pSB1C3-BBa_I746909 uninduced, C) E. coli BL21(DE3)-pSB1C3-BBa_I746909 induced, D) E. coli BL21(DE3)-pSB1C3-BBa_I746909uninduced, E) E. coli BL21(DE3)pLysS-pX1800-BBa_I746909 induced, F) E. coli BL21(DE3)pLysS-pX1800-BBa_I746909 uninduced; Data gathered from the geometric mean of FACS plots.
The data from flow cytometry indicated that for over-expression and purification of our PETase and MHETase enzymes for use in our washing machine filter, pLysS containing E. coli strains would decrease the efficiency of production. Finally, the lab we were working in has an Imaging Flow Cytometer, which gave us an excellent opportunity to look at the cell morphology during expression of sGFP, Figure 8.
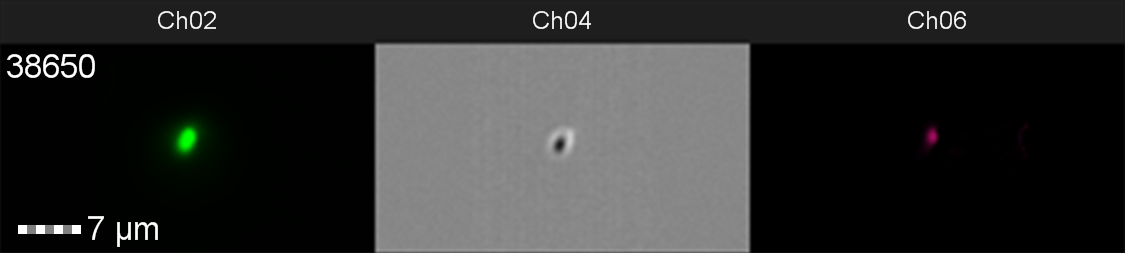
Figure 8: Image: screen capture of an induced E. coli BL21(DE3)pLysS cell. Channel 2 (Ch02) shows sGFP fluorescence at 533/55 nm, Channel 4 (Ch04) shows the corresponding bright field image and Channel 6 (Ch06) shows side scatter.
Conclusion
The results from this bronze medal study, investigating the ‘leakiness’ of the T7 promoter, show that in our lab expression from the T7 promoter is sufficiently controlled in strains of E. coli carrying DE3 only and therefore plasmids carrying our PETase and MHETase genes should not affect cell growth until expression of the enzymes is induced. In addition, strains carrying pLysS could reduce the overall expression of our enzymes, limiting the amount we could produce for our washing machine filter.
- 10COMPATIBLE WITH RFC[10]
- 12COMPATIBLE WITH RFC[12]
- 21COMPATIBLE WITH RFC[21]
- 23COMPATIBLE WITH RFC[23]
- 25COMPATIBLE WITH RFC[25]
- 1000INCOMPATIBLE WITH RFC[1000]Illegal SapI.rc site found at 62
| None |