
 1 Registry Star
Part:BBa_I746909
superfolder GFP driven by T7 promoter
This is one of the constructs used to characterise superfolder GFP (see I746916 part description and http://openwetware.org/wiki/IGEM:Cambridge/2008/Improved_GFP for source and other information about this GFP variant)
2019 iGEM team Gunma Japan
<a href="https://2019.igem.org/Team:Gunma">2019 iGEM team Gunma Japan</a>validated this part in BL21(DE3).
</html>

Fig.1 This is our Abs600 Standard Curve measured by PerkinElmer,Multipmode Plate Reader.

Fig.2 This is our Fluorescein Standard Curve measured by PerkinElmer,Multipmode Plate Reader(Exc485 nm,Ems530 nm).

Fig.3 This figure shows the fluorescence is highly proportional to Abs600,the concentration of microorganisms. This means the GFP fluorescence is to be precisely expressed by the microorganisms. One colony of BE21(DE3)pSB1C3 BBa I746909 each from 2 plates were picked and cultured in 5 mL LB medium with 34 μL/mL Cam for 6.25 hours in falcon tubes,37℃. We conducted 2 biological and 4 technical replicates. Then these are diluted to be OD600 = 0.1.before added 500 μM IPTG.Abs600 and fluorescence of GFP were measured.All measurements went on under controlled temperature (25 ℃).


Fig.4,5 We also checked whether the colonies on plates are expressing GFP that derives from pSB1C3 BBa I746909 by directly putting 100 μM and 300 μM IPTG onto the colonies in hemisphere by pipettes.We note that this also means we could check the appropriate concentration for this time, for the teams who read this later.100 μM worked enough, but 300 μM seemed to have induced GFP more strongly.We recommend you 300 μM as a better choice.

Fig.6 The plates were also observed under visible light.We spotted a strong light toward the plates for 10 sec in advance to emphasize the difference between them.

Fig.7 The BL21(DE3) in LB medium were also observed under visible light too. They were easily distinguished in room.
Improvement by Team Manchester 2019
This part was improved by Team Manchester 2019 (BBa_K2906000) by adding sfGFP to a pTet promoter. Fluorescence intensity is higher, especially during the first few hours, and gene expression is more tightly controlled. For more information please visit Team Manchester
Superfolder GFP also known as sfGFP is a GFP-derived green fluorescent protein. (Pédelacq et al., 2006). GFP is a protein isolated from the jellyfish Aequorea Victoria that exhibits green fluorescence when exposed to light in the blue to the ultraviolet range (Prendergast and Mann, 1978; Tsien, 1998). A series of mutations performed by Pédelacq et al. obtained a GFP variant able to rapidly fold and mature. This ultimately leads to enhanced fluorescence intensity (Frenzel et al., 2018). This composite part is made of sfGFP (BBa_K1321337) expressed by a Tet promoter (BBa_R0040). The protein is able to express colour and auto secrets to the media.

Characterisation:
To show whether this part worked, we decided to measure fluorescence, normalised by OD. Optical Density values were measured at 600 nm. We grew the cells to an OD600 of ~0.6 and induced them with 100 nM of anhydrotetracycline. Then, they were loaded in triplicates into a 96-well plate and left overnight. For OD values, the blank was LB media, and for RFU the blank was E. coli TOP10 since it does not express any colour. The values were individually normalised by dividing RFU/OD and then averaged to plot the mean against time. An RFU value of 0 corresponds to baseline E. coli TOP10 measurements.

Figure 1. The plot shows the mean RFU/OD from three replicates of each construct expressed in E. coli DH5⍺ and BL21(DE3). The OD was measured at 600 nm and GFP fluorescence was measured at Ex ƛ 485, Em ƛ 510, every 15 minutes for 13 hours. The RFU values were normalised by the OD and the triplicates averaged. All values have been blank-corrected. A total of 52 recordings were made per well, with three technical replicates per construct. 'Colour Alone' represents this part, pTet + sfGFP. The values suggest that sfGFP is expressed at very high levels in both DH5a and BL21(DE3).
We also wanted to visualise if the protein was being overexpressed and secreted across the bacterial membrane. We first calculated the expected size of sfGFP of our desired construct: 26.8 kDa molecular weight. Then samples were run on 10% gels following SDS-PAGE protocol. Below we show the gel containing samples from the supernatant, which proves that this construct indeed auto secrets.

Qualitative Data:
Fluorescence Microscopy: After quantifying the data for sfGFP we decided to perform fluorescence microscopy. This would allow us to see the percentage of bacteria in a sample producing colour, as well as some phenotypic characteristics of the bacteria with the construct. Below you can see two images, the negative control, which was E. coli TOP10, showing very limited background GFP fluorescence, and BBa_K2906000, clearly showing the expression and functionality of sfGFP with Tet promoter.


Figure 2. Fluorescent microscopy overlaid images of phase contrast and GFP filter. a) Negative control (E. coli TOP10) showing very slight background readings for fluorescence. b) sfGFP with Tet (BBa_K2906000) showing significant levels of fluorescence in most bacteria. The images above are composite overlaid images made from phase contrast and GFP-filter captures. They were processed using ImageJ.
Colour:
The image below shows the visible colour of the pellet obtained under normal light and UV light. This was done at five different time points after induction with 100 nM of anhydrotetracycline. sfGFP with Tet is labelled ''Colour Alone'' and can be seen present in both DH5a and BL21.

This is an essential new part, as sfGFP is a very common reporter gene. Additionally, we show in our wiki Team Manchester how this is an improved part over the sfGFP provided by iGEM with a T7 promoter. We hope that this new part can be useful for future teams!
References:
Frenzel, E., Legebeke, J., Van Stralen, A., Van Kranenburg, R. and Kuipers, O. P. (2018) ‘In vivo selection of sfGFP variants with improved and reliable functionality in industrially important thermophilic bacteria’, Biotechnology for Biofuels. BioMed Central Ltd., 11(1). doi: 10.1186/s13068-017-1008-5.
Pédelacq, J. D., Cabantous, S., Tran, T., Terwilliger, T. C. and Waldo, G. S. (2006) ‘Engineering and characterization of a superfolder green fluorescent protein’, Nature Biotechnology, 24(1), pp. 79–88. doi: 10.1038/nbt1172.
Prendergast, F. G. and Mann, K. G. (1978) ‘Chemical and Physical Properties of Aequorin and the Green Fluorescent Protein Isolated from Aequorea forskålea†’, Biochemistry, 17(17), pp. 3448–3453. doi: 10.1021/bi00610a004.
Tsien, R. Y. (1998) ‘THE GREEN FLUORESCENT PROTEIN’, Annual Review of Biochemistry. Annual Reviews, 67(1), pp. 509–544. doi: 10.1146/annurev.biochem.67.1.509.
Part Improvement by addition of a new function - EPFL,2019
Group: EPFL, 2019
Summary:
During the development of our project, we decided to improve the "superfolder GFP driven by T7 promoter"
As we wanted to produce a signal only in case of the presence of the desired sequence, we needed to find a way to regulate the protein expression in our system. We achieved that by adding a Toehold, that has an integrated T7 promoter and a Ribosome Binding Site, before the encoded gene sequence. This procedure blocks the expression of sf GFP in absence of trigger DNA and and allows its expression only when the specific sequence is present in our sample.
With our improvement, sf GFP can now be used as a diagnostics tool for detection of Bois Noir disease in the grapevine.
The Toehold switch for Bois Noir 2.1 with superfolder GFP composite part was created with PCR. Specifically, we acquired the existing part in the distribution kit, and removed the promoter and RBS sequence. Then we run PCR with primers that had the sequence of the toehold already build-in.
Hypothesis and method:
We tested the functionality of the new part by expressing it in OnePot PURE cell-free system using the protocol in 5μl reactions (with and without triggering DNA) and measuring the excitation at wavelength of 535nm in a platereader at 37°C. We expected the sample without the triggering DNA to produce minimal amount of fluorescence due to unavoidable leakage, while the sample where the triggering DNA is included to be expressed normally.
Results:
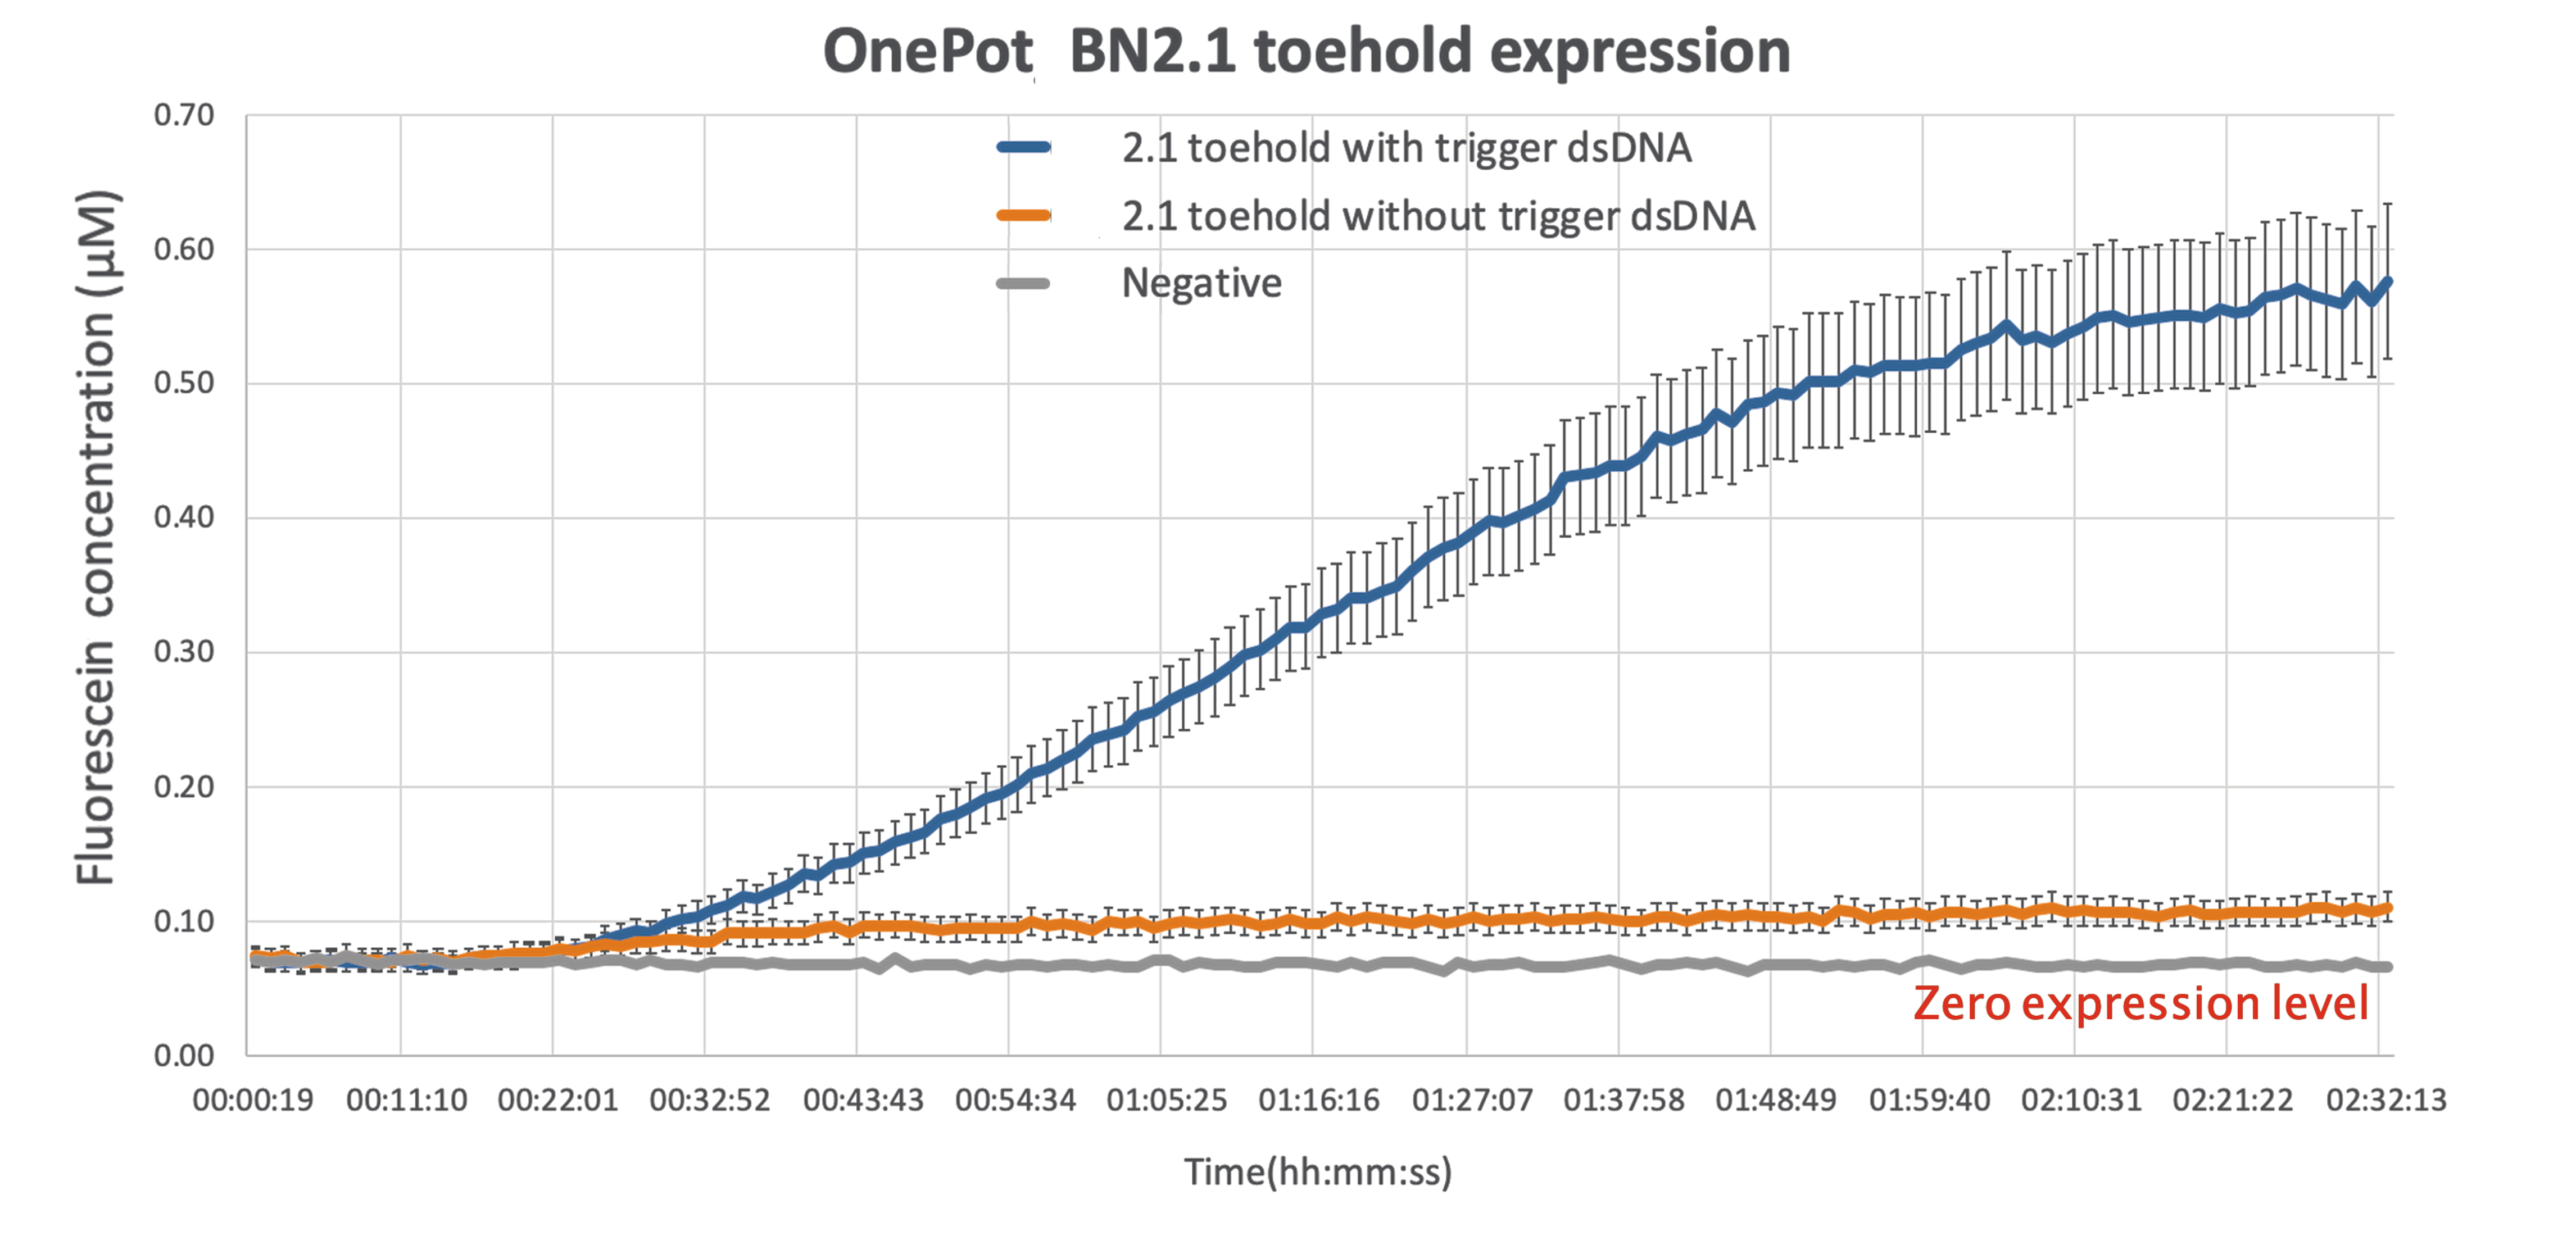
As expected there is some leakage present in the final results,but given that the output of the reading while the wanted sequence is present is more than 5-fold larger, there can be a clear distinction between the ON and OFF phase of the toehold.
This improvement can be act as a proof of concept, demonstrating the ability of sf GFP to be used as a diagnostics tool, simple by modifying the sequence toehold we are using to bind to any desired sequence.
iGEM TUDelft 2019
2019 iGEM TUDelftcharacterized this part in vitro.Summary
We performed an in vitro characterization of https://parts.igem.org/Part:BBa_I746909 by expressing the construct in a cell-free expression system and following the transcription and translation kinetics overtime using the plate-reader. We confirmed that the construct can be successfully expressed in vitro, leading to transcription and translation products already after one hour of expression. We believe that confirming construct activity and performing kinetics measurements using a cell-free expression system is a valid contribution to the development of the iGEM cell-free chassis data collection.
Overview
Protein production by cell-free expression systems, offers several advantages over in vivo protein production methods and is gaining more and more attention within the iGEM community. To increase the data collection and the characterization of the “iGEM cell-free chassis” parts we decided to follow the transcription and translation kinetics of this construct, which means we are following the RNA and protein that are being produced overtime in an environment with predetermined T7 RNA Polymerase concentration. Instead of using cell lysate we opted for the Protein Synthesis Using Recombinant Elements (PURE) system. The PURE system contains all the purified components found to be sufficient for the reactions involved in protein synthesis. The choice for a system that rely on purified protein is based on the fact that all the components of the system are known, this increases the controllability and the understanding of the processes undergoing in the expression reaction, thus allowing us to obtain a specific understanding of the construct undergoing characterization.
Method
The PUREfrex® system (GeneFrontier Corporation, Japan) is used for cell-free gene expression of construct to be characterized. Specifically, we employed PUREfrex®2.0 for its high protein yield and its prolonged expression lifetime in bulk.
The PUREfrex® kit consists of three separate solution:
- Solution 1: Solution I contains amino acids, NTPs, tRNAs and substrates for enzymes.
- Solution 2: Solution II consists of purified proteins involved in T7 RNAP based transcription and translational cofactors.
- Solution 3: Solution III contains 20 μM ribosomes, allowing for the translation of proteins.
The samples were:
- Blank: Solution I + SYBR Green
- DNA background: Solution I + BBa_I746909 (120 ng of DNA) + SYBRsafe(™)
- RNA measurement: Solution I + Solution I + BBa_I746909 (120 ng of DNA) + SYBRsafe(™)
- Protein measurement: Solution I + Solution II + Solution III + BBa_I746909 (120 ng of DNA)
Results
Successful cell-free expression of the construct BBa_I746909 was demonstrated.
The following graphs were generated and a logistic growth curve was fitted to the data.

Figure 1: GFP fluorescence timecourse over a period of 7 hours in PURE system.
Protein expression was followed for 7 hours, when the fluorescence (expression of GFP) is plotted over time, a classical sigmoidal expression curve could be observed (Figure 1). A logistic growth curve was fitted to the data:
f(t) = 24902.00/(1 + exp(-0.0144*(t-132.248)))
Since there was no absolute GFP standard only relative fluorescent levels are displayed. The protein expression showed a linear component of 200 minutes and reached a plateau after 7 hours. The fluorescent signal increase of 8.4 fold within the expression window.

Figure 2: RNA SYBR green fluorescence timecourse over a period of 7 hours in PURE system.
RNA production over time was followed in an expressing reaction deprived from ribosomes and containing SYBRsafe(™), a fluorescent intercalating DNA dye. The time course reaction of SYBRsafe(™) measurement is shown in Figure 2.
The RNA production curve was fitted using a logistic fit:
f(t) = 275.209/(1 + exp(-0.0062*(t+179.5988)))
The curve indicates a quick raise in RNA levels with a linear increase for 100 minutes and then flattening of to a plateau after 7 hours. The fluorescent signal observed in the first 20 minutes shows a sharp drop in intensity which seems to be due to an artifact of the DNA dye itself. The fluorescent signal increase of 1.3 fold within the expression window.
After 7 hours of expression, the RNA of the sample was isolated, purified and measured with a spectrophotometer. The reaction reached a final RNA concentration of 267.7 +- 2.75 ng.
Characterization: PR4 vs. T7


Group: Queens_Canada, 2019
Author: Ruben Warkentin
Summary: We compared the amount of GFP expressed under a constitutive promoter (medium promoter, strong RBS) to T7 expression. Some proteins fold better under constitutive promoters; however, nobody had yet directly compared the amount of protein produced between constitutive vs. T7 expression.
Methods
BioBricks were transformed and expressed in E. coli (BL21). BL21 cells were cultured to an OD600=0.6 and 100 uL of culture was transferred into a 96 well plate. Colonies were transfered in quadruplicate. The fluorescence intensity of GFP was measured with a multi-mode microplate reader. The iGEM standardized fluorescence protocol was used for fluorescence measurement standardization (https://www.protocols.io/view/calibration-protocol-plate-reader-fluorescence-cal-6zrhf56).
Results
We found that the T7 promoter produced about 2.6 times as much fluorescent signal as the constitutive PR4 promoter, indicating that T7 is much more efficient at producing GFP (Fig. 5). Interestingly, the production of GFP under PR4 did not increase beyond the level observed at 4 hours after inoculation. It seems that PR4 leads to an initial production of protein; however, after the initial expression the promoter seems to be shut off.

Promoter and RBS:
PR4: medium Promoter (J23110) strong RBS (B0034)
T7: T7 Promoter (BBa_I746909)
| sample | PR4 | T7 |
| Fluorescence 4 hrs (a.u.) | 2.24E+05 | 3.09E+05 |
| Fluorescence 16 hrs (a.u.) | 2.48E+05 | 8.00E+05 |
University of Exeter 2019's Characterisation
Introduction
The T7 promoter comes from the T7 bacteriophage and is a lac-promoter, (Studier et al (1990) Meth. Enzymol. 10:605). Lac-promoters can be leaky, meaning that there is incomplete repression of gene expression. As we wanted to use the T7 promoter in our project, the main aim of these experiments was to determine how leaky the T7 promoter actually is by using the BBa_I746909 part from Cambridge 2008. We decided to investigate the ‘leakiness’ of sGFP expression under control of the T7 promoter in three E. coli expression strains. E. coli BL21 is the most widely used strain of E. coli used for protein expression, however expression from a T7 promoter requires T7 polymerase which the wild type strain does not possess. Therefore, we should expect to see no sGFP expression from these cultures. E. coli BL21(DE3) carries the lambda prophage necessary for ITPG inducible expression from the T7 promoter (Studier et al (1986) J. Mol. Biol. 189:113). As stated above the T7 promoter is known to be leaky therefore, E. coli BL21(DE3)pLysS carries an additional plasmid that encodes T7 lysozyme (Moffatt & Studier (1987) Cell. 49:221). This is a natural inhibitor of T7 RNA polymerase that serves to repress basal expression of target genes under the control of the T7 promoter. In these cultures, we expect to see no sGFP expression before induction with IPTG.
Experimental Data Collection
Plasmid pSB1C3-BBa_I746909 was extracted from the distribution kit and initially transformed into E. coli DH5α, for amplification, before transformation into E. coli BL21 and E. coli BL21(DE3). For transformation into E. coli BL21(DE3)pLysS, which is resistant to chloramphenicol, BBa_I746909 had to be cloned into an ampicillin resistant plasmid (pX1800) using restriction enzymes EcoRI and PstI (see protocols page). Cultures of E. coli carrying either pSB1C3-BBa_I746909 or pX1800-BBa_I746909 were grown in LB media with either 35μg/ml chloramphenicol or 100 μg/ml ampicillin as appropriate, in 96 well plates (200μl) at 37°C, 800 rpm. Cell growth was monitored by Optical Density (OD) at 600 nm (Tecan Infinite Plate reader) and calibrated using Cospheric monodisperse silica microspheres of a comparable size to E. coli (0.961 μm) (see Figure 1 below). Expression of sGFP was induced with 200μM of IPTG at an OD of 0.4. Protein expression was monitored by fluorescence (488 nm excitation, 520 nm emission) and calibrated using fluorescein isothiocyanate (see figure 2 below). After 24 h growth sGFP expression in individual cells was monitored by fluorescence using a BD FACS AriaIII Flow Cytometer (excitation laser (blue) 488 nm, emission 530/30 nm). Molecules of equivalent soluble fluorophore was calculated from a standard curve generated by running Takara Clontech AcGFP Calibration Beads with the same settings (see Figure 3 below). In addition, cell morphology was investigated using an Image Stream Mark II (Amnis-Luminex Corp.) Imaging Flow Cytometer configured with Bright Field (white light), Side-Scatter (785 nm) and GFP (excitation laser 488 nm, emission 533/55 nm).
Calibration
Although the iGEM InterLab study was not run this year we wanted to ensure that any fluorescence data that we reported was presented as comparable units rather than arbitrary units (AU) (Beal et al (2018) PLOS One 13:e0199432). We therefore followed the 2018 iGEM InterLab plate reader protocol to convert OD measurements to estimated number of cells. We performed a serial dilution of a known concentration of silica beads, measured the OD and produced the calibration curve in Figure 1.
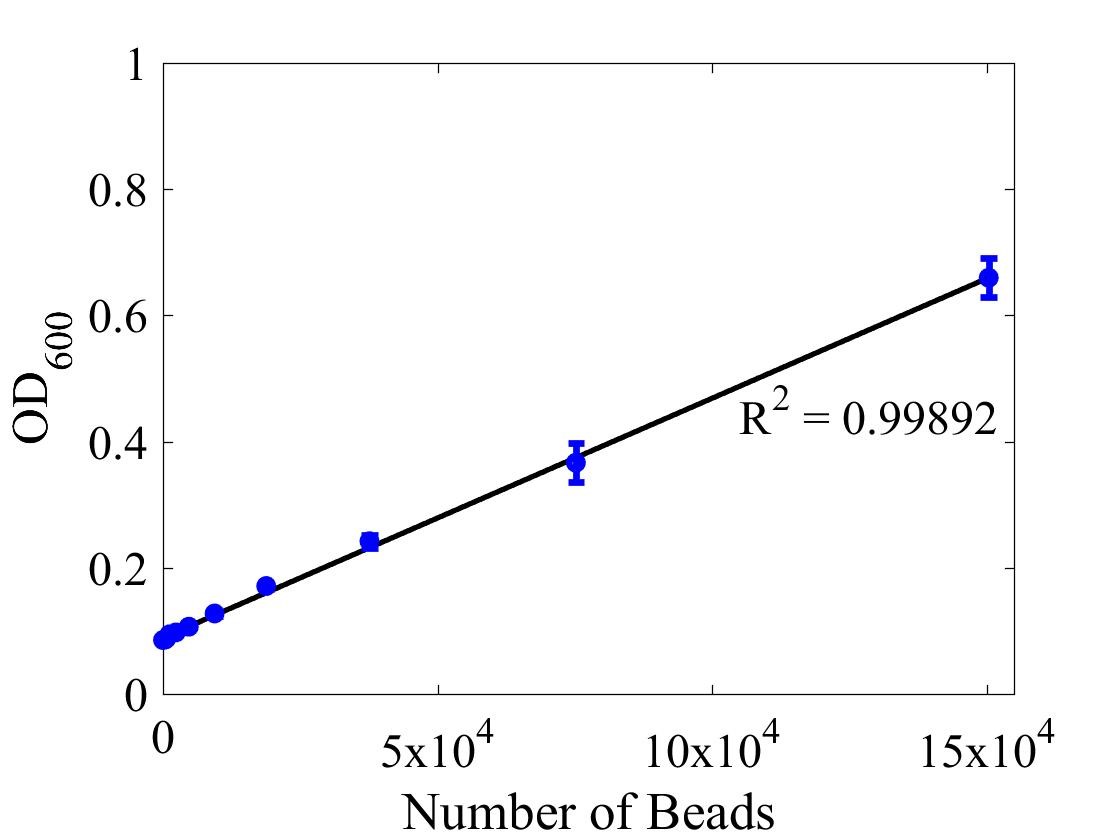
Figure 1: Graph showing optical density, measured at 600 nm, vs the number of silica beads. Measured in a 96 well plate with 200μl volumes. Error bars represent standard error of the mean, n = 4.
For bulk fluorescent measurements, again we followed 2018 iGEM InterLab plate reader protocol, by performing a serial dilution of a known concentration of fluorescein, measured fluorescence using the same excitation and emission wavelengths required by sGFP and produced the calibration curve in Figure 2.
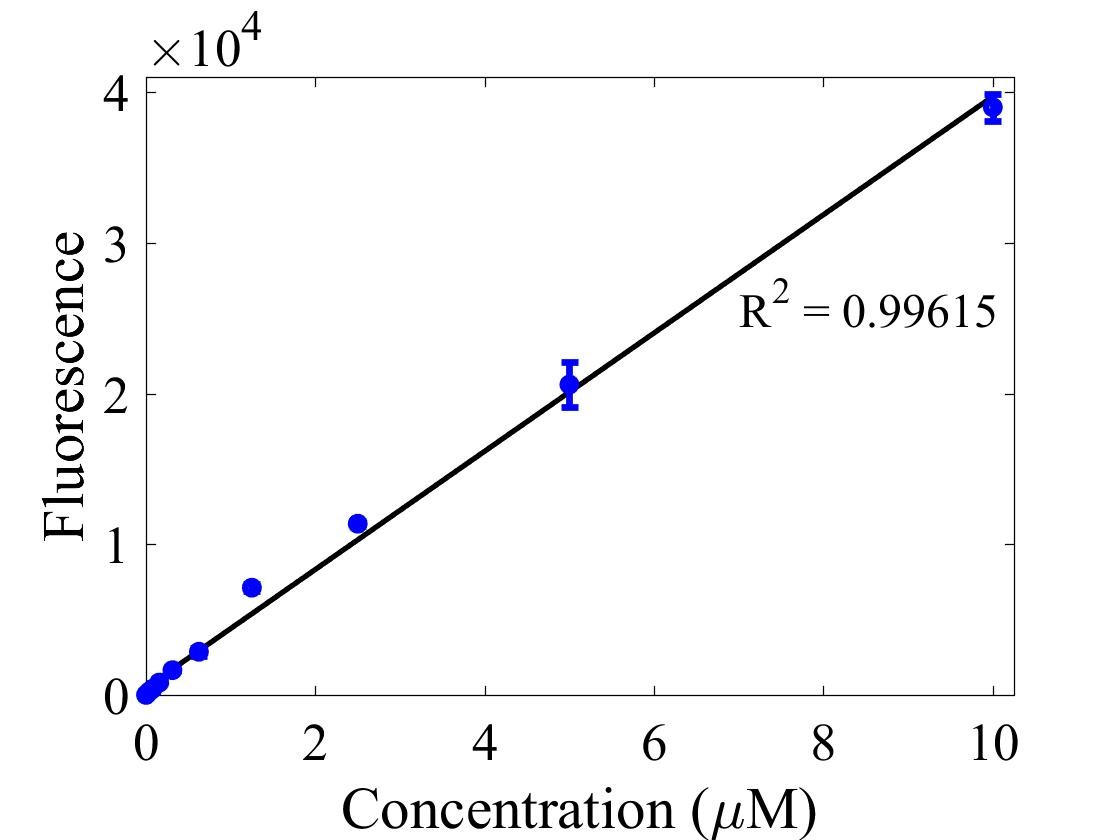
Figure 2. Graph showing fluorescence, measured at 488 nm excitation wavelength, 520 nm emission wavelength, vs concentration of fluorescein. Measured in a 96 well plate with 200μl volumes. Error bars represent standard error of the mean, n = 4.
The two calibration curves were then used to calculate Molecules of Equivalent Soluble Fluorophore (MESF) of each culture.
AcGFP Flow Cytometer Calibration beads consist of a mixture of six distinct populations that vary in the number of attached AcGFP molecules giving each population a distinct fluorescence.
Takara Clontech report a value for the corresponding Molecular Equivalent of Soluble Fluorophore (MESF) for each peak. The resulting histogram (Figure 3) was used to generate a standard curve of MESF vs fluorescence using the Flow Cytometer software, FlowJo.
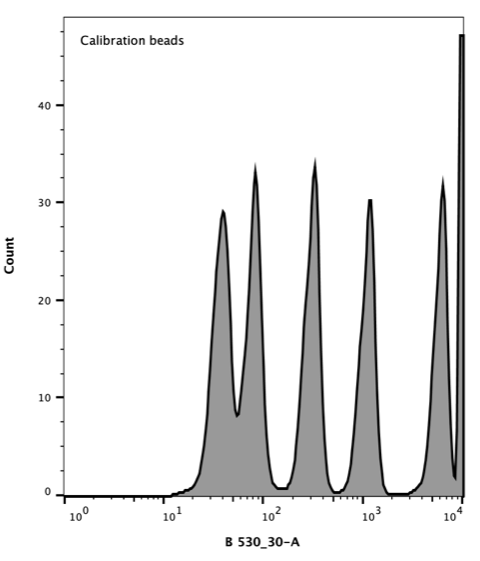
Figure 3. Flow cytometer histogram of AcGFP calibration beads. Excitation with 488 nm laser (blue), emission 530/30 nm.
Results
Growth of E. coli BL21-pSB1C3-BBa_I746909,E. coli BL21(DE3)-pSB1C3-BBa_I746909 and E. coli BL21(DE3)pLysS-pX1800-BBa_I746909 was monitored over 24 h and OD data converted to estimated number of cells using the calibration curve above, Figure 4.
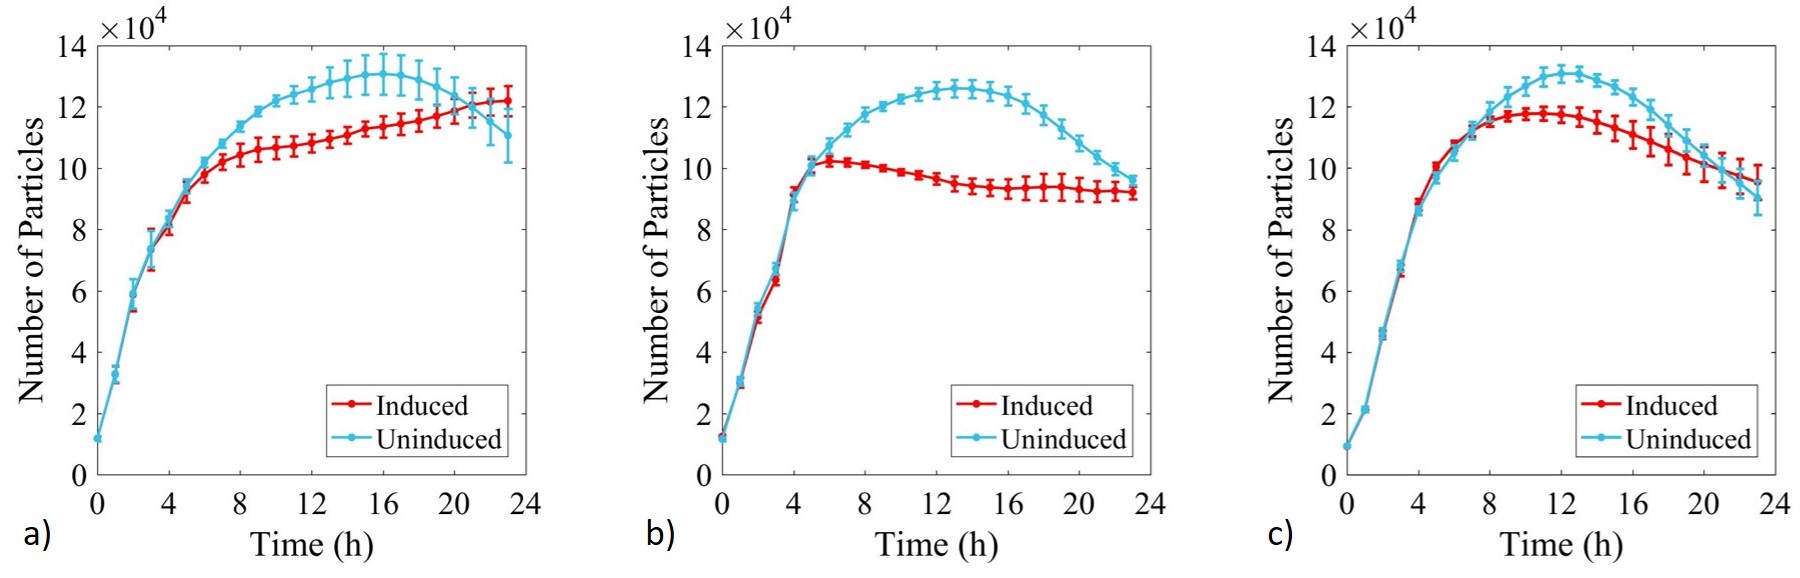
Figure 4: Calibrated growth curve data monitoring increase in number of estimated cells with time in cultures of: a) E. coli BL21-pSB1C3-BBa_I746909; b) E. coli BL21(DE3)-pSB1C3-BBa_I746909; and c) E. coli BL21(DE3)pLysS-pX1800-BBa_I746909. Measured in a 96 well plate with 200μl volumes. At OD = 0.4 sGFP expression was induced in half of the well cultures with 200μM of IPTG. Error bars represent standard error of the mean, n = 4.
Growth of uninduced cultures was consistent between strains and did not depend on type of antibiotic, with log phase lasting between 0 and 8 h. Addition of IPTG inhibited growth in all three cultures but more significantly in E. coli BL21(DE3)-pSB1C3-BBa_I746909 and E. coli BL21(DE3)pLysS-pX1800-BBa_I746909 where protein expression was expected.
Expression of sGFP was monitored during culture growth in the same experiment as above. Data was calibrated using the standard curves and presented in Figure 5.
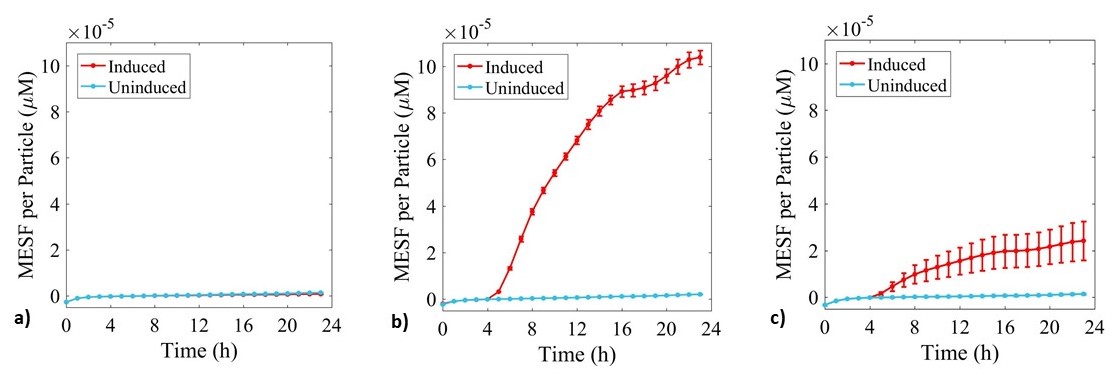
Figure 5: Fluorescence data monitoring increase in MESF with time in cultures of: a) E. coli BL21-pSB1C3-BBa_I746909; b) E. coli BL21(DE3)-pSB1C3-BBa_I746909; and c) E. coli BL21(DE3)pLysS-pX1800-BBa_I746909. Measured in a 96 well plate with 200μl volumes. At OD = 0.4 sGFP expression was induced in half of the well cultures with 200μM of IPTG. Error bars represent standard error of the mean, n = 4.
As expected, no sGFP expression was observed in cultures of E. coli BL21-pSB1C3-BBa_I746909 with or without addition of IPTG. Only after induction with IPTG was sGFP expression observed in cultures of E. coli BL21(DE3)-pSB1C3-BBa_I746909 and E. coli BL21(DE3)pLysS-pX1800-BBa_I746909 indicating that in this experiment there was no leakiness from the T7 promoter. Less sGFP expression was seen in cultures of E. coli BL21(DE3)pLysS-pX1800-BBa_I746909. Therefore, we concluded that for expression of the PETase and MHETase enzymes in our project, DE3 carrying E. coli strains would have sufficient control over expression from the T7 promoter and the additional pLysS was not required.
After 24 h, expression of sGFP in individual cells was determined via flow cytometry, Figure 6.
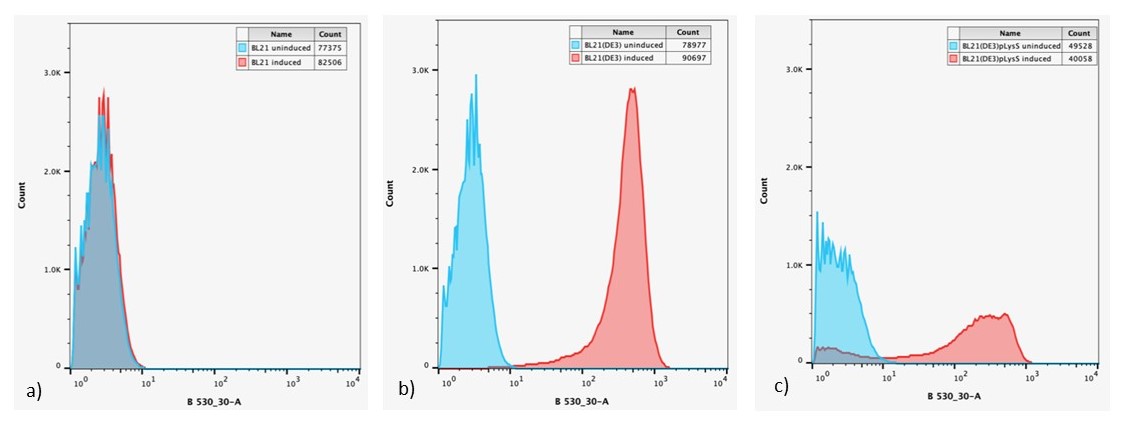
Figure 6: Overlaid flow cytometry histograms uninduced and induced cultures of: a) E. coli BL21-pSB1C3-BBa_I746909; b) E. coli BL21(DE3)-pSB1C3-BBa_I746909; and c) E. coli BL21(DE3)pLysS-pX1800-BBa_I746909 after 24 h growth.
Expression of sGFP, measured by fluorescence is only seen in IPTG induced cultures of E. coli BL21(DE3)-pSB1C3-BBa_I746909 and E. coli BL21(DE3)pLysS-pX1800-BBa_I746909, confirming the bulk fluorescence measurements. The lower expression seen in the bulk cultures of E. coli BL21(DE3)pLysS-pX1800-BBa_I746909 appear to arise from the fact that only a small population of cells are giving rise to the bulk fluorescent signal, rather than all cells having a lower fluorescence.
The geometric mean of MESF per cell for each population was calculated using the FlowJo flow cytometry software and presented in Figure 7.
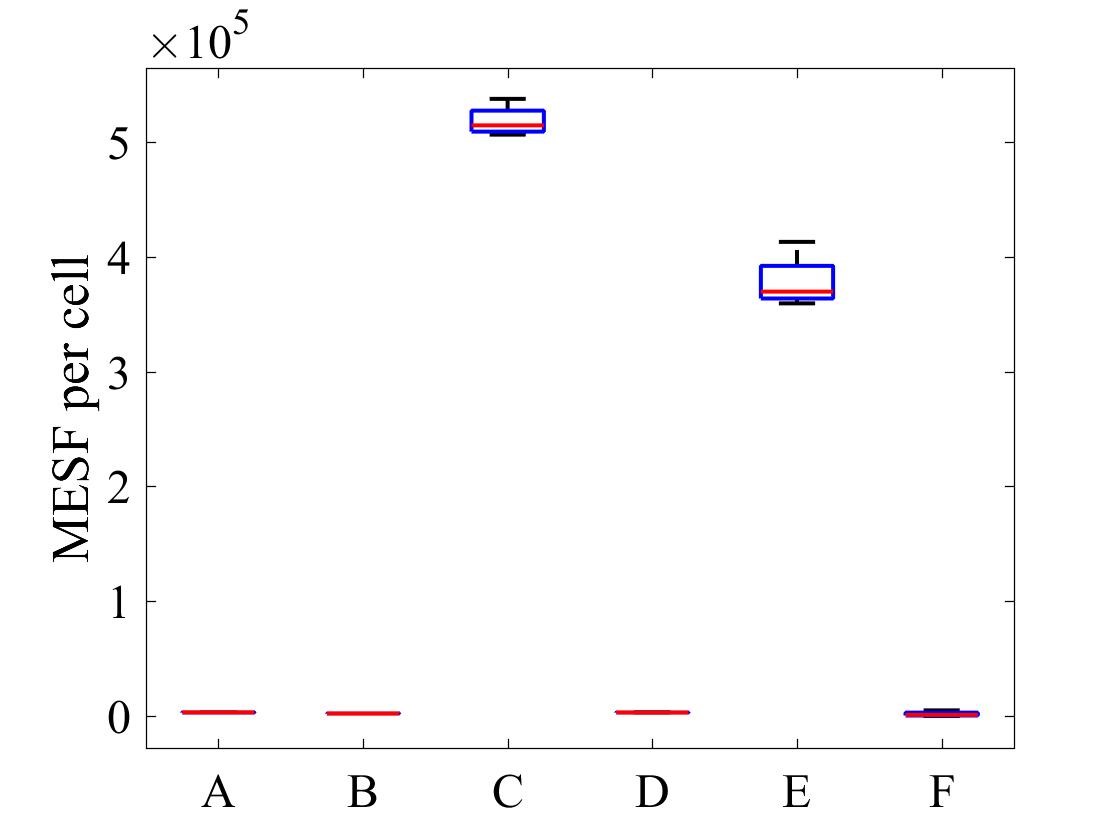
Figure 7: MESF per cell for E .coli strains A) E. coli BL21-pSB1C3-BBa_I746909 induced, B) E. coli BL21-pSB1C3-BBa_I746909 uninduced, C) E. coli BL21(DE3)-pSB1C3-BBa_I746909 induced, D) E. coli BL21(DE3)-pSB1C3-BBa_I746909uninduced, E) E. coli BL21(DE3)pLysS-pX1800-BBa_I746909 induced, F) E. coli BL21(DE3)pLysS-pX1800-BBa_I746909 uninduced; Data gathered from the geometric mean of FACS plots.
The data from flow cytometry indicated that for over-expression and purification of our PETase and MHETase enzymes for use in our washing machine filter, pLysS containing E. coli strains would decrease the efficiency of production.
Finally, the lab we were working in has an Imaging Flow Cytometer, which gave us an excellent opportunity to look at the cell morphology during expression of sGFP, Figures 8-10.
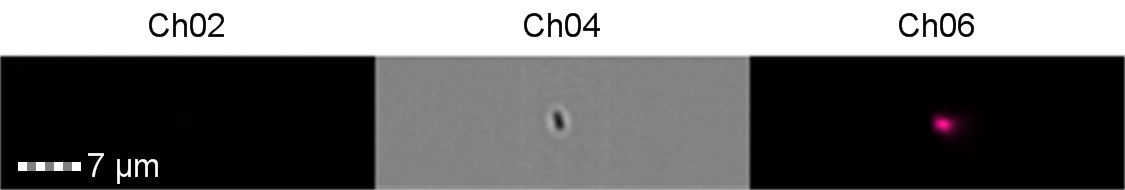
Figure 8: Image: screen capture of an induced E. coli BL21 cell. Channel 2 (Ch02) shows sGFP fluorescence at 533/55 nm, Channel 4 (Ch04) shows the corresponding bright field image and Channel 6 (Ch06) shows side scatter.
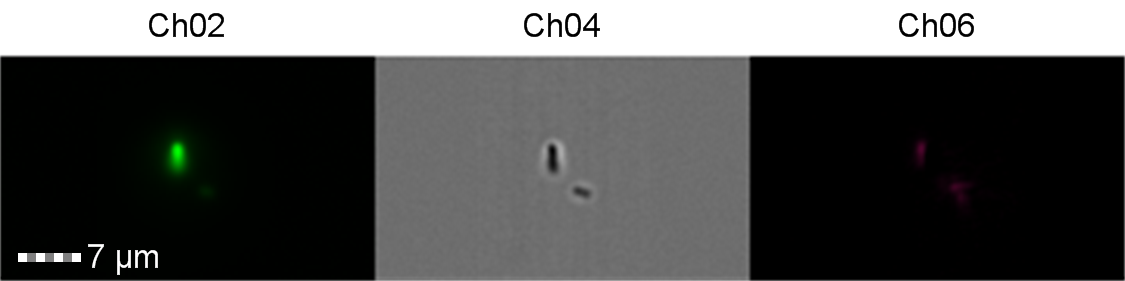
Figure 9: Image: screen capture of an induced E. coli BL21(DE3) cell. Channel 2 (Ch02) shows sGFP fluorescence at 533/55 nm, Channel 4 (Ch04) shows the corresponding bright field image and Channel 6 (Ch06) shows side scatter. The additional feature in the bright field and side scatter images arises from a speed bead, used to calibrate the cytometer.
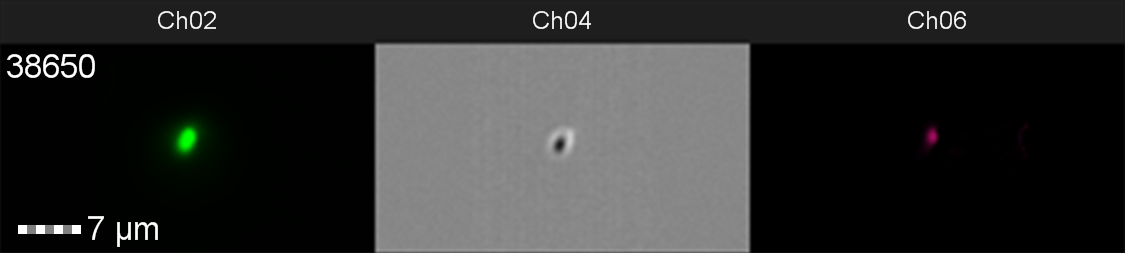
Figure 10: Image: screen capture of an induced E. coli BL21(DE3)pLysS cell. Channel 2 (Ch02) shows sGFP fluorescence at 533/55 nm, Channel 4 (Ch04) shows the corresponding bright field image and Channel 6 (Ch06) shows side scatter.
The images taken on Ch02 demonstrate that sGFP fluorescence is only detected in strains of E. coli carrying DE3. The bright field images (Ch04) are highly similar between the strains of E. coli indicating that the DE3 lysogen and pLysS plasmid do not significantly change cell morphology.
Conclusion
The results from this bronze medal study, investigating the ‘leakiness’ of the T7 promoter, show that in our lab expression from the T7 promoter is sufficiently controlled in strains of E. coli carrying DE3 only and therefore plasmids carrying our PETase and MHETase genes should not affect cell growth until expression of the enzymes is induced. In addition, strains carrying pLysS could reduce the overall expression of our enzymes, limiting the amount we could produce for our washing machine filter.
Improvement TU Eindhoven 2022
The iGEM team Eindhoven 2022 improved this part by removing the RBS and adding a 5’ UTR( BBa_K1758100) in its place. The 5’ UTR created by iGEM 2015 team Bielefeld contains a 5' UTR and a strong RBS (ribosomal binding site) from bacteriophage T7, which is called g10-L. Both the UTR sequence and the RBS sequence enhance the translation of the desired protein.1-3
The aim of this part improvement was to enhance sfGFP protein expression, for the application during the educational high school challenge day, organized by our team. During this event, high school students interact with synthetic biology. During this day high school students went into the lab and created drawings with fluorescent bacteria, among which was GFP. Our aim was to enhance the expression level in order to obtain a stronger fluorescence, which would create better visible drawings.

As can be seen in figure 1 and 2, a yellow dimmer fluorescent color can be seen. We did not expect a weaker fluorescence, as previous parts where the UTR was added showed a clear enhancement of expression (For example, BBa_K3187014). Nevertheless, this alternative sfGFP could be useful for future drawing projects, as the yellow expands the color pallet.
We wondered why these results were opposite from expected. Using commercial sanger sequencing(baseclear) the sequences used for the experiment were checked for presence of the UTR sequence in the UTR sample. Also there was checked for mutations in the sfGFP part from BBa_K4160018 which led to forming yFP, no clear signs of this were found.
The plasmid backbone was retrieved from the iGEM distribution kit, plate 1, well 1O. Figure 3 shows the agarose gel analyses after DNA separation of the digested plasmids and inserts. pSB1C3 contains 2000 base pairs and therefore a band is expected around 2000 base pairs. However, as can be seen in figure 3, a band can be seen around 3000 bp. A reason for unexpected bands could be formation of a linear plasmid after 1x digestion. Unfortunately, from this gel we can conclude that an unexpected plasmid is present in the sample. At the moment we can’t exclude that due to the plasmid backbone, the functionality of the UTR was affected.

References
- Lentini R, Forlin M, Martini L, et al. Fluorescent Proteins and in Vitro Genetic Organization for Cell-Free Synthetic Biology. ACS Synth Biol. 2013;2(9):482-489. doi:10.1021/sb400003y
- Hellen CUT, Sarnow P. Internal ribosome entry sites in eukaryotic mRNA molecules. Genes Dev. 2001;15(13):1593-1612. doi:10.1101/gad.891101
- Olins PO, Rangwala SH. A novel sequence element derived from bacteriophage T7 mRNA acts as an enhancer of translation of the lacZ gene in Escherichia coli. J Biol Chem. 1989;264(29):16973-16976.
- 10COMPATIBLE WITH RFC[10]
- 12COMPATIBLE WITH RFC[12]
- 21COMPATIBLE WITH RFC[21]
- 23COMPATIBLE WITH RFC[23]
- 25COMPATIBLE WITH RFC[25]
- 1000INCOMPATIBLE WITH RFC[1000]Illegal SapI.rc site found at 62
| None |