Part:BBa_J23112:Experience
This experience page is provided so that any user may enter their experience using this part.
Please enter
how you used this part and how it worked out.
Applications of BBa_J23112
Use of this promoter by team Glasgow 2014
We found this promoter is actually identical in sequence to BBa_J23103
BBa_J23116,
BBa_J23106,
BBa_J23103, and
BBa_J23112
were used to express motA and motB together in our composite biobricks:
BBa_ K1463773,
BBa_ K1463772,
BBa_ K1463770, and
BBa_ K1463771 respectively.
These composite biobricks were used to complement the swimming defect of a motA E. coli mutant.
We found that swimming was restored in the following order:
BBa_J23116 >
BBa_J23106 >
BBa_J23103 =
BBa_J23112.
Examination of the sequences of BBa_J23103 and BBa_J23112 showed that they are identical, despite showing different levels of RFP expression in their initial characterisation!
>BBa_J23103 Part-only sequence (35 bp) ctgatagctagctcagtcctagggattatgctagc
>BBa_J23112 Part-only sequence (35 bp) ctgatagctagctcagtcctagggattatgctagc
User Reviews
UNIQa41a06d88fc0ed5a-partinfo-00000000-QINU UNIQa41a06d88fc0ed5a-partinfo-00000001-QINU
|
•••••
for iGEM-Team Goettingen 2012 |
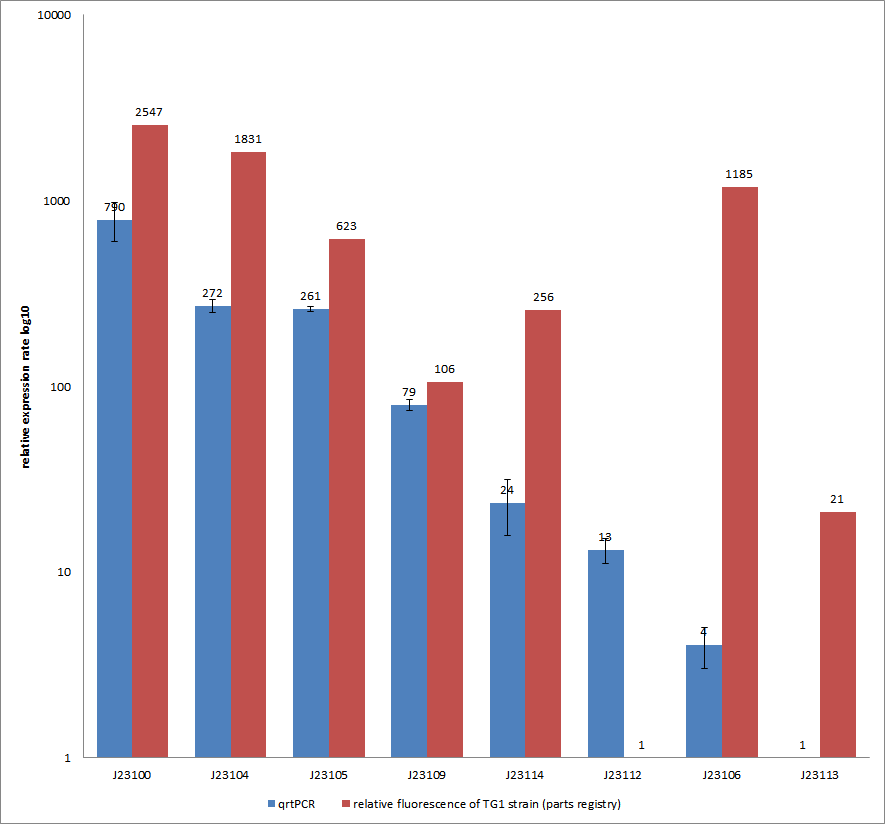
Characterization experiment by qrtPCR on BBa_J23100, BBa_J23104, BBa_J23105, BBa_J23106, BBa_J23109, BBa_J23112, BBa_J23113, BBa_J23114 by iGEM Team Göttingen (by C. Krüger and J. Kampf)DescriptionWe used quantitative real-time PCR as a powerful tool for quantification of gene expression. We used this method to examine the expression rate of the Tar receptor gene under control of promoters from the Anderson family of the parts registry. The BioBricks (K777001-K777008) we used for this experiment can be found here. The reported activities of these promoters are given as the relative fluorescence of these plasmids in strain TG1 [1]. Promoter constructs were cloned into the vector pSB1C3 and expressed in E.coli BL21DE3 grown in LB-media (lysogeny broth). The measurements were performed for each construct and reference as a triplet. Additionally, we included H2O as negative control to predict possible contamination. For the evaluation of our results, the 2–ΔΔCT (Livak) method was applied. We used the weakest promoter with the lowest expression rate as calibrator for the calculations and as reference the housekeeping gene rrsD of E.coli.
You can find detailed information of the qrtPCR approach [http://2012.igem.org/Team:Goettingen/Project/Methods#-.3E_Experimental_design here].
Results & Discussion Comparison of relative expression rates of constitutive promoters by qrtPCR and relative fluorescence (see parts registry,Anderson family). The blue bar indicates the measured expression rates for our constructs (J23100, J23104, J23105, J23106, J23109, J23112, J23113, J23114) and the red ones those for the literature values represented in the “parts registry”. The measurements are illustrated in a logarithmic application. The standard variation was calculated for our measured values (black error bar). As mentioned before, both datasets were collected by methods which produce data at different points after the gene expression. Quantitative real time PCR measures the amount of expressed mRNA while relative fluorescence measurements quantify on protein level. In perspective of stability and half-life periods of mRNA and proteins or due to protein modification, it is comprehensible to obtain varying data-sets and expression rates. Another problem that occurred during our quantitative real-time measurements was the deviation in some of biological replicates. This problem was also observed in another group’s experiments ([http://www.jbioleng.org/content/3/1/4 Kelly et al., 2009]). They mentioned variations across experimental conditions in the absolute activity of the BioBricks. To reduce variation in promoter activity, they measured the activity of promoters relative to BBa_J23101. Furthermore, the iGEM team of Groningen which participated in 2009 also measured the relative fluorescence of TG1 strain with the promoters J23100, J23109 and J23106 via Relative Promoter Units (RPUs). Their values indicated the comparable tendency to our documented values |
|
[http://2019.igem.org/Team:Tacoma_RAINmakers Tacoma RAINmakers 2019] |
Tacoma RAINmakers 2019: Relative Strength of Anderson Promoters
We collected characterization data on the relative RFP expression rates of Anderson Promoters BBa_J23100, BBa_J23101, BBa_J23102, BBa_J23105, BBa_J23106, and BBa_J23112 in the RFP expression plasmid BBa_J61002 (samples provided in the 2019 iGEM Distribution Kit). 
|
|}
|
•••••
University of Texas at Austin iGEM 2019 |
Characterization of the Anderson series through burden monitoring by the University of Texas at Austin's 2019 iGEM teamDescriptionOur team transformed the Anderson series of RFP reporters (J23101, J23113, J23104, J23107, J23117 in pSBC13 backbone) into our constitutive GFP burden monitor E. coli strain and measured the relative burden of each part. They contained a constitutive GFP sequence in the genome which serves as a way to measure the constructs’ ribosome allocation. Our results show a certain reduction ingrowth rate for each part as a result of ribosome misallocation away from the genome and towards the plasmid containing the construct. The promoter strengths associated with each RFP reporter construct shows that parts with stronger promoters express less GFP and have a reduced growth rate when compared to the constructs containing weaker promoters. The promoters associated with these RFP reporters were used to create a series of BFP reporters, also transformed into our GFP burden monitor strain, and create the regression on the figure below. For more information on characterization of these parts through burden monitoring and evolutionary stability experiments, visit our team’s wiki page: [2] |

 1 Registry Star