Part:BBa_K608010
Medium promoter with strong RBS and GFP
Medium promoter from the constitutive promoter family combined with a strong RBS (PR4) and tagged with GFP to quantify the gene expression.
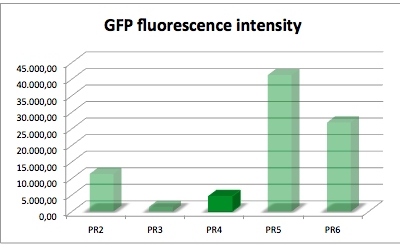
The GFP fluorescence was measured with a plate reader:
The fluorescence intensity and protein concentration were measured with the FLUOstar Omega,
which is a multi-mode microplate reader.
Samples were pipetted into the microplate and analyzed via the plate reader. In this experiment we focused on the protein concentration and the fluorescence intensity of RFP.
We measured the protein concentration with the bradford-assay. This is a method to determine the total protein
concentration. To analyze the protein concentration of the samples, Coomassie Brillant Blue was pippeted to each sample. With the binding of the dye to the proteins the color changes from dark red to blue. The more protein in the solution the more Coomassie dye can bind to proteins and the more the color changes into blue. The absorption of bound Coomassie dye is 595nm. The absorbance is proportional with the amount of bound dye. With a series of Bovine Serum Albumin (BSA) measurements the exact protein concentration of the samples can be determined. BSA acts like a “marker” because the concentration of BSA is known and with a linear calibration line the exact protein concentration can be detected.
GFP served as a reporter of expression. We wanted to know how strong the promoter and RBS activity is. With this reporter gene it was possible to analyze the expression via plate reader. GFP is excited at a wavelength of 509nm and has an emission of 520nm. The plate reader illuminates the samples with a high energy xenon flash lamp. Optical filters or monochromator create the exact wavelength. The more GFP in the sample the higher is the GFP fluorescence intensity. The intensity is collected with the second optical system and is detected with a side window photomultiplier tube.
Promoter and RBS:
PR1: strong Promoter (J23104) strong RBS (B0034)
PR2: strong Promoter (J23104) medium RBS (B0032)
PR3: strong Promoter (J23104) weak RBS (B0031)
PR4: medium Promoter (J23110) strong RBS (B0034)
PR5: medium Promoter (J23110) medium RBS (B0032)
PR6: medium Promoter (J23110) weak RBS (B0031)
| sample | PR2 | PR3 | PR4 | PR5 | PR6 |
| GFP fluorescence intensity | 11378.5 | 1445.0 | 4596.2 | 41221.1 | 26922.7 |
| factor | 7.9 | 1.0 | 3.2 | 28.5 | 18.6 |
The results of this test show that PR4 has 3.2 times higher expression of GFP in comparison with with PR3 which has the lowest expression. The fluorescence intensity of GFP varies, and because of lack of time we could not repeat this experiment. We have also tested the promoter and RBS activity with RFP as a reporter and the results deviate from this experiment. So we are looking forward to test this system another time.
Characterization: PR4 vs. T7
Group: Queens_Canada, 2019
Author: Ruben Warkentin
Summary: We compared the amount of GFP expressed under a constitutive promoter (medium promoter, strong RBS) to T7 expression. Some proteins fold better under constitutive promoters; however, nobody had yet directly compared the amount of protein produced between constitutive vs. T7 expression.
Description
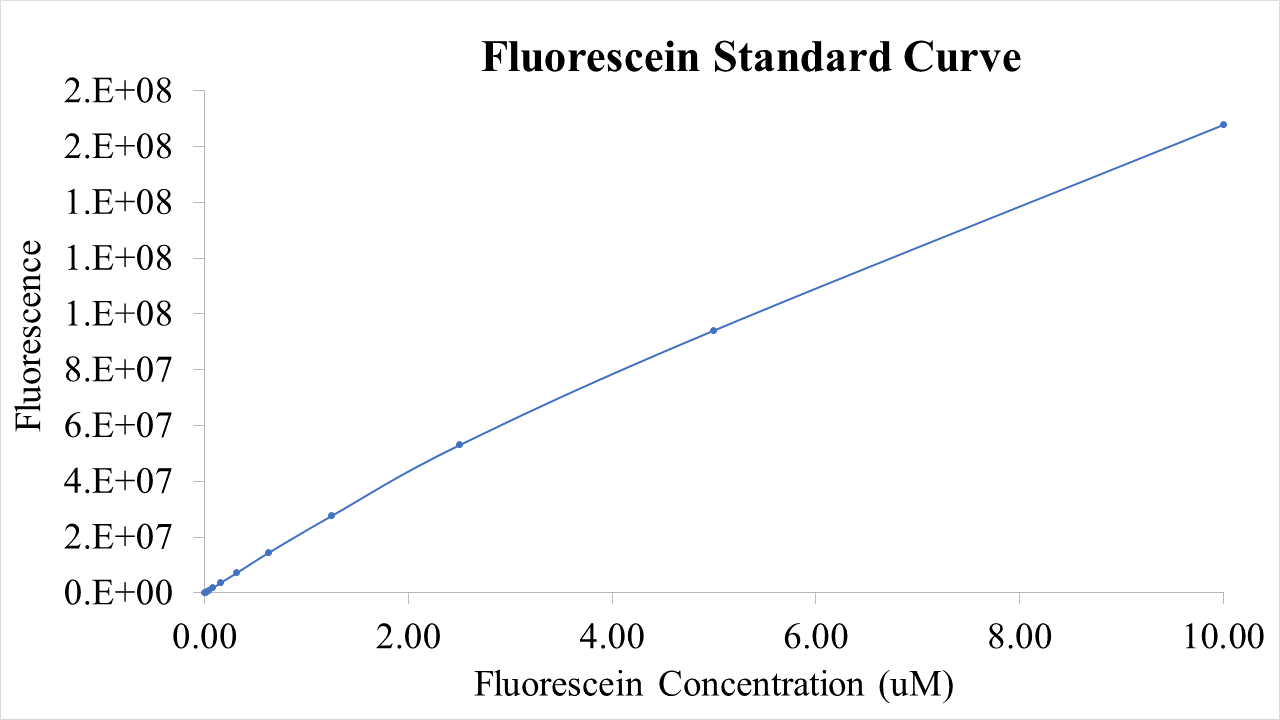
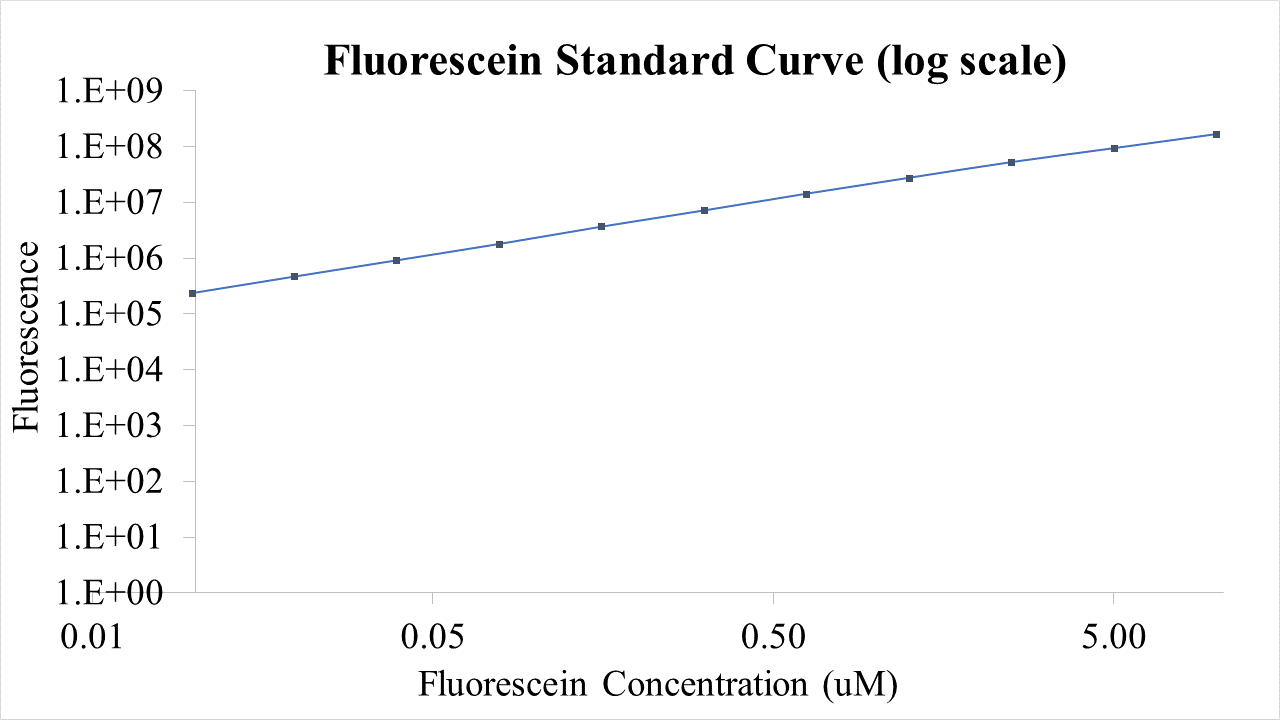
BioBricks were transformed and expressed in E. coli (BL21). BL21 cells were cultured to an OD600=0.6 and 100 uL of culture was transferred into a 96 well plate. Colonies were transfered in quadruplicate. The fluorescence intensity of GFP was measured with a multi-mode microplate reader. The iGEM standardized fluorescence protocol was used for fluorescence measurements (https://www.protocols.io/view/calibration-protocol-plate-reader-fluorescence-cal-6zrhf56).
Results
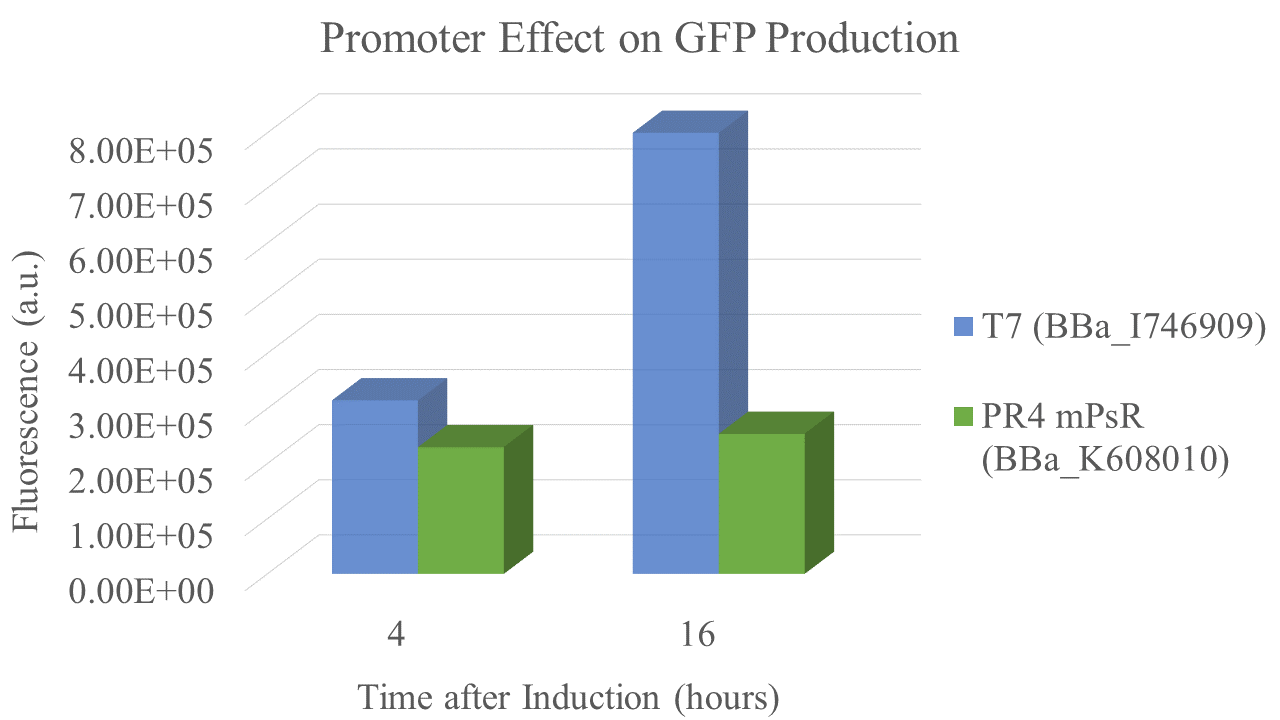
We found that the T7 promoter produced about 2.6 times as much fluorescent signal as the constitutive PR4 promoter, indicating that T7 is much more efficient at producing GFP (Fig. 5). Interestingly, the production of GFP under PR4 did not increase beyond the level observed at 4 hours after inoculation. It seems that PR4 leads to an initial production of protein; however, after the initial expression the promoter seems to be shut off.
| sample | PR4 | T7 |
| GFP fluorescence intensity | 3.09E+05 | 8.00E+05 |
Sequence and Features
- 10COMPATIBLE WITH RFC[10]
- 12INCOMPATIBLE WITH RFC[12]Illegal NheI site found at 7
Illegal NheI site found at 30 - 21COMPATIBLE WITH RFC[21]
- 23COMPATIBLE WITH RFC[23]
- 25COMPATIBLE WITH RFC[25]
- 1000INCOMPATIBLE WITH RFC[1000]Illegal BsaI.rc site found at 705
| None |


