
Part:BBa_K608010
Medium promoter with strong RBS and GFP
Medium promoter from the constitutive promoter family combined with a strong RBS (PR4) and tagged with GFP to quantify the gene expression.
The GFP fluorescence was measured with a plate reader:

The fluorescence intensity and protein concentration were measured with the FLUOstar Omega,
which is a multi-mode microplate reader.
Samples were pipetted into the microplate and analyzed via the plate reader. In this experiment we focused on the protein concentration and the fluorescence intensity of RFP.
We measured the protein concentration with the bradford-assay. This is a method to determine the total protein
concentration. To analyze the protein concentration of the samples, Coomassie Brillant Blue was pippeted to each sample. With the binding of the dye to the proteins the color changes from dark red to blue. The more protein in the solution the more Coomassie dye can bind to proteins and the more the color changes into blue. The absorption of bound Coomassie dye is 595nm. The absorbance is proportional with the amount of bound dye. With a series of Bovine Serum Albumin (BSA) measurements the exact protein concentration of the samples can be determined. BSA acts like a “marker” because the concentration of BSA is known and with a linear calibration line the exact protein concentration can be detected.
GFP served as a reporter of expression. We wanted to know how strong the promoter and RBS activity is. With this reporter gene it was possible to analyze the expression via plate reader. GFP is excited at a wavelength of 509nm and has an emission of 520nm. The plate reader illuminates the samples with a high energy xenon flash lamp. Optical filters or monochromator create the exact wavelength. The more GFP in the sample the higher is the GFP fluorescence intensity. The intensity is collected with the second optical system and is detected with a side window photomultiplier tube.

Promoter and RBS:
PR1: strong Promoter (J23104) strong RBS (B0034)
PR2: strong Promoter (J23104) medium RBS (B0032)
PR3: strong Promoter (J23104) weak RBS (B0031)
PR4: medium Promoter (J23110) strong RBS (B0034)
PR5: medium Promoter (J23110) medium RBS (B0032)
PR6: medium Promoter (J23110) weak RBS (B0031)
| sample | PR2 | PR3 | PR4 | PR5 | PR6 |
| GFP fluorescence intensity | 11378.5 | 1445.0 | 4596.2 | 41221.1 | 26922.7 |
| factor | 7.9 | 1.0 | 3.2 | 28.5 | 18.6 |
The results of this test show that PR4 has 3.2 times higher expression of GFP in comparison with with PR3 which has the lowest expression. The fluorescence intensity of GFP varies, and because of lack of time we could not repeat this experiment. We have also tested the promoter and RBS activity with RFP as a reporter and the results deviate from this experiment. So we are looking forward to test this system another time.
Characterization: PR4 vs. T7


Group: Queens_Canada, 2019
Author: Ruben Warkentin
Summary: We compared the amount of GFP expressed under a constitutive promoter (medium promoter, strong RBS) to T7 expression. Some proteins fold better under constitutive promoters; however, nobody had yet directly compared the amount of protein produced between constitutive vs. T7 expression.
Methods
BioBricks were transformed and expressed in E. coli (BL21). Successful transformation was indicative from the fluorescent E. coli colonies (Fig. 3). BL21 cells were cultured to an OD600=0.6 and 100 uL of culture was transferred into a 96 well plate. Colonies were transfered in quadruplicate. The fluorescence intensity of GFP was measured with a multi-mode microplate reader. The iGEM standardized fluorescence protocol was used for fluorescence measurement standardization (Fig. 4,5; https://www.protocols.io/view/calibration-protocol-plate-reader-fluorescence-cal-6zrhf56).
Results
We found that the T7 promoter produced about 2.6 times as much fluorescent signal as the constitutive PR4 promoter, indicating that T7 is much more efficient at producing GFP (Fig. 6). Interestingly, the production of GFP under PR4 did not increase beyond the level observed at 4 hours after inoculation. It seems that PR4 leads to an initial production of protein; however, after the initial expression the promoter seems to be shut off.
Promoter and RBS:
PR4: medium Promoter (J23110) strong RBS (B0034)
T7: T7 Promoter (BBa_I746909)
| sample | PR4 | T7 |
| Fluorescence 4 hrs (a.u.) | 2.24E+05 | 3.09E+05 |
| Fluorescence 16 hrs (a.u.) | 2.48E+05 | 8.00E+05 |
Future Directions Future experiments should address the lack of increase in expression over time for the PR4 constitutive promoter. Additionally, other constitutive promoters should be directly compared to T7 promoter expression. All fluorescent data should be collected as per the iGEM standardized fluorescein protocol.
Characterization: Average Fluorescence per Cell


Group: FDR-HB_Peru
Author: Marry Xuan
Summary: We compared parts BBa_K608010 and BBa_K608012 to test if the strength of the RBS correlates to the average amount of fluorescence per cell.
Method:
- Dilute 10 ul of the culture (BBa_K608010 and BBa_K608012) into 90ul of M9 + Glucose (0.2% w/v) + CAS amino acids (0.2%) medium in the plate reader wells
- Use a plate reader to read the optical density at 600nm (OD).
- Use that data to calculate the dilution of the culture to reach an OD reading of 0.1 and dilute with medium (M9 + Glucose + CAS).
- Take 200 µl of the previous dilution and add it to a well on the plate reader (fill 3 wells for both K608010 and K608012)
- Fill 3 wells with blank medium.
- Put the plate in the plate reader and collect the data for 345 minutes, reads both OD and Fluorescence (We used a low gain since the fluorescence was too intense).
- Once the data was collected, the OD and Fluorescence data was normalized by subtracting the blank. Then to calculate the average fluorescence per cell, we used the following equation: (FLOnorm)/(ODnorm)
Results: We found out that after 345 minutes, the average fluorescence of the GFP with a strong RBS (BBa_K608010) was 2.18 times greater than the average fluorescence of the GFP with a weak RBS (BBa_K608012). This data counters the data from the original experiment performed, where the fluorescence intensity of BBa_K608010 was 5.86 times lower than the fluorescence intensity of BBa_K608012.

Characterization: The effect of different sodium chloride concentrations (0.05% and 6%) on the expression of GFP (BBa_K608010)


Group: FDR-HB_Peru
Author: Karina Vestergaard
Summary: We exposed BBa_K608010 in DH5-Alpha E. coli cells to different sodium chloride concentrations (0.05% and 6%) in M9 Minimal salts medium to see how the expression (measured as average fluorescence per cell) of GFP was affected.
Method: Preparation: Inoculate frozen E. coli DH5-Alpha cells and incubate for 48 hours at room temperature (18-21℃) on shaker (100RPM) Transform E. coli culture with the GFP using iGEM’s transformation protocol (“iGEM,” n.d.) and plate them. Inoculate LB medium with a colony of the transformed E. coli cells and grow overnight. Main experiment: Conducted on a 96 well plate Dilute 10µL of the E. coli culture into 90µL of M9 Minimal Salts medium in a well. Put the plate into the plate reader to read the optical density (OD). From that OD reading, you can determine the volume in µL of the culture you need, after spinning it down with a centrifuge, to dilute it in 1mL of M9 Minimal Salts medium in order for the final OD reading to be 0.1. This allows the cells to enter the exponential growth phase during the incubation period. Repeat step 3 twice in order to have two 1.5mL Eppendorf tubes with the diluted E. coli culture. Label one tube “0.05% NaCl” and the other “6% NaCl.” Weigh 0.06g of NaCl on the electronic scale. Add the 0.06g of NaCl to the 6% NaCl tube and shake it vigorously until the NaCl has dissolved. Using a 1000µL micropipette add 200µL of the 0.05% NaCl culture to a well. Repeat step 8 two more times (add the 200µL to two different wells). Repeat steps 8 and 9 for the 6% NaCl culture. Using a 1000µL micropipette add 200µL of M9 Minimal Salts medium to a well (this is the control). Repeat step 11 two more times (add the 200µL to two different wells). Put the plate into the plate reader and start the incubation period.
Results: Our results suggest that an increase in sodium chloride concentration inhibits both growth (OD) and normalization (fluorescence per cell). The average growth consistently increases for the 0.05% NaCl concentration and the growth for the 6% NaCl concentration stays constant, as seen in Graph 1. This same pattern is seen in Graph 2 for the average fluorescence of GFP. Finally, in Graph 3, for the 0.05% NaCl concentration the average normalization increases and for the 6% NaCl concentration the average normalization decreases, hence strongly suggesting that high salt concentrations inhibit GFP expression.

- 10COMPATIBLE WITH RFC[10]
- 12INCOMPATIBLE WITH RFC[12]Illegal NheI site found at 7
Illegal NheI site found at 30 - 21COMPATIBLE WITH RFC[21]
- 23COMPATIBLE WITH RFC[23]
- 25COMPATIBLE WITH RFC[25]
- 1000INCOMPATIBLE WITH RFC[1000]Illegal BsaI.rc site found at 705
Functional Parameters
Team KCL_UK 2019
Our team have used this BBa_K608010 part as a fluorescent reporter to test our sRNA part. We aimed to create sRNA molecule that would bind to the GFP mRNA spanning the Ribosome Binding site and first two codons of the GFP gene. To use this BBa_K608010 we first has to sub clone it into the pSB4K5 plasmid to ensure compatibility with the sRNA plasmid pSB1C3. We tested this BBa_K608010 part in pSB1C3 and pSB4K5 plasmids in Xl1Blue E.coli.
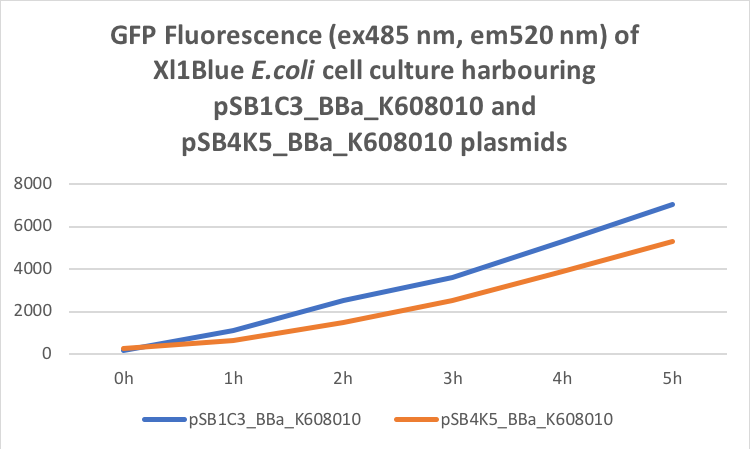
Xl1Blue E.coli cells were transformed with these plasmids and positive colonies were selected on LB agar plates containing Kanamycin (15 ug/ml) for pSB4K5 plasmids and Chloramphenicol (34 ug/ml) for pSB1C3 plasmids respectively. Single colony from each plate was inoculated into 10 ml LB media containing appropriate antibiotic and incubated overnight in a shaking incubator at 37 oC with shaking 200 rpm. After approximately 16 h of incubation E.coli cultures were diluted 1/10 with fresh 10 ml LB media containing Kanamycin (15 ug/ml) in 20 ml universal bottle. Each experiment was performed in duplicate. At this starting point 500 ul of the culture was collected into 1.5 ml centrifuge tube, labelled 0h incubation and stored on ice. The rest of the culture was incubated for 5 h in the shaking incubator at 37 oC with shaking 200 rpm with 500 ul samples taken every hour, labelled 1, 2, 3, 4 and 5 h incubation and stored on ice. In the end 200 ul of each duplicate sample was aliquoted into black clear bottom 96 well plate. Duplicate samples of LB media containing Kanamycin and Chloramphenicol respectively were used as negative control. The OD600 and fluorescence (ex485, em520) data was recorded using PHERAstar FS (BMG Labtech) 96well plate reader. Recorded results were normalised for LB media and average results of two duplicate samples are presented in tables 1 and 1 and figures 1 and 2.
Table 1. OD600 of Xl1Blue E.coli cell culture harbouring pSB1C3_BBa_K608010 and pSB4K5_BBa_K608010 plasmids respectively.
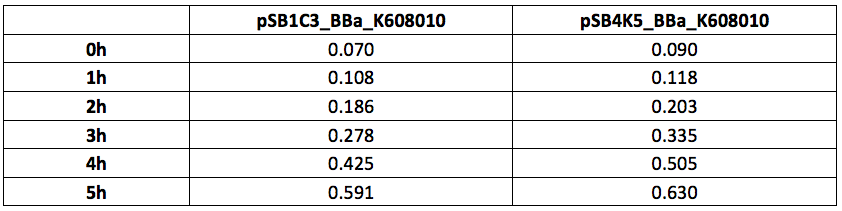
Table 2. GFP Fluorescence (ex485 nm, em520 nm) of Xl1Blue E.coli cell culture harbouring pSB1C3_BBa_K608010 and pSB4K5_BBa_K608010 plasmids respectively.
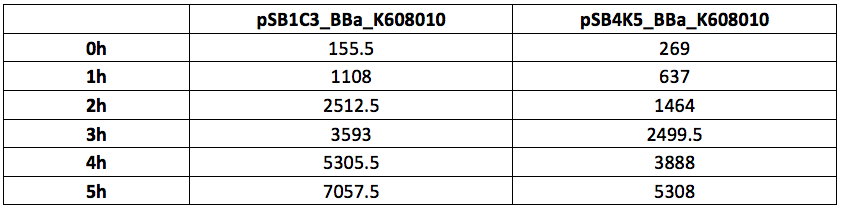
Figure 1. OD600 of Xl1Blue E.coli cell culture harbouring pSB1C3_BBa_K608010 and pSB4K5_BBa_K608010 plasmids respectively.
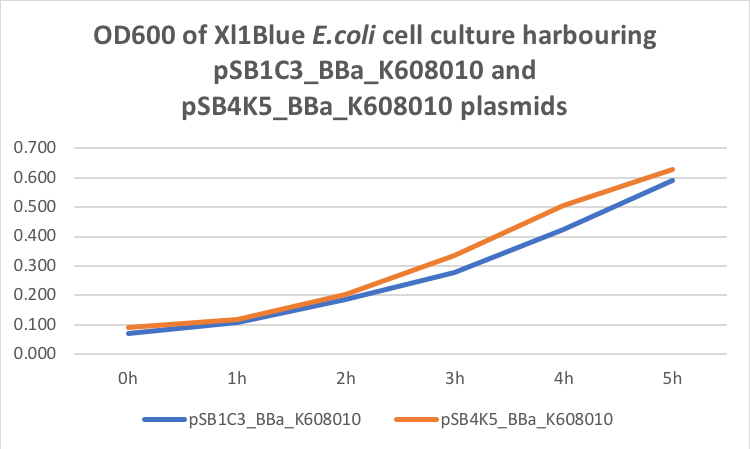
Figure 2. GFP Fluorescence (ex485 nm, em520 nm) of Xl1Blue E.coli cell culture harbouring pSB1C3_BBa_K608010 and pSB4K5_BBa_K608010 plasmids respectively.
Team University of Edinburgh 2019
Group: University of Edinburgh OG, 2019
Author: Francisco Ivan Rodriguez Jaubert and Cathal O’Reilly
Summary: We compared the amount of GFP expressed under the medium constitutive promoter with strong, medium and weak RBS/GFP (PR4-GFP, PR5-GFP, PR6-GFP) in TOP10, BL21 (DE3) and DH5α cells lines. We were interested in replicating the original characterisation as the Freiburg 2011 team mentioned it needed to be replicated. We did so with 3 biological replicates and 3 technical replicates for each control. Additionally, we characterised these biobricks across different common E. coli strains to investigate the consistency across these strains.
Methods
Biobricks were extracted and amplified from the iGEM kit 2019 following standard protocols. Transformation was performed following heat-shock standard protocols. Three positive colonies were picked containing each biobrick in each different cell line. The samples were repeated in series of three to ensure consistency. This was carried out by adding 200 μl of cell culture to wells of a 96-well microplate. The plate reader was set at 485nm wavelength and 520nm emission for analysis.
Results
The next graph shows the average of the three samples (repeated three times) for each biobrick (PR4-GFP, PR5-GFP, and PR6-GFP) in different strains with their respective GFP fluorescence intensity. The weakest RBS (PR6-GFP) in BL21 presents the highest GFP absorbance, in contrast with the Freiburg data showing that the medium RBS (PR5-GFP) had the highest GFP absorbance.

Our data suggest that in BL21 the highest GFP expression was led by the weakest RBS (PR6-GFP), followed by the strongest RBS (PR4-GFP), and finally the medium RBS (PR5-GFP).
TOP10 shows the highest GFP expression with the strongest RBS (PR4-GFP), followed by the medium RBS (PR5-GFP), and finally the weakest RBS (PR6-GFP).
DH5a shows the highest GFP expression with the strongest RBS (PR4-GFP), followed by the weakest RBS (PR6-GFP), and finally the medium RBS (PR5-GFP).
TOP10 is the only cell line showing consistency in the hierarchy of the strongest to the weakest RBS.
Functional Parameters: Austin_UTexas
Burden Imposed by this Part:

Burden is the percent reduction in the growth rate of E. coli cells transformed with a plasmid containing this BioBrick (± values are 95% confidence limits). This part exhibited a significant burden. Users should be aware that BioBricks with a burden of >20-30% may be susceptible to mutating to become less functional or nonfunctional as an evolutionary consequence of this fitness cost. This risk increases as they used for more bacterial cell divisions or in larger cultures. Users should be especially careful when combining multiple burdensome parts, as plasmids with a total burden of >40% are expected to mutate so quickly that they become unclonable. Refer to any one of the BBa_K3174002 - BBa_K3174007 pages for more information on the methods and other conclusions from a large-scale measurement project conducted by the 2019 Austin_UTexas team.
This functional parameter was added by the 2020 Austin_UTexas team.
| None |