Part:BBa_K2003011:Experience
This experience page is provided so that any user may enter their experience using this part.
Please enter
how you used this part and how it worked out.
Results
Small-scale Expression of UnaGIn
addition to mutagenesis experiments, small-scale expression tests were
performed to verify that UnaG expresses under our
laboratory conditions (originally the protein was purified and crystalized using
Escherichia coli, so it should be producible in prokaryotes). BioBricks BBa_K880005
and BBa_K2003010
were 3A assembled and grown overnight in LB. Bilirubin is not very soluble in
water, so the stock 1mM solution was prepared in DMSO instead. It seems the
molecule does not permeate the cell easily, so appropriate amounts were added
to crude cell extracts instead, to a final concentration of 100 µM. Those were
obtained by replacing the growth medium with room temperature PBS pH 7.4
containing 1mg/ml lysozyme and breaking open the cells through incubation for
30 minutes and occasional mixing. To avoid unspecific fluorescence, cell debris
were pelleted before the experiment and small aliquots of the supernatant were
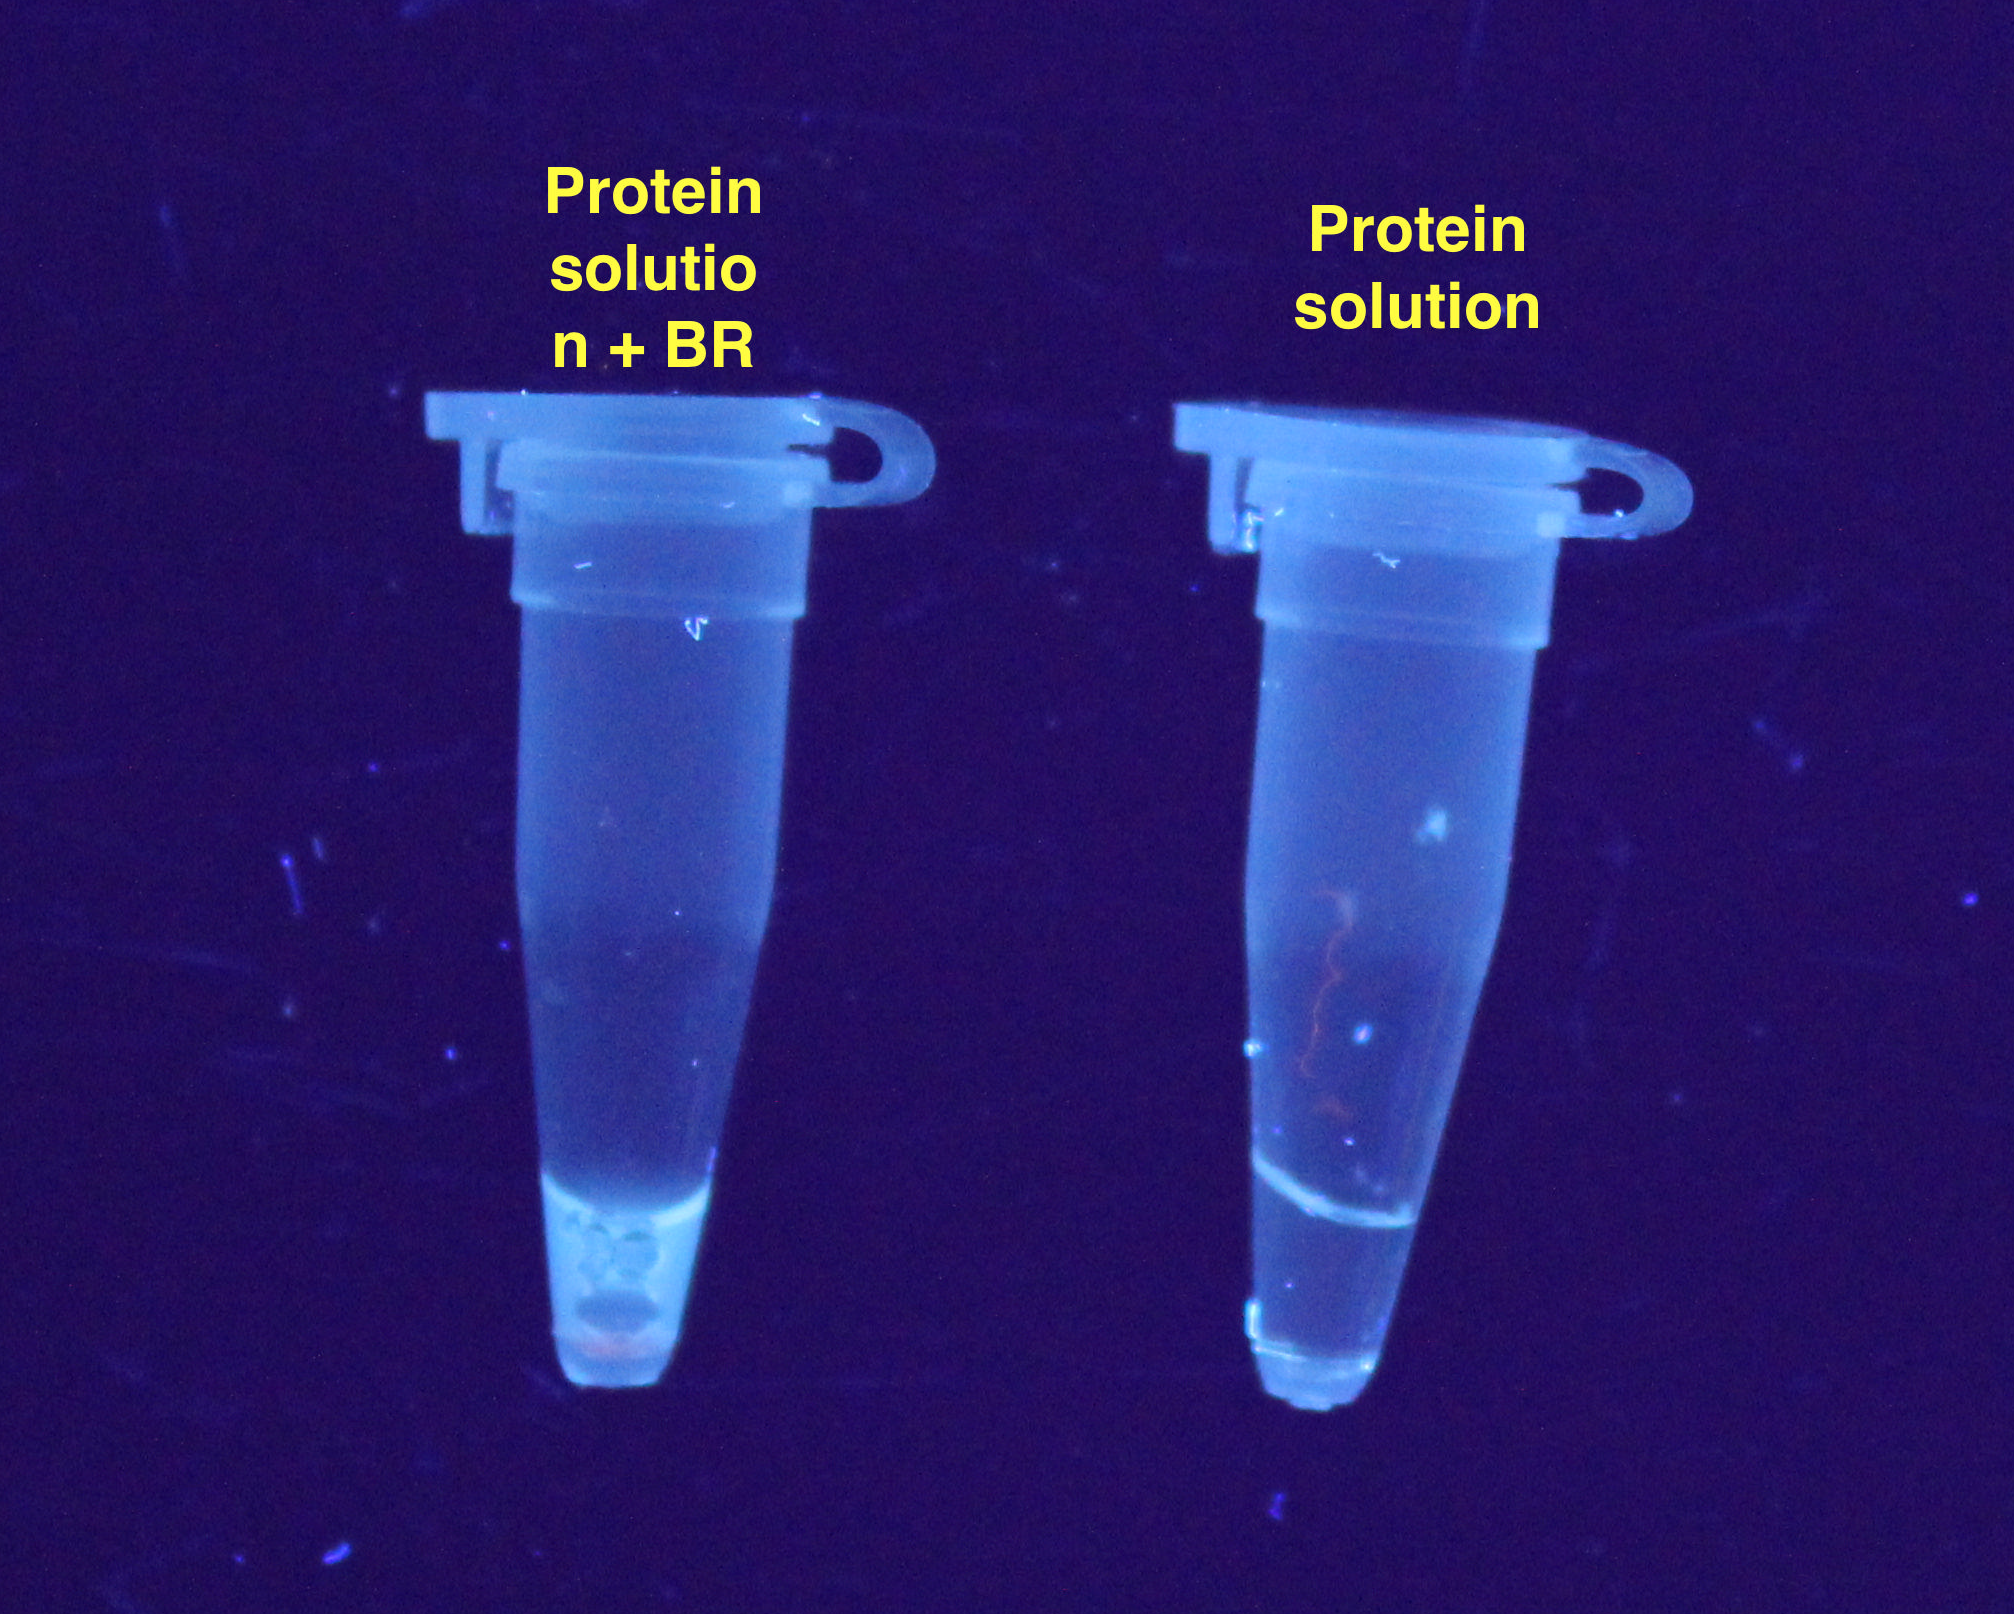
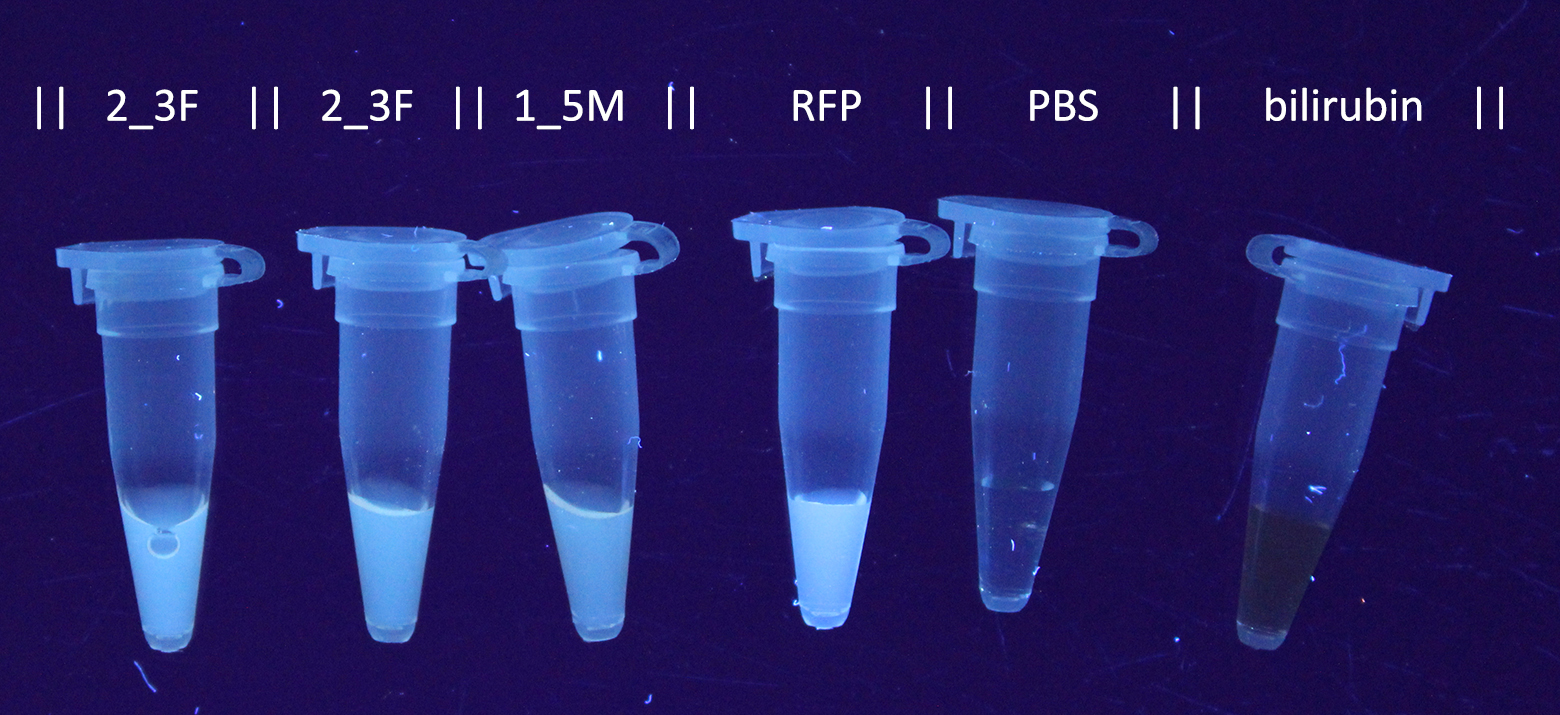
added to 200 µL thin-walled PCR tubes. Results are displayed in the Figures 1 and 2:
After
observing the small-scale expression results, plans for large-scale purification
were designed. E.coli BL21DE3 cells were used in
conjunction with T7 promoter-driven UnaG in TB medium
to achieve peak levels of expression. T7 expression is induced using IPTG at
18° for 16 hours. Breaking open the cells was performed using Qsonica Q700 titanium-tip sonicator
since lysozyme has nearly the same size as UnaG and
would make purification more difficult, as well as just slower and less efficient
compared to sonication. It also breaks DNA, reducing overall lysate viscosity.
After centrifugation at 4°C and 10 000 g for 1 hour, the supernatant was
filtered through 0.2 µM pore filter and loaded to a Ni2+ affinity
column.
First
the column had to be packed using Nickel Sepharose
Fast Flow resin (GE Healthcare). The calculated column volume for this setup was
5 ml. Afterwards the column had to be charged with Ni2+ this is done
with a ion binding buffer (50 mM Na+CH3COO-,
300 mM NaCl, pH4). The
column was equilibrated by pumping through 5 column volumes (CV) with a flowrate of 0.7ml/min. After the column is equilibrated
with ion binding buffer, the buffer it switched out with 0.3 M NiSO4
and a new equilibration step is made with 5CV’s of ion solution. The final
equilibration is done with 5CV ion binding buffer to wash away all of the
excess Ni+2 ions.
Three
others buffers were prepared, having a base composition of 50 mM Na+CH3COO- and 300 mM NaCl. The binding buffer for UnaG contains 10 mM imidazole,
the washing buffer (to remove the excess protein from the column) contains 20 mM imidazole and the elution buffer contains 350 mM imidazole. The column is equilibrated with 5 CV of
binding buffer, afterward 25 ml of the binding buffer is mixed with the UnaG lysate and loaded onto the column. Afterwards 5 CV of
wash buffer is pumped through to remove of all the excess protein still in the
column. Finally the elution buffer is used and fractions are collected. All of
the fractions were then tested for the target protein using SDS-PAGE (Figure
3).
Samples
were boiled with 2x Laemmli Sample Buffer with DTT
and 10 µL loaded on each start. The protein ladder was 5 µL, not boiled. After
staining the gel with Coomassie Brilliant Blue and destaining, the band corresponding to UnaG’s
expected size (15.6 kDa) was not observed anywhere.
In addition, none of the fractions fluoresced when bilirubin was added.
Since
sequencing confirmed that there are no mutations, and we previously managed to
obtain impure functioning UnaG during the small-scale
experiments of UnaG, the conclusion was that the IPTG
solution was faulty and did not manage to induce the T7 promoter driven UnaG expression.
User Reviews
UNIQ785c7e670f492502-partinfo-00000005-QINU UNIQ785c7e670f492502-partinfo-00000006-QINU


