Part:BBa_K592011
cjBlue, green chromoprotein
This chromoprotein from the Cnidopus japonicus sea anemone, cjBlue, naturally exhibits dark green color when expressed. Compared to some other chromoproteins, such as amilCP (BBa_K592009), amilGFP (BBa_K592010), spisPink (BBa_K1033932), asPink (BBa_K1033933) and aeBlue (BBa_K864401), the color development is slower. The color is readily observed in both LB or on agar plates after 24-48 hours of incubation. The sequence is codon optimized for expression in E coli.
Usage and Biology
This part is useful as a reporter.
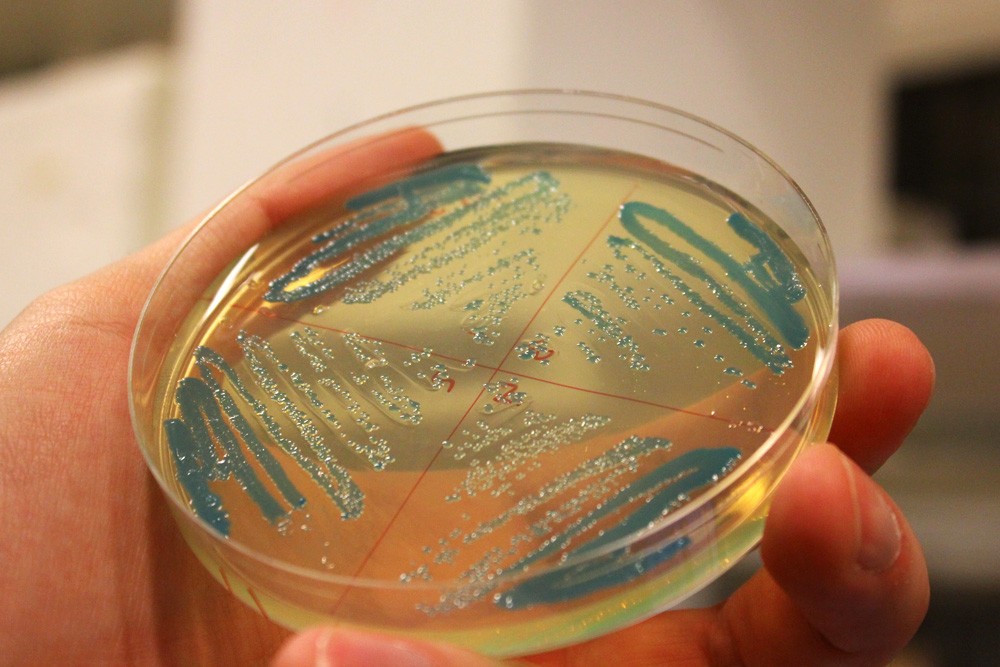
iGEM11_Uppsala-Sweden: Expression of green chromoprotein. Escherichia coli constitutively expressing cjBlue (BBa_K592011).
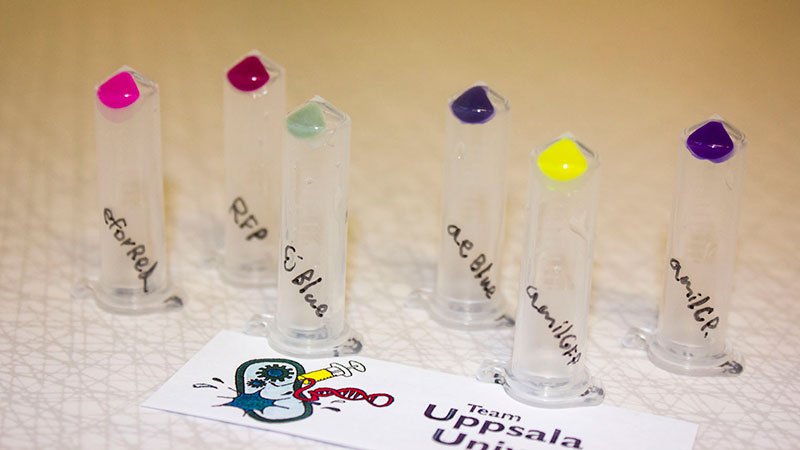
iGEM12_Uppsala_University: The Uppsala chromoprotein collection and RFP. The image shows pellets of E coli expressing chromoproteins eforRed BBa_K592012, RFP BBa_E1010, cjBlue BBa_K592011, aeBlue BBa_K864401, amilGFP BBa_K592010 and amilCP BBa_K592009.
References
[http://www.jbc.org/content/281/49/37813.abstract] Chan MC, Karasawa S, Mizuno H, Bosanac I, Ho D, Privé GG, Miyawaki A, Ikura M. (2006) Structural characterization of a blue chromoprotein and its yellow mutant from the sea anemone Cnidopus japonicus. J. Biol. Chem. 281(49). 37813-9
Sequence and Features
- 10COMPATIBLE WITH RFC[10]
- 12COMPATIBLE WITH RFC[12]
- 21COMPATIBLE WITH RFC[21]
- 23COMPATIBLE WITH RFC[23]
- 25COMPATIBLE WITH RFC[25]
- 1000COMPATIBLE WITH RFC[1000]
Structure and SWISS MODEL Homology Report
(The following information has been contributed by SVCE_Chennai 2016)
The following sections give a detailed information on this chromoprotein done by its in silico analysis.
3D Structure
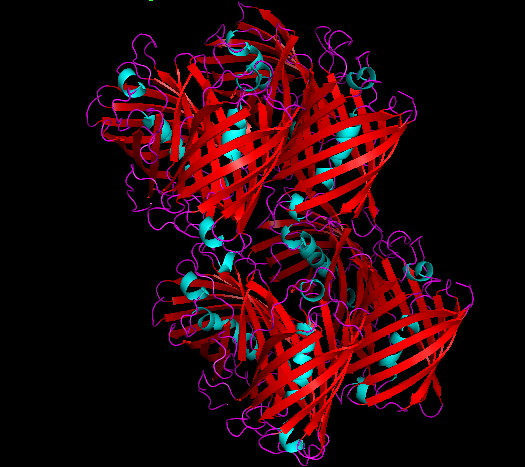
Cartoon representation of cjBlue chromoprotein.
QMEAN = -0.39
Cβ = -0.84
All Atom = 0.10
Solvation = -1.49
Torsion = -0.01
The best match during structure prediction.
| Template | Seq. Identity | Oligo-state | Found by | Method | Resolution | Seq Similarity | Range | Coverage | Description |
|---|---|---|---|---|---|---|---|---|---|
| 2ib5.1.A | 99.57 | homo-octamer | BLAST | X-Ray | 1.80Å | 0.63 | 5 - 232 | 0.99 | Chromo protein |
Ligands -None
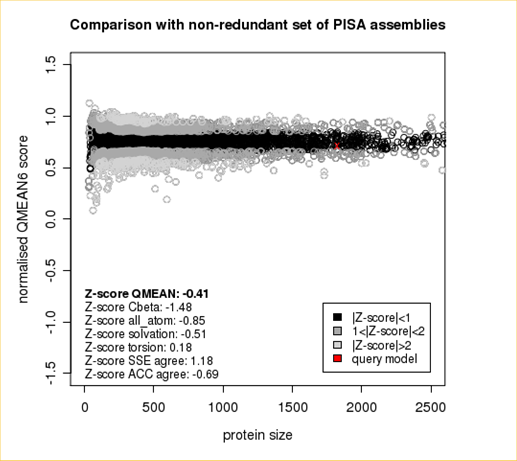
Plot 1
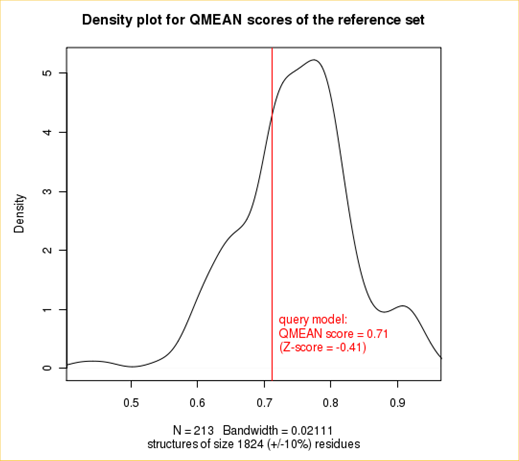
Plot 2
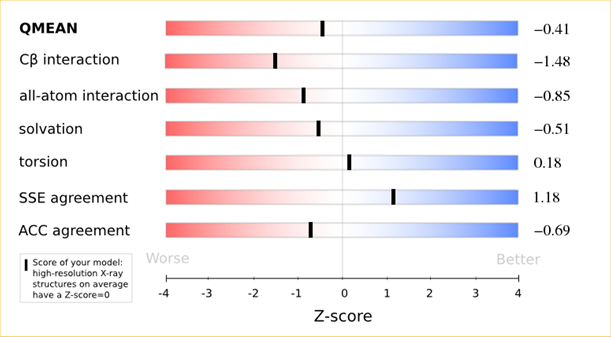
Plot 3
Plot 1
The area built by the circles colored in different shades of grey in the plot on the left hand side represent the QMEAN scores of the reference structures from the PDB. The model's QMEAN score is compared to the scores obtain for experimental structures of similar size (model size +/- 10%) and a Z-score is calculated. A Z-score (or standard score) is a score which is normalised to mean 0 and standard deviation 1. Thus the QMEAN Z-score directly indicates how many standard deviations the model's QMEAN score differs from expected values for experimental structures. In analogy, Z-scores are calculated for all four statistical potential terms as well as the agreement terms being part of the QMEAN score.
Plot 2
The plot in the middle shows the density plot (based on the QMEAN score) of all reference models used in the Z-score calculation. The location of the query model with respect to the background distribution is marked in red. This plot basically is a "projection" of the first plot for the given protein size. The number of reference models used in the calculation is shown at the bottom of the plot.
Plot 3
The analysis of these Z-scores of the individual terms can help identifying the geometrical features responsible for an observed large negative QMEAN Z-score. Models of low quality are expected to have strongly negative Z-scores for QMEAN but also for most of the contributing terms. Large negative values correspond to red regions in the color gradient. "Good structures" are expected to have all sliders in the light red to blue region.”
Ramachandran Plot- SWISS MODEL Workspace
(The following information has been contributed by SVCE_Chennai 2016)
A score of 94% in the most favoured regions as seen in the Ramachandran plot shows that the above predicted model of cjBlue, green chromoprotein is a very good prediction.
//collections/chromoprotein/uppsala
//function/reporter/pigment
| color | Blue |
| protein |

