Difference between revisions of "Part:BBa K4115039"
| Line 32: | Line 32: | ||
We put the gel beads of the experimental group and the control group on a confocal microscope for imaging observation, and found that there was a significant difference in fluorescence intensity between the two groups (Figure 2-3). Thus, the Lux system was proved to be functional between <i>E. coli</i>.<br> | We put the gel beads of the experimental group and the control group on a confocal microscope for imaging observation, and found that there was a significant difference in fluorescence intensity between the two groups (Figure 2-3). Thus, the Lux system was proved to be functional between <i>E. coli</i>.<br> | ||
| − | [[File:SfGFP in gel beads Lux-.jpg| | + | [[File:SfGFP in gel beads Lux-.jpg|430px|thumb|left|'''Figure 2:''' 10X Confocal image of the control group's gel beads. ]] |
| − | [[File:SfGFP in gel beads Lux+.jpg| | + | [[File:SfGFP in gel beads Lux+.jpg|430px|thumb|'''Figure 3:''' 10X Confocal image of the test group's gel beads. ]]<br><br><br><br><br><br><br><br><br><br><br><br><br><br><br><br><br><br><br><br><br><br><br> |
==Quantitative analysis== | ==Quantitative analysis== | ||
Revision as of 03:33, 5 October 2022
J23101-B0034-luxR-B0015-Lux pR-B0034-sfGFP-B0015
| J23101-B0034-luxR-B0015-Lux pR-B0034-sfGFP-B0015 | |
|---|---|
| Function | Gene regulator |
| Use in | E. coli |
| RFC standard | RFC 10, RFC 10 compatible |
| Backbone | pBBR1, pUC57 |
| Submitted by | ShanghaiTech_China |
This composite part is used to detect the response of LuxR (BBa_C0062) to AHL signaling molecules [1]. When LuxR receives the signal of AHL, it can regulate the downstream Lux pR (BBa_R0062) to make superfolder GFP (BBa_K4115000) express.
This part is togther used with LuxI (BBa_C0161), an AHL(3OC6 HSL here) sender. We have first transformed this composite part into the plasmid backbone PUC57 to do some validation experiments. Thus, we can later transform the plasmid into the A.caulinodans ORS571 by using the plasmid backbone pBBR1 to construct communications and regulations system between E. coli and S.elongatus HL7942 through quorum sensing signals.
Proof of function
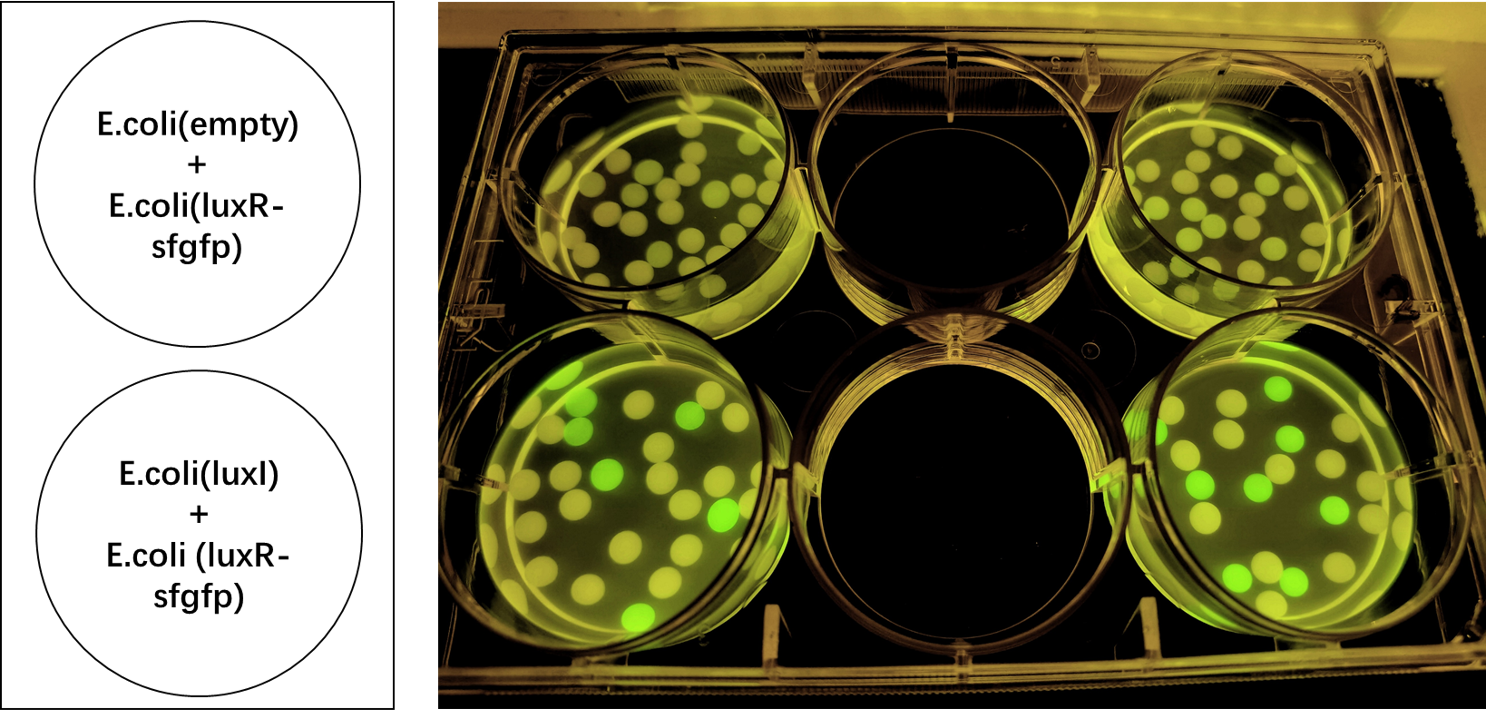
We encapsulated E. coli with this composite part and E. coli with LuxI into alginate gel beads. The E. coli with LuxI secreted the 3OC6 HSL signal molecule, and the E. coli with LuxR received the signal and regulate the expression of downstream sfGFP, making it express. So we can detect green fluorescence in the latter E. coli under the irradiation of ultraviolet light.
We put the gel beads of the experimental group and the control group on a confocal microscope for imaging observation, and found that there was a significant difference in fluorescence intensity between the two groups (Figure 2-3). Thus, the Lux system was proved to be functional between E. coli.
Quantitative analysis
Experiment approach
1. Dilute the E. coli DH5α cultures transformed with BBa_K4115039 that were stored at 4℃ 1:100 into 3ml LB medium and grow at 37℃ with shaking at 220rpm overnight.
2. Dilute the overnight cultures 1:100 into 3ml LB medium and grow at 37℃ with shaking at 220rpm for 3h. Measure their OD600 with Nanodrop One.
3. Dilute the culture with LB medium to OD600~0.1. Add 600ul diluted cultures to each 1.5ml tube. Add 0.6 ul autoinducer solution to each tube. The final concentrations of the autoinducer range from 10-4 to 10-14 M.
4. After culturing at 37℃ with shaking at 220rpm for three hours, add 200ul to each well of the black bottom 96-well plate for fluorescence intensity testing. Use an excitation wavelength of 485nm and an emission wavelength of 535nm.
5. Add 200ul to each well of the transparent 96-well plate for OD600 measurement.
Results
We process the raw data by dividing the fluorescence intensity by the OD600 and get Figure 4. Thus, we can conclude the response intensity of LuxR to 3O6C HSL at different concentrations.
The result is similar to the one in the paper [1].
Sequence and Features
- 10COMPATIBLE WITH RFC[10]
- 12INCOMPATIBLE WITH RFC[12]Illegal NheI site found at 7
Illegal NheI site found at 30 - 21COMPATIBLE WITH RFC[21]
- 23COMPATIBLE WITH RFC[23]
- 25COMPATIBLE WITH RFC[25]
- 1000INCOMPATIBLE WITH RFC[1000]Illegal BsaI.rc site found at 985
References
[1] Kylilis, N., Tuza, Z.A., Stan, GB. et al. Tools for engineering coordinated system behaviour in synthetic microbial consortia. Nat Commun 9, 2677 (2018). https://doi.org/10.1038/s41467-018-05046-2


