Difference between revisions of "Part:BBa K592010"
Crisprcaspr (Talk | contribs) |
Crisprcaspr (Talk | contribs) |
||
| Line 88: | Line 88: | ||
==Hamburg 2020 characterisation == | ==Hamburg 2020 characterisation == | ||
| − | [[File:T--Hamburg-- | + | [[File:T--Hamburg--Contribution_amilGFP_fluorescein.png|center||720px]] |
<!-- --> | <!-- --> | ||
Revision as of 01:34, 28 October 2020
amilGFP, yellow chromoprotein
This chromoprotein from the coral Acropora millepora, amilGFP, naturally exhibits strong yellow color when expressed. The color is readily visible to naked eye both in LB-culture and on agar plates. Color development can be seen in less than 24 hours of incubation.
Important: This part is not available in the registry yet, however, the same part is available from the registry with the standard RBS B0034: BBa_K1033931.
Usage and Biology
This part is useful as a reporter.
Peking iGEM 2016 has fused this part with triple spytag. The fused protein is participate in Peking’s polymer network. By adding this protein, the whole polymer network become visible in most conditions. If you want to learn more about Peking’s polymer network and the role of mRFP in this network, please click here https://parts.igem.org/Part:BBa_K1989003", https://parts.igem.org/Part:BBa_K1989045" or https://parts.igem.org/Part:BBa_K1989048".
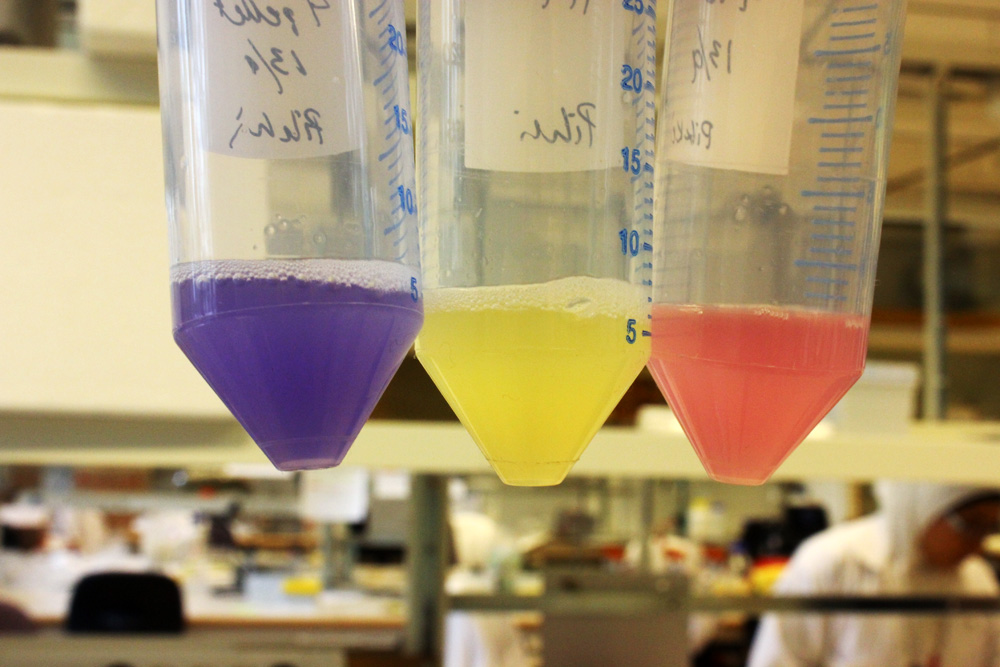
iGEM11_Uppsala-Sweden: Expression of chromoproteins. The images above show E coli constitutively expressing amilGFP BBa_K592010 (yellow), amilCP BBa_K592009 (blue), and RFP BBa_E1010 (red).
iGEM12_Uppsala_University: The Uppsala chromoprotein collection and RFP. The image shows pellets of E coli expressing chromoproteins eforRed BBa_K592012, RFP BBa_E1010, cjBlue BBa_K592011, aeBlue BBa_K864401, amilGFP BBa_K592010 and amilCP BBa_K592009.
iGEM17_SJTU_BioX_Shanghai:
J23119+Target3+amilGFP BBa_K2285013
J23119+Target1+amilGFP BBa_K2285017
An improved part has been constructed. Since this part is a coding sequence, we added a RBS which is on the upstream of sfGFP BBa_K515005 and terminator BBa_B1006 by PCR. What's more, our device have a stem-loop structure(called Target) following the constitutive promoter J23119, to achieve further control of amilGFP expression.
iGEM18_Bulgaria:
This part was characterized by the iGEM Bulgaria 2018 team. We cloned this chromoprotein CDS into a high copy number vector pSB1C3 that contains part BBa_K608002 (strong promoter and strong RBS). Additionally similar constructs with amilCP, cjBlue, gfasPurple, eforRed and spisPink were prepared. We tested all these constructs for colour stability upon re-cultivation. Under these conditions, most of the proteins showed as a severe metabolic burden to the host cells, leading to small sizes of the colonies and color loss upon re-cultivation. The exception was the amilGFP protein - it was stable enough to be used under the control of a strong promoter and on a high copy number vector. We also measured its growth kinetics in comparison with the standard pSB1C3 vector (with a red colour device) and a pSB1C3 vector with an AmilGFP CDS (without promoter and RBS, used as a control). The obtained data were normalized to AmilGFP-CDS vector (value of 1.00). The growth rate of pSB1C3-Amil GFP is 0.52 and the pSB1C3-mRFP red colour device (not with a strong promoter) has a value of 0,85. Despite these results we found that the AmilGFP was the only chromoprotein from the group tested that was always stable upon re-cultivation.
Next we tested the AmilGFP expression from our construct in LB media with increased levels of NaCl. The results can be seen on the following figure:
iGEM19_SCU-China:
This part was characterized in the measurement of amilGFP's absorption and emission spectra by the iGEM2019 SCU-China team. To express this chromoprotein, we cloned this part downstream T7 promoter on pET21α vector and transformed this T7-amilGFP-pET21α into E.coli BL21 cells.We verified our construction by restriction digestion (generating a fragment of 705 bp and a fragment of 5424 bp) and sequencing.(Figure 1)
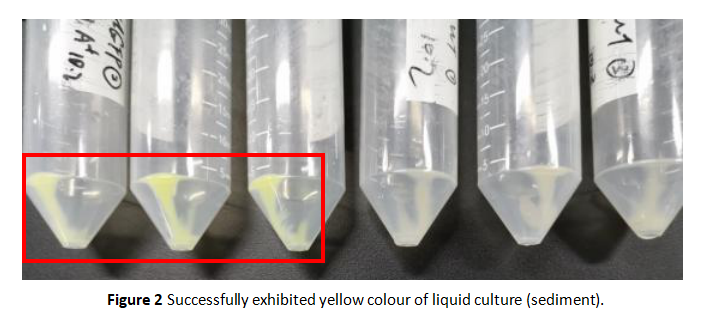
The amilGFP protein was visible in yellow colour less than 24-hour incubation after adding IPTG both on LB plates or in liquid culture.(Figure 2)
In order to measure the absorption and emission spectra of amilGFP, we cultured engineered E.coli cells in liquid LB medium, induced the expression of amilGFP with IPTG and incubated at 37℃ overnight. After centrifugation, Cells were treated with 5ml PBS, disrupted through ultrasonication and then centrifuged again, the supernatant was transferred into a new tube and measured with the Microplate Reader in a range between 300-700 nm. The absorption peak is 502 nm and the emission peak was at 512 nm.(Figure 3)
References
[http://www.ncbi.nlm.nih.gov/pubmed/18648549] Alieva, N. O., et al. 2008. Diversity and evolution of coral fluorescent proteins. PLoS One 3:e2680.
GenBank: AY646067.1
Shanghai_HS_United 2019's characterization
BBa_K592010 amilGFP, yellow chromoprotein
The E. coli expressing blue fluorescent protein(amilGFP) were cultured at 28 °C and the overnight bacterial solution was collected for subsequent measurement.
After ultrasonically disruption of the above bacterial solution ,5 ul of each was added to 4 kinds of 45 ul solution having a pH of 3, 5, 7, and 9, and the fluorescence was measured using varioskan flash of Thermo Scientific. The excitation wavelength/emission wavelength corresponding to each fluorescent protein is: amilGFP: 395/509.
Fig1. Fluorescence of amilGFP under different pH.There were two kinds of amilGFP expressing in E.coli(amilGFP) and expressing in E.coli after ultrasonically disruption(amilGFP -UC). Under the same pH3 and pH5, the fluorescence of amilGFP was higher than amilGFP-UC. Under the same pH7 and pH9, the fluorescence of amilGFP was lower than amilGFP-UC. With increasing of pH( among pH3, pH5, pH7,), the fluorescence of amilGFP and amilGFP-UC all raised. When the pH increased from pH7 to pH9, the fluorescence of amilGFP and amilGFP-UC were all down.
The results showed that the fluorescent value of each fluorescent protein did not change significantly in acid and alkali circumstance before sonication, but after sonication, each fluorescent protein showed the highest fluorescent value at pH 7, and the fluorescent value decreased as the environment became more acidic.
Shanghai-United 2019's characterization
BBa_K592010 amilGFP, yellow chromoprotein
The fluorescence intensity of fluorescent protein is related to protein expression. The protein expression level is related to the culture time and culture temperature. In addition, the fluorescence intensity of fluorescent protein is also related to excitation and emission spectra. We designed experiments to explore the effects of the above three factors on the intensity of fluorescent protein.
1. We transformed the plasmid contanining gfp, amilgfp into bacterial competent cells separately separately, plated and cultured overnight at 37 °C.
2. On the evening of the next day, we picked single clone into a tube containing 5 ml LB which is called 0h. At the same time, we also inoculated competent DH5α strain into a tube containing 5 ml LB as a blank control.We culture bacterial cells at 37 ° C, 220 rpm. The sampling time point is 24h.
3. We took 100ul of the bacteria culture and measured the total fluorescence with a Thermo fluorescence microplate reader. We took 200ul of the ten-fold diluted bacterial solution and measured the OD600 with BioTek optical microplate reader. Total fluorescence is divided by OD600 to obtain fluorescence value per OD600 .
Figure1. GFP containing strain RFU/OD600 at different emission Wavelength.
The Bba_K608008 strain RFU/OD600 of the strain varies with the emission wavelength. The overall curve showed a normal distribution and the RFU/OD600 of the strain reachs its maximum at 514 nm. The BBa_k1073024 strain RFU/OD600 of the strain varies with the emission wavelength. The overall curve showed a normal distribution and the RFU/OD600 of the strain reachs its maximum at 512 nm. The absorbance value of the blank control DH5α and H2O are close to zero.
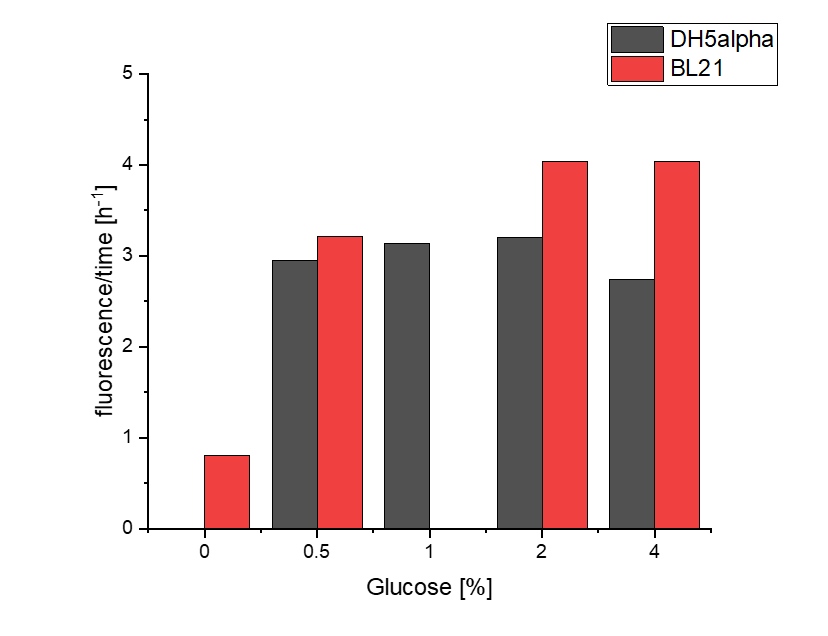
Hamburg 2020 characterisation
Sequence and Features
- 10COMPATIBLE WITH RFC[10]
- 12COMPATIBLE WITH RFC[12]
- 21COMPATIBLE WITH RFC[21]
- 23COMPATIBLE WITH RFC[23]
- 25COMPATIBLE WITH RFC[25]
- 1000COMPATIBLE WITH RFC[1000]


