Difference between revisions of "Part:BBa K525562"
(→References) |
|||
| Line 101: | Line 101: | ||
===References=== | ===References=== | ||
| + | Monod J (1949) The growth of bacterial cultures, ''Annu Rev Microbiol'' [http://www.annualreviews.org/doi/abs/10.1146/annurev.mi.03.100149.002103 3:371-394]. | ||
| + | |||
<biblio> | <biblio> | ||
#Sasaki pmid=18492046 | #Sasaki pmid=18492046 | ||
#Sasaki05a pmid=16332782 | #Sasaki05a pmid=16332782 | ||
</biblio> | </biblio> | ||
Revision as of 19:15, 28 October 2011
Fusion protein of NADP+ Oxidoreductase and BisdA and BisdB with middle strong promoter,RBS
Fusion protein of ferredoxin-NADP+ oxidoreductase, BisdA and BisdB; RFC 25 (Freiburg BioBrick assembly standard) for characterization of intra- and extracellular BPA degradation.
Usage and Biology
Expressing this BioBrick in E. coli enables the bacterium to degrade the endocrine disruptor bisphenol A (BPA).
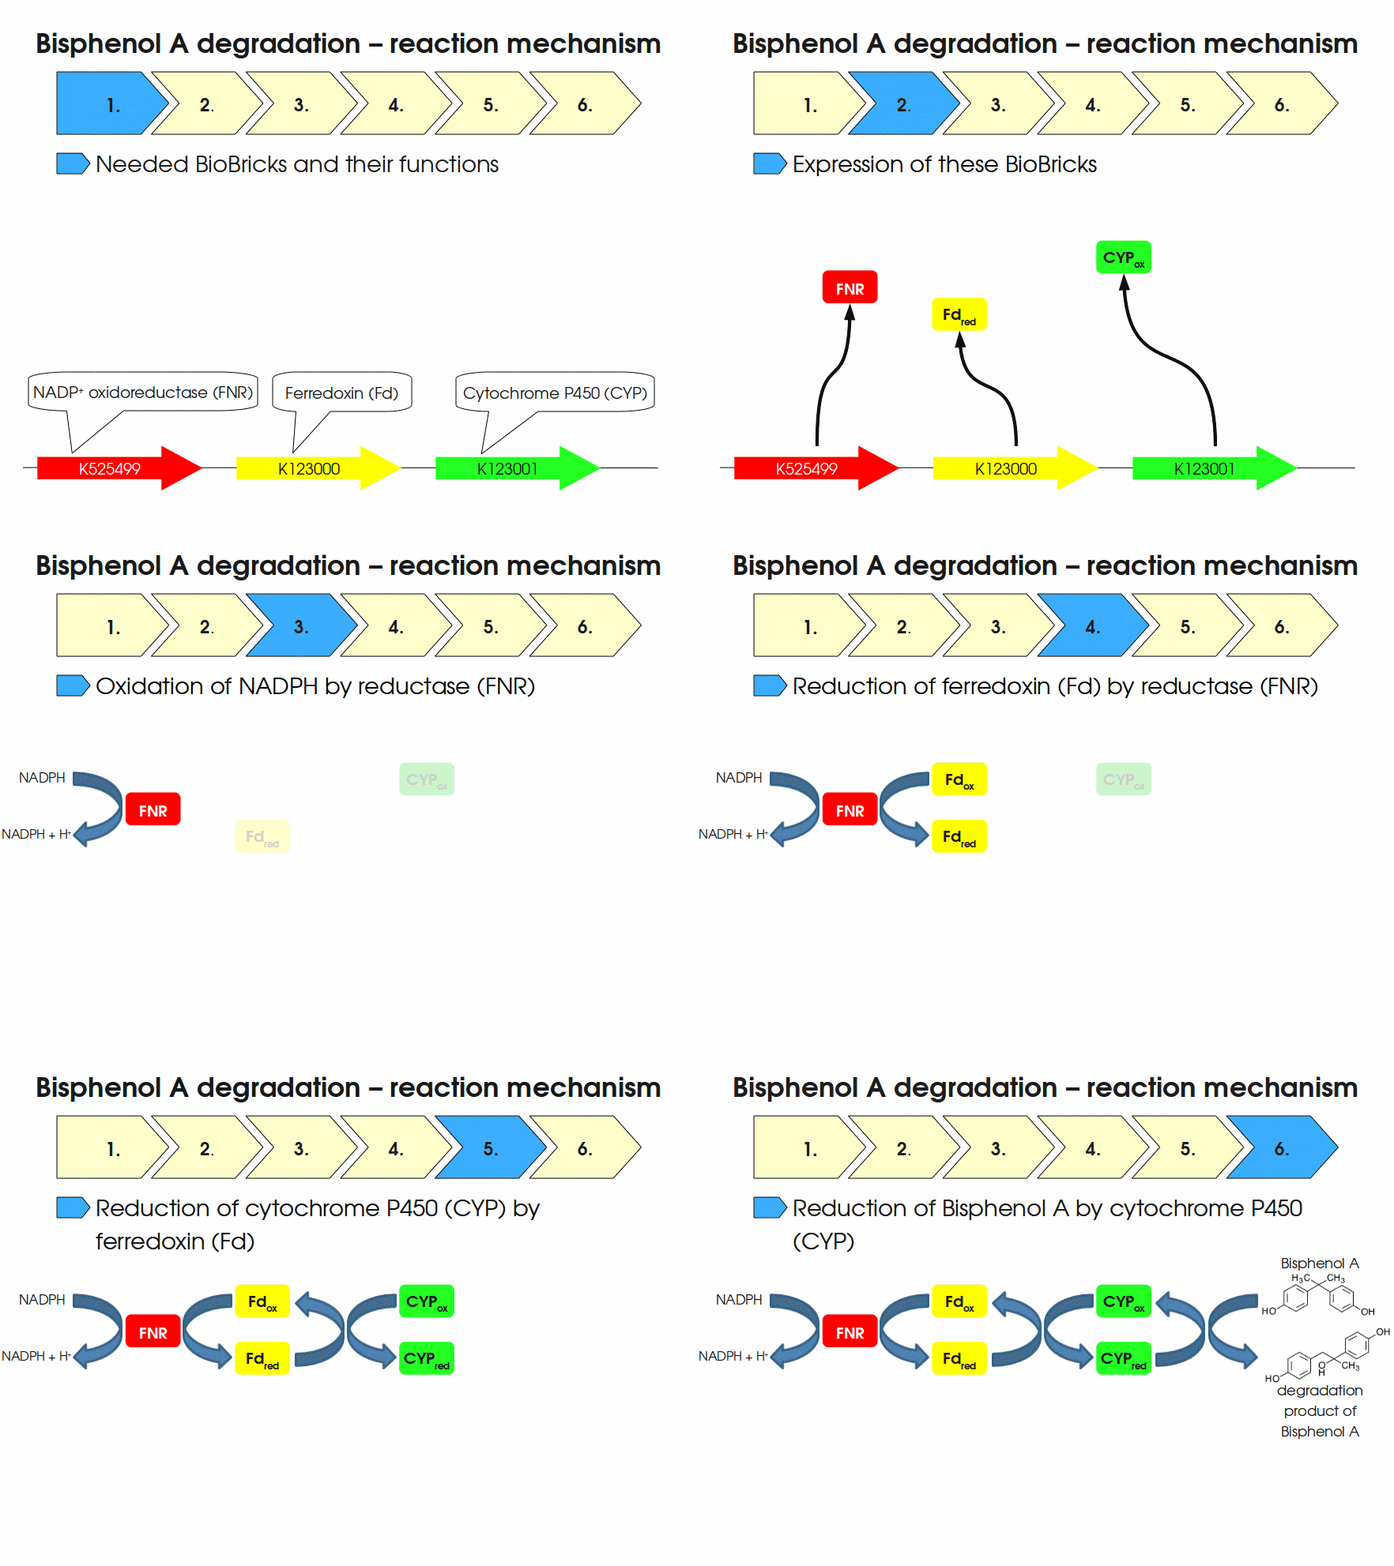
BPA is mainly hydroxylated into the products 1,2-Bis(4-hydroxyphenyl)-2-propanol and 2,2-Bis(4-hydroxyphenyl)-1-propanol. In S. bisphenolicum AO1, a total of three genes are responsible for this BPA hydroxylation: a cytochrome P450 (CYP, bisdB), a ferredoxin (Fd, bisdA) and a ferredoxin-NAD+ oxidoreductase (FNR) Sasaki05a. The three gene products act together to reduce BPA while oxidizing NADH + H+. The cytochrome P450 (BisdB) reduces the BPA and is oxidized during this reaction. BisdB in its oxidized status is reduced by the ferredoxin (BisdA) so it can reduce BPA again. The oxidized BisdA is reduced by a ferredoxin-NAD+ oxidoreductase consuming NADH + H+ so the BPA degradation can continue Sasaki05a. This electron transport chain between the three enzymes involved in BPA degradation and the BioBricks needed to enable this reaction in vivo and in vitro are shown in the following figure (please have some patience, it's an animated .gif file):

Sequence and Features
- 10COMPATIBLE WITH RFC[10]
- 12INCOMPATIBLE WITH RFC[12]Illegal NheI site found at 7
Illegal NheI site found at 30 - 21INCOMPATIBLE WITH RFC[21]Illegal BamHI site found at 1411
Illegal BamHI site found at 2149 - 23COMPATIBLE WITH RFC[23]
- 25INCOMPATIBLE WITH RFC[25]Illegal NgoMIV site found at 65
Illegal AgeI site found at 2402 - 1000INCOMPATIBLE WITH RFC[1000]Illegal BsaI.rc site found at 746
Bisphenol A degradation with E. coli
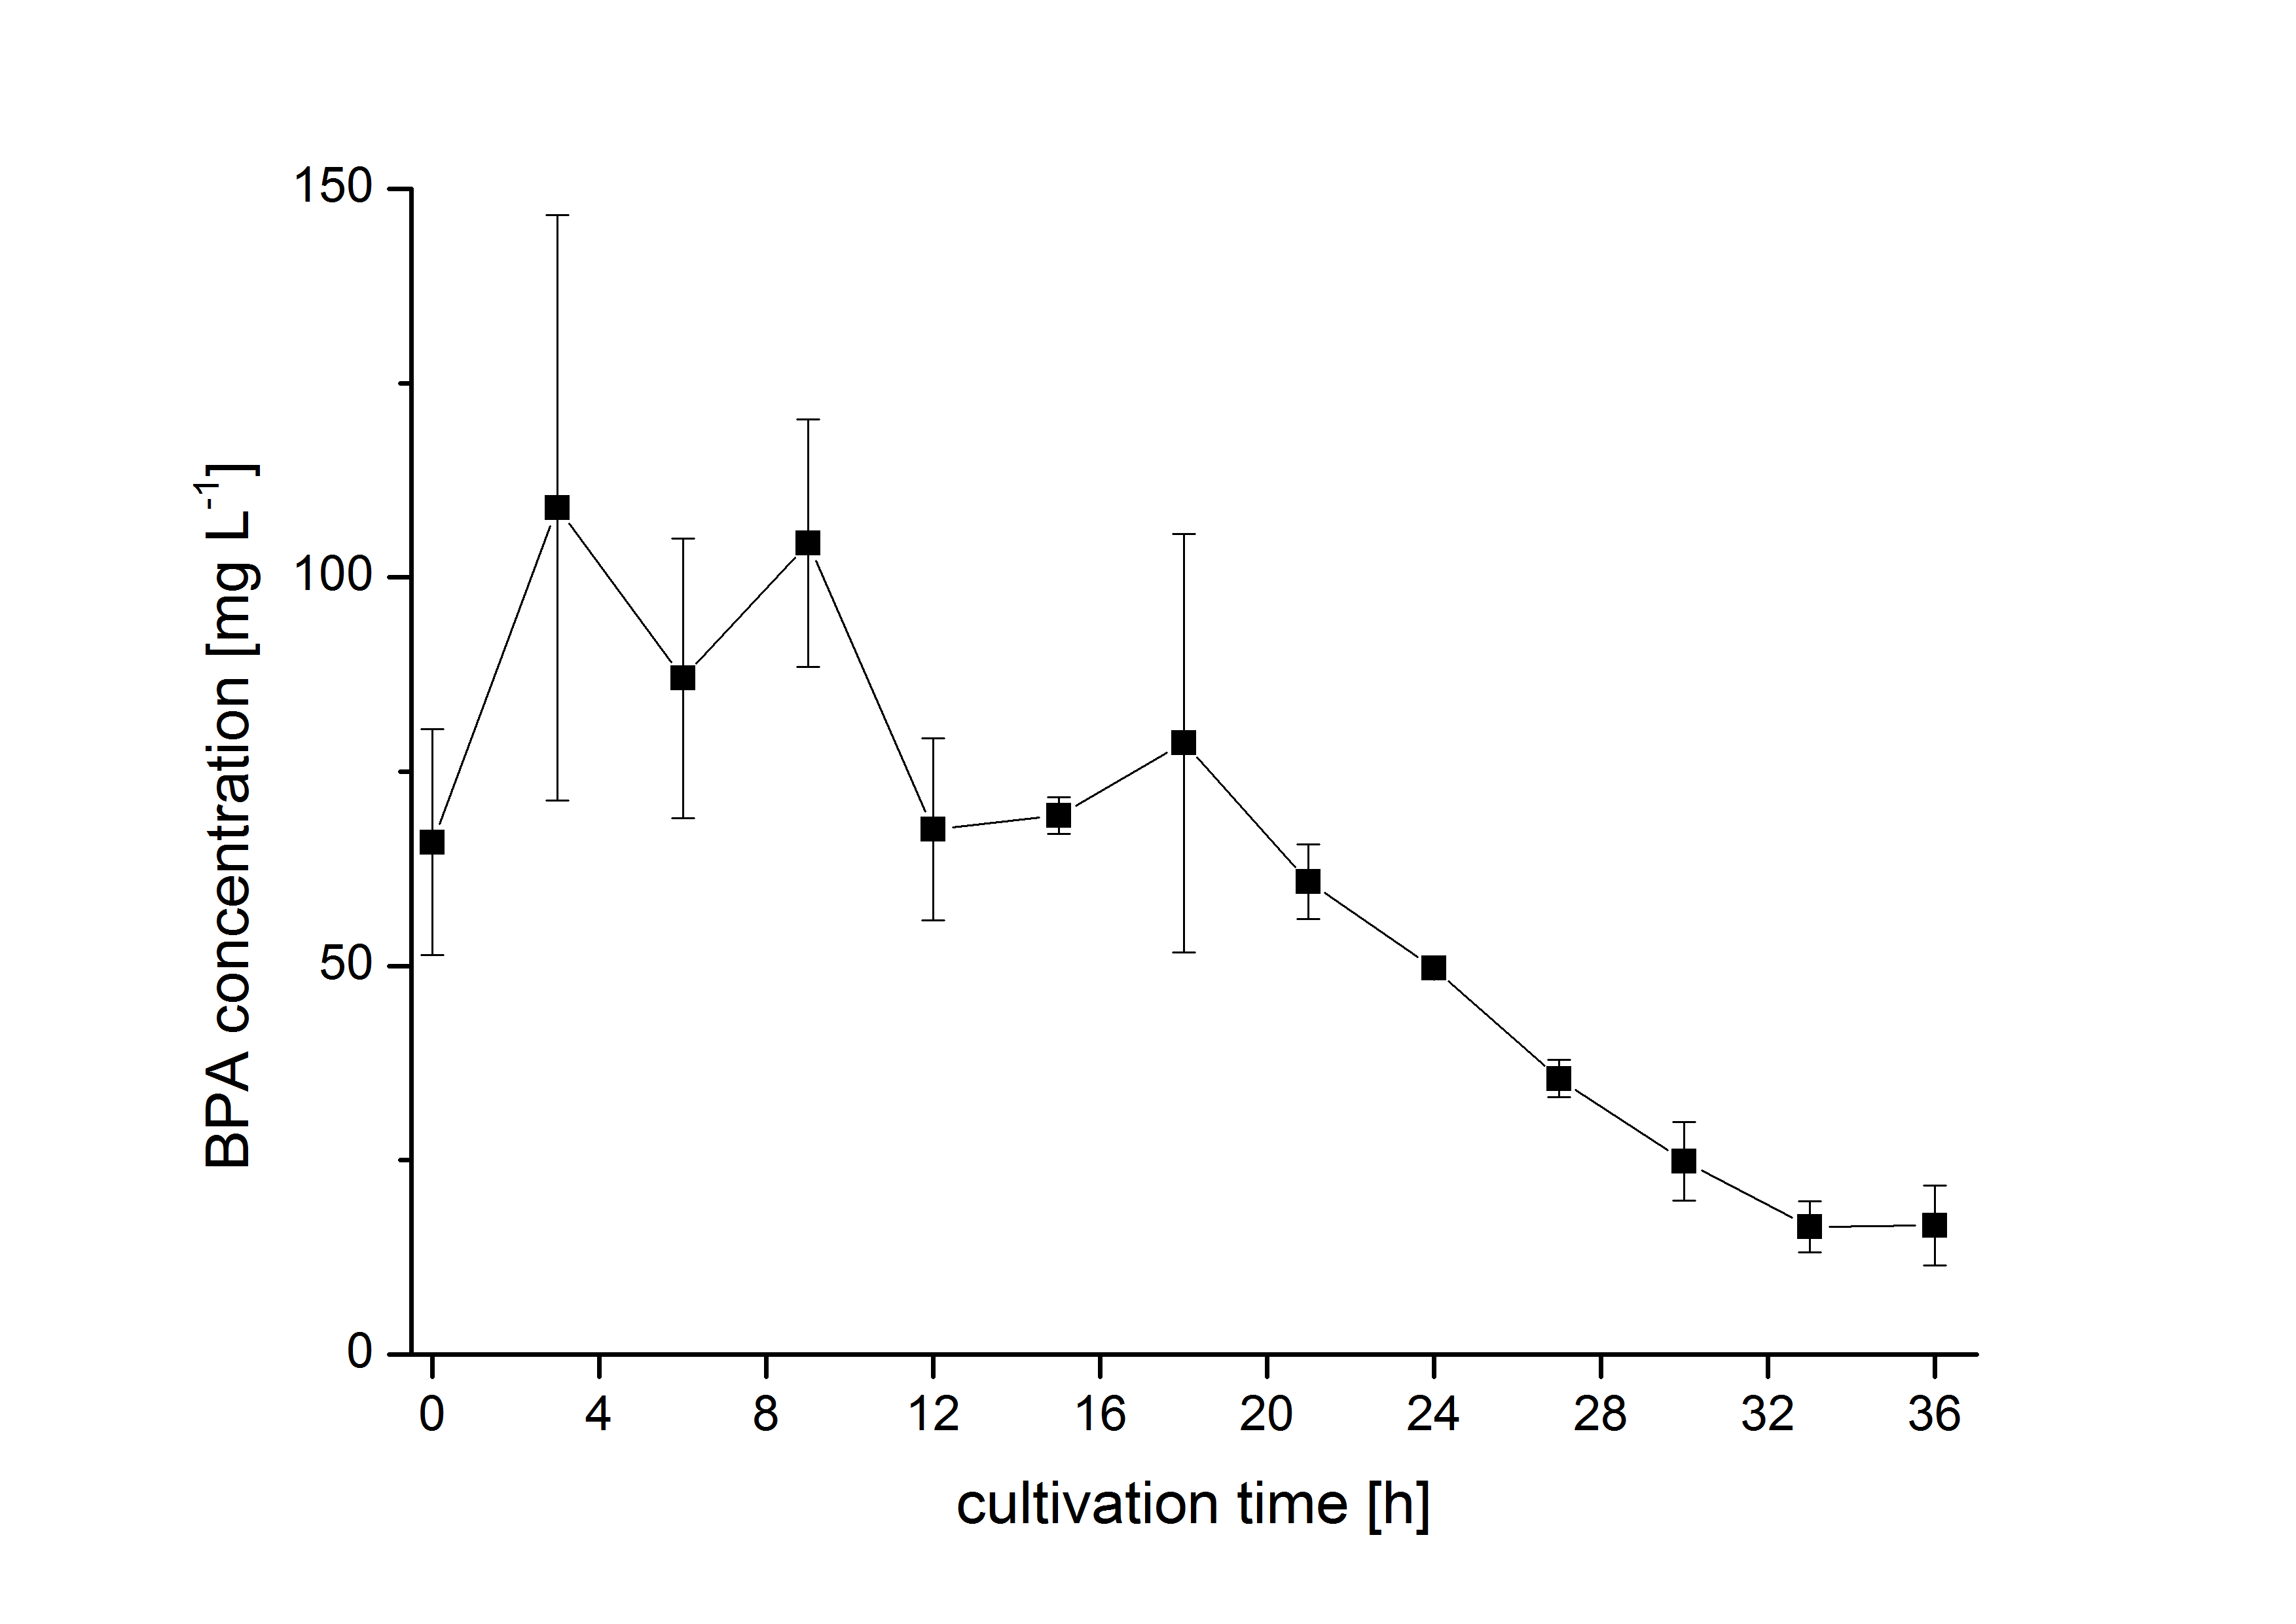
The bisphenol A degradation with the BioBricks BBa_K123000, BBa_K123001 and BBa_K525499 works in E. coli KRX in general. Because [http://onlinelibrary.wiley.com/doi/10.1111/j.1365-2672.2008.03843.x/full Sasaki et al. (2008)] reported problems with protein folding in E. coli which seem to avoid a complete BPA degradation, we did not cultivate at 37 °C and we did not use the strong T7 promoter as [http://onlinelibrary.wiley.com/doi/10.1111/j.1365-2672.2008.03843.x/full Sasaki et al. (2008)] did for expressing these BioBricks but we cultivated at 30 °C and we used a medium strong constitutive promoter (BBa_J23110). 30 °C is in addition the cultivation temperature of S. bisphenolicum AO1. With this promoter upstream of the gene expressing the bisdA | bisdB |FNR fusion protein we were able to degrade a substantial amount (~85%) of BPA in about 36 h starting at 120 mg L-1 BPA . This data is shown in the following figure and indicates that the fusion protein of all three enzymes that are involved in the degradation of BPA is functional:

Modelling of intracellular bisphenol A degradation
The modelling was done with the software [http://www.berkeleymadonna.com/ Berkeley Madonna] using the [http://en.wikipedia.org/wiki/Runge–Kutta_methods#Common_fourth-order_Runge.E2.80.93Kutta_method common fourth-order Runge-Kutta] method to solve the equations. The model was fitted to the measured data shown above by the function "curve fit" in Berkeley Madonna to calculate the parameters, constants etc.
To model the BPA degradation by E. coli carrying BioBricks for BPA degradation (BBa_K525499, BBa_K123000 and BBa_K123001) the cell growth has to be described first to calculate a specific BPA degradation rate per cell. Cell growth is a [http://en.wikipedia.org/wiki/First_order_kinetics#First-order_reactions first-order reaction] and is mathematically described as
with the specific growth rate µ and the cell count X. The specific growth rate is dependent on the concentration of the growth limiting substrate (e.g. glucose) and can be described as
with the substrate concentration S, the Monod constant KS and the maximal specific growth rate µmax ([http://www.annualreviews.org/doi/abs/10.1146/annurev.mi.03.100149.002103 Monod, 1949]). Because LB medium is a complex medium we cannot measure the substrate concentration so we have to assume an imaginary substrate concentration. The amount of a substrate S can be modelled as follows
with the specific substrate consumption rate per cell qS. The whole model for the diauxic growth of E. coli on LB medium with two not measurable (imaginary) substrates looks like:
The specific BPA degradation rate per cell qD is modelled with an equation like eq. (2) because it is dependent from the BPA concentration. The BPA degradation starts in the stationary growth phase when the imaginary substrate is consumed. The model for this behavior is as follows:
with the maximal specific BPA degradation rate per cell qD,max and the constant KD.
Fig. 2 shows a comparison between modelled and measured data for cultivations with BBa_K525562 in E. coli KRX. In Tab. 2 the parameters for the model are given, obtained by curve fitting the model to the data.

Tab. 2: Parameters of the model.
| Parameter | BBa_K525562 |
|---|---|
| X0 | 0.115 108 mL-1 |
| µmax | 1.730 h-1 |
| KS,1 | 13.87 AU-1 |
| S1,0 | 3.003 AU |
| qS,1 | 0.240 AU 10-8 cell-1 |
| BPA0 | 0.45 mM |
| qD,max | 1.32 10-10 mM cell-1 |
| KD | 0.121 mM cell-1 |
References
Monod J (1949) The growth of bacterial cultures, Annu Rev Microbiol [http://www.annualreviews.org/doi/abs/10.1146/annurev.mi.03.100149.002103 3:371-394].
<biblio>
- Sasaki pmid=18492046
- Sasaki05a pmid=16332782
</biblio>


