Difference between revisions of "Part:BBa K592010"
(→Characterization by 2021iGEM_The_Webb_Schools) |
|||
| (51 intermediate revisions by 14 users not shown) | |||
| Line 2: | Line 2: | ||
<partinfo>BBa_K592010 short</partinfo> | <partinfo>BBa_K592010 short</partinfo> | ||
| − | This chromoprotein from the coral ''Acropora millepora'', amilGFP, naturally exhibits strong yellow color when expressed. The color is readily visible to naked eye both in LB-culture and on agar plates. Color development can be seen in less than 24 hours of incubation. | + | This chromoprotein from the coral ''Acropora millepora'', amilGFP, naturally exhibits strong yellow color when expressed. The color is readily visible to naked eye both in LB-culture and on agar plates. Color development can be seen in less than 24 hours of incubation. |
| + | |||
| + | |||
| + | '''Important: This part is not available in the registry yet, however, the same part is available from the registry with the standard RBS B0034: <partinfo>BBa_K1033931</partinfo>.''' | ||
| + | |||
===Usage and Biology=== | ===Usage and Biology=== | ||
This part is useful as a reporter. | This part is useful as a reporter. | ||
| + | |||
| + | Peking iGEM 2016 has fused this part with triple spytag. The fused protein is participate in Peking’s polymer network. By adding this protein, the whole polymer network become visible in most conditions. If you want to learn more about Peking’s polymer network and the role of mRFP in this network, please click here https://parts.igem.org/Part:BBa_K1989003", https://parts.igem.org/Part:BBa_K1989045" or https://parts.igem.org/Part:BBa_K1989048". | ||
[[Image:AmilCP_amilGFP_RFP.jpg|300px]] | [[Image:AmilCP_amilGFP_RFP.jpg|300px]] | ||
[[Image:On cultures BYR small.jpg|300px]] | [[Image:On cultures BYR small.jpg|300px]] | ||
[[Image:Pellets BYR.jpg|300px]] | [[Image:Pellets BYR.jpg|300px]] | ||
| − | |||
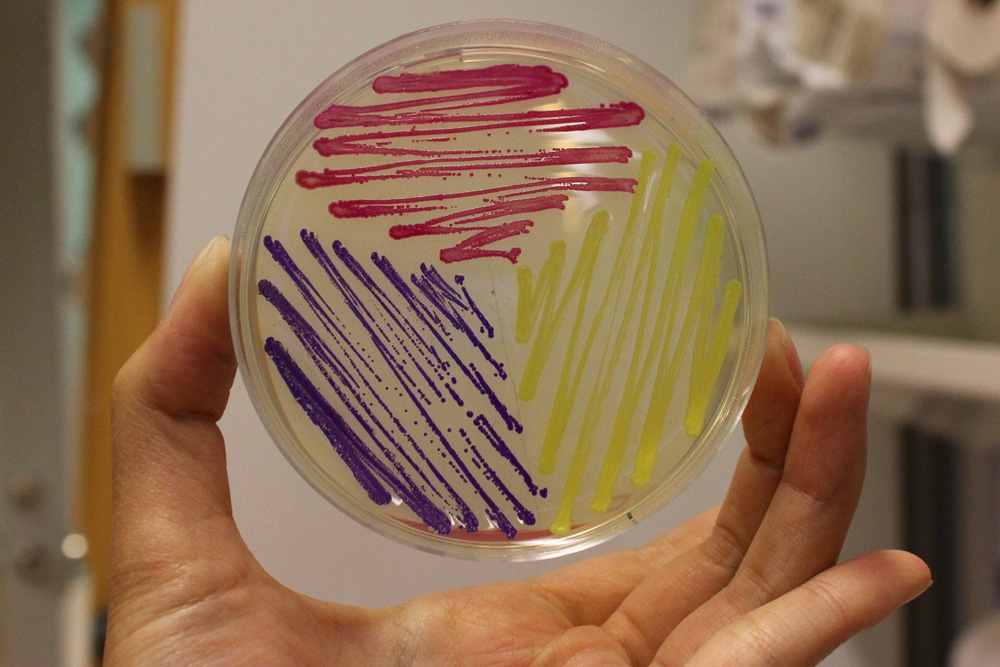
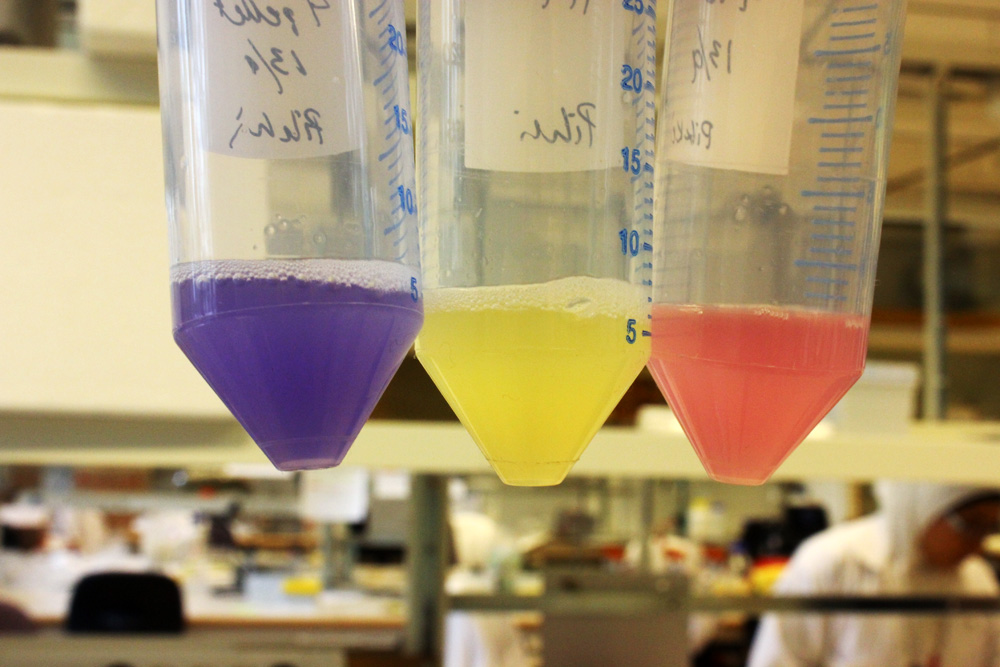
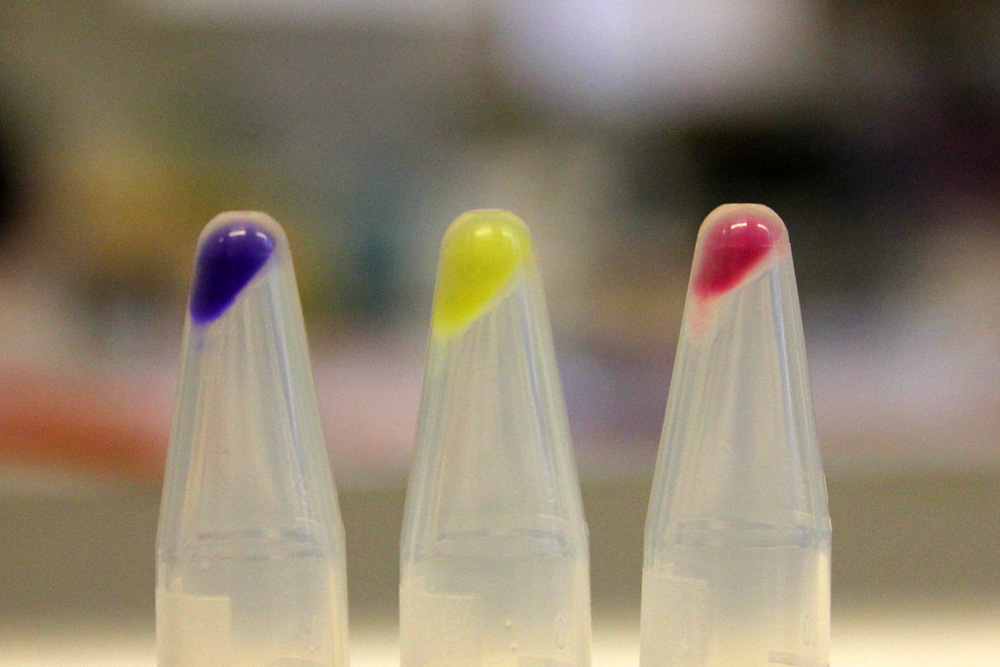
'''iGEM11_Uppsala-Sweden:''' Expression of chromoproteins. The images above show ''E coli'' constitutively expressing amilGFP BBa_K592010 (yellow), amilCP <partinfo>BBa_K592009</partinfo> (blue), and RFP <partinfo>BBa_E1010</partinfo> (red). | '''iGEM11_Uppsala-Sweden:''' Expression of chromoproteins. The images above show ''E coli'' constitutively expressing amilGFP BBa_K592010 (yellow), amilCP <partinfo>BBa_K592009</partinfo> (blue), and RFP <partinfo>BBa_E1010</partinfo> (red). | ||
| + | |||
| + | [[Image:UUChromo.jpg|600px]] | ||
| + | |||
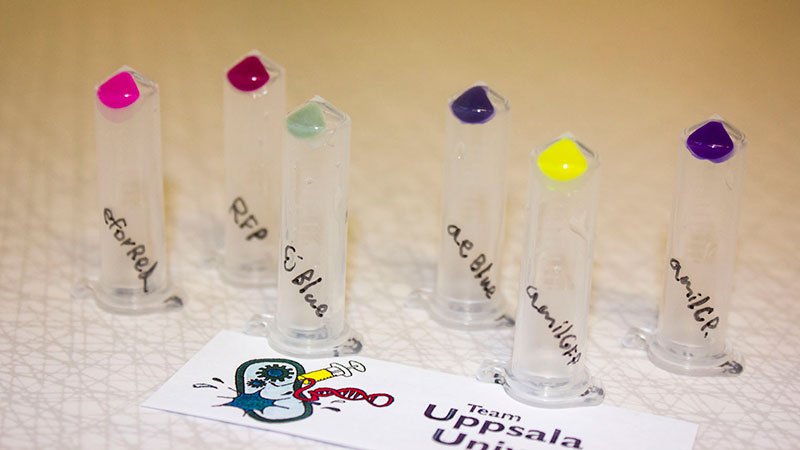
| + | '''iGEM12_Uppsala_University:''' The Uppsala chromoprotein collection and RFP. The image shows pellets of ''E coli'' expressing chromoproteins eforRed <partinfo>BBa_K592012</partinfo>, RFP <partinfo>BBa_E1010</partinfo>, cjBlue <partinfo>BBa_K592011</partinfo>, aeBlue <partinfo>BBa_K864401</partinfo>, amilGFP <partinfo>BBa_K592010</partinfo> and amilCP <partinfo>BBa_K592009</partinfo>. | ||
| + | |||
| + | [[Image:amilGFP.JPG|420px]] | ||
| + | |||
| + | '''iGEM17_SJTU_BioX_Shanghai:''' | ||
| + | |||
| + | '''J23119+Target3+amilGFP '''<partinfo>BBa_K2285013</partinfo><br> | ||
| + | '''J23119+Target1+amilGFP ''' <partinfo>BBa_K2285017</partinfo><br> | ||
| + | |||
| + | An improved part has been constructed. Since this part is a coding sequence, we added a RBS which is on the upstream of sfGFP <partinfo>BBa_K515005</partinfo> and terminator <partinfo>BBa_B1006</partinfo> by PCR. What's more, our device have a stem-loop structure(called Target) following the constitutive promoter J23119, to achieve further control of amilGFP expression. | ||
| + | |||
| + | |||
| + | '''iGEM18_Bulgaria:''' | ||
| + | |||
| + | This part was characterized by the iGEM Bulgaria 2018 team. We cloned this chromoprotein CDS into a high copy number vector pSB1C3 that contains part <partinfo>BBa_K608002</partinfo> (strong promoter and strong RBS). Additionally similar constructs with amilCP, cjBlue, gfasPurple, eforRed and spisPink were prepared. We tested all these constructs for colour stability upon re-cultivation. Under these conditions, most of the proteins showed as a severe metabolic burden to the host cells, leading to small sizes of the colonies and color loss upon re-cultivation. The exception was the amilGFP protein - it was stable enough to be used under the control of a strong promoter and on a high copy number vector. | ||
| + | We also measured its growth kinetics in comparison with the standard pSB1C3 vector (with a red colour device) and a pSB1C3 vector with an AmilGFP CDS (without promoter and RBS, used as a control). The obtained data were normalized to AmilGFP-CDS vector (value of 1.00). The growth rate of pSB1C3-Amil GFP is 0.52 and the pSB1C3-mRFP red colour device (not with a strong promoter) has a value of 0,85. Despite these results we found that the AmilGFP was the only chromoprotein from the group tested that was always stable upon re-cultivation. | ||
| + | |||
| + | |||
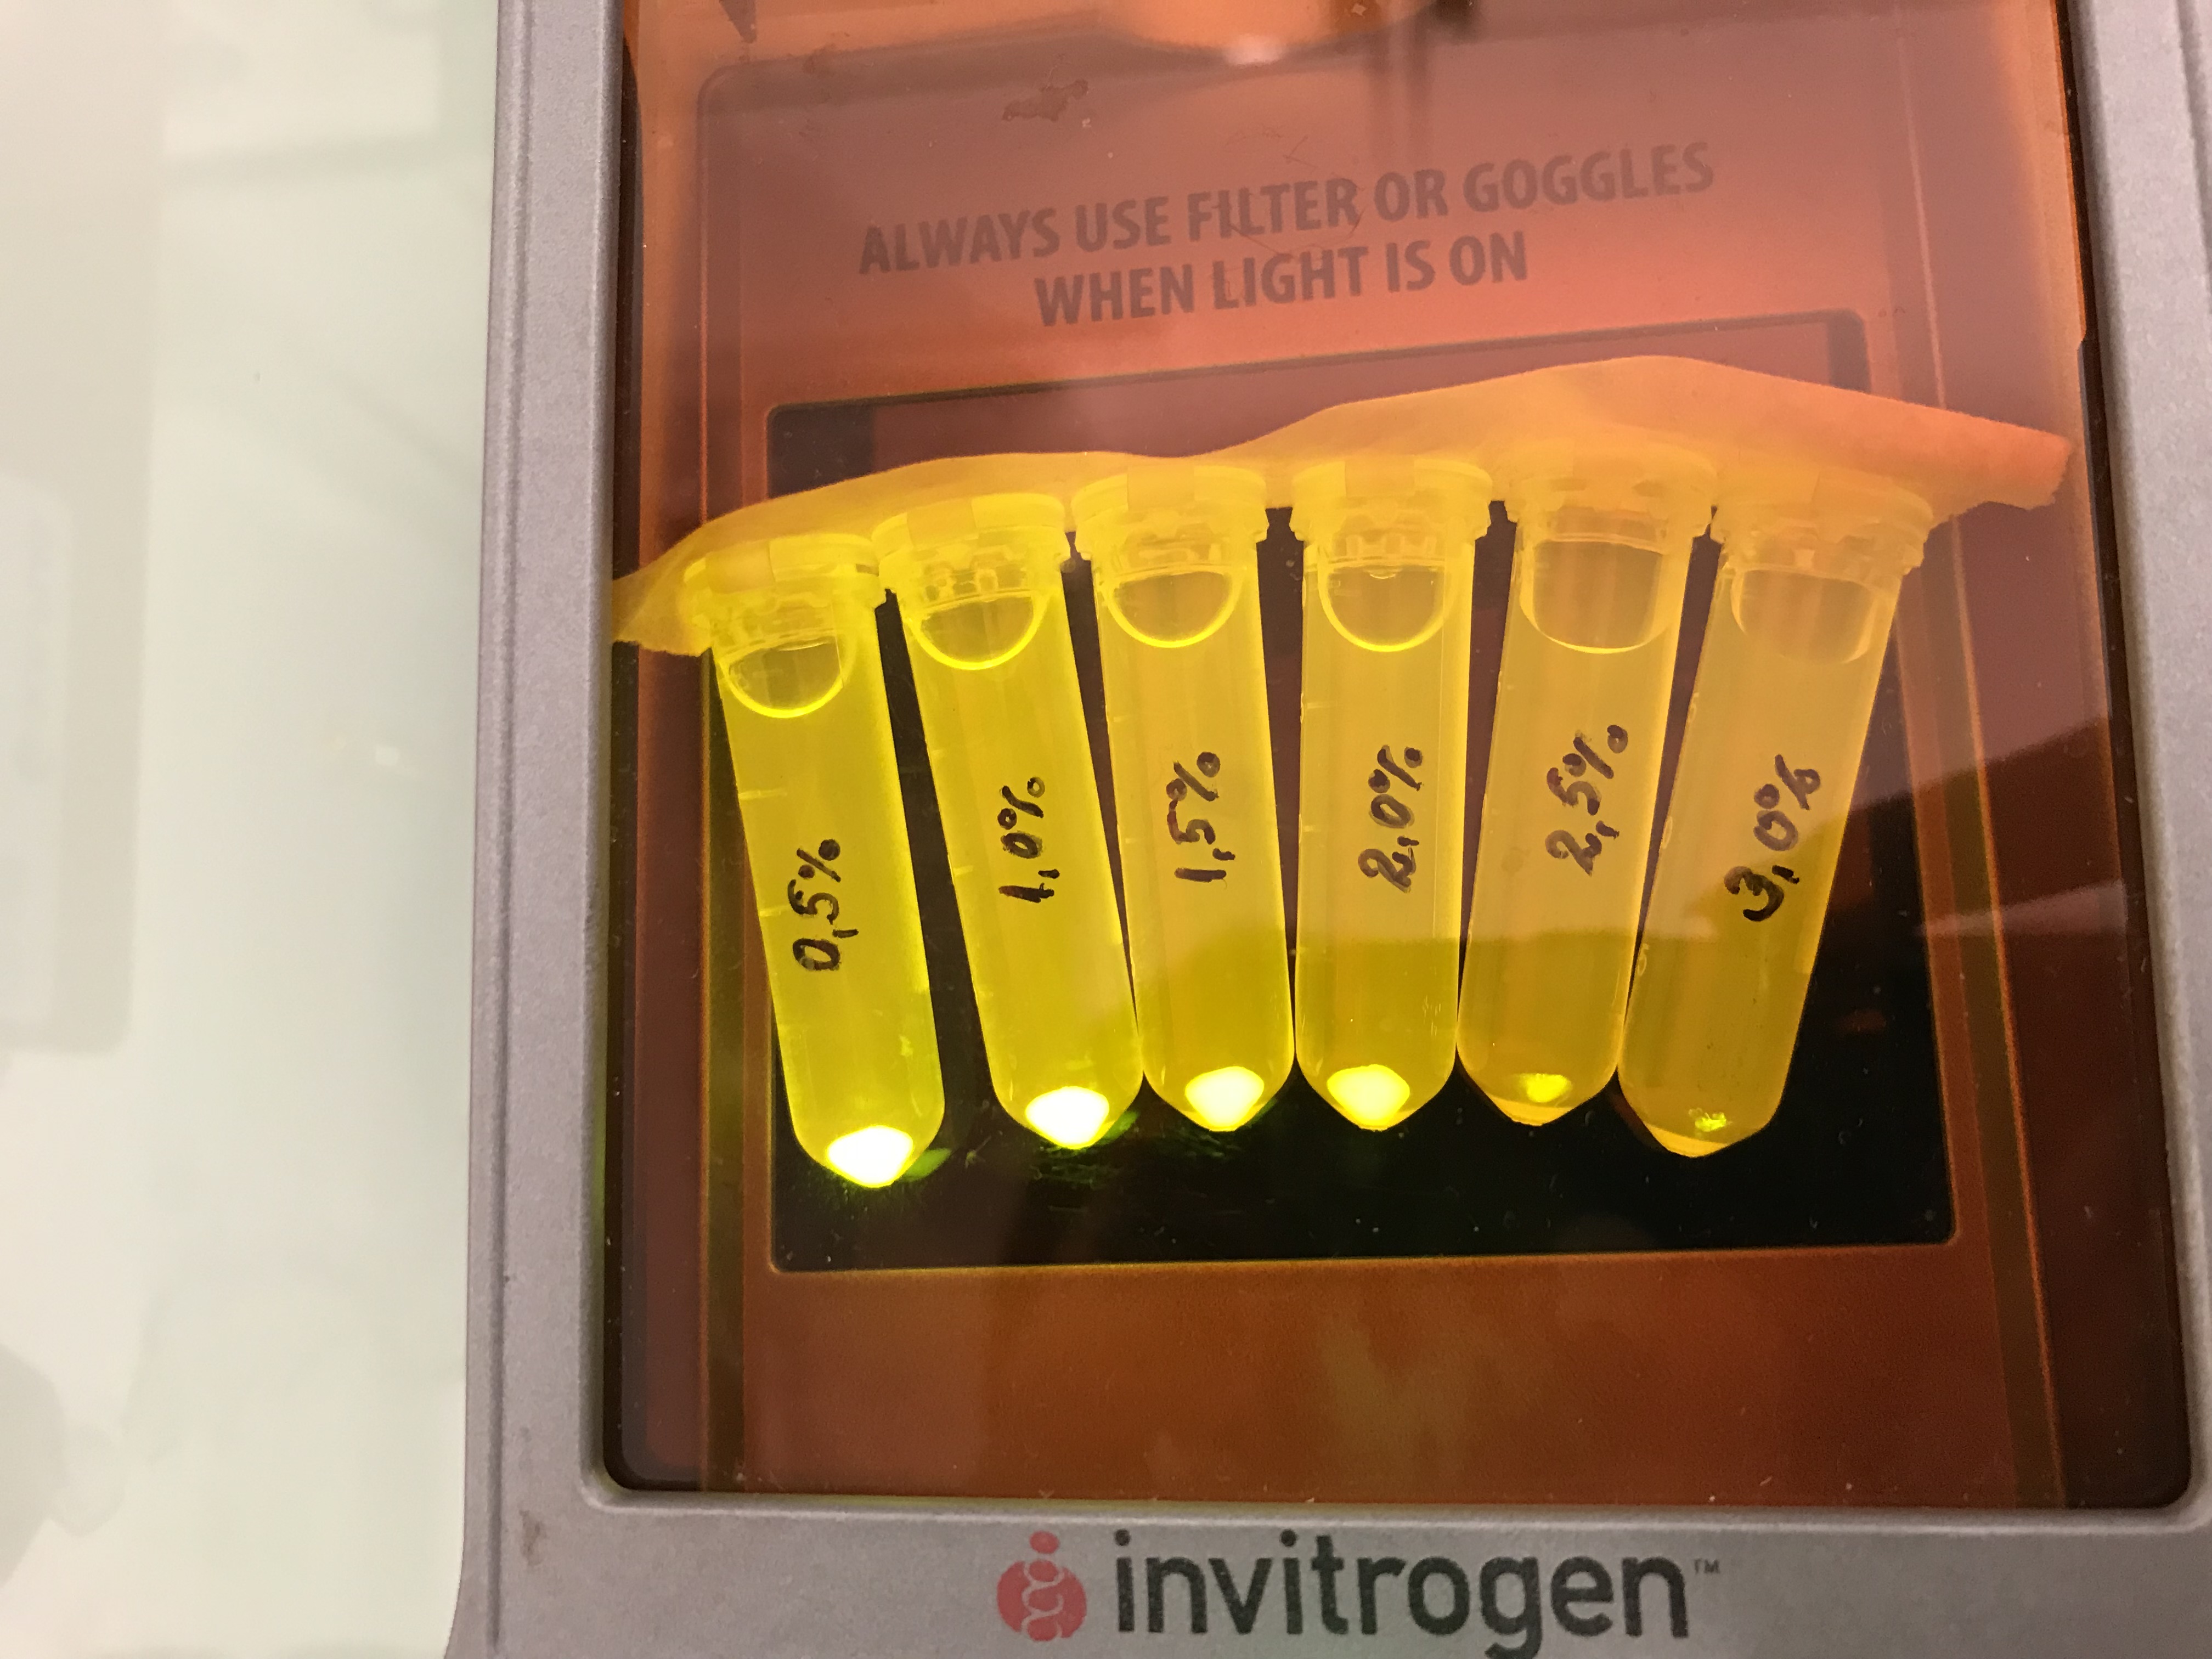
| + | Next we tested the AmilGFP expression from our construct in LB media with increased levels of NaCl. The results can be seen on the following figure: | ||
| + | |||
| + | [[File:AmilGFP_salt.jpg|300px|AmilGFP expression - LB media with different levels of NaCl]] | ||
| + | |||
| + | =='''iGEM19_SCU-China:'''== | ||
| + | |||
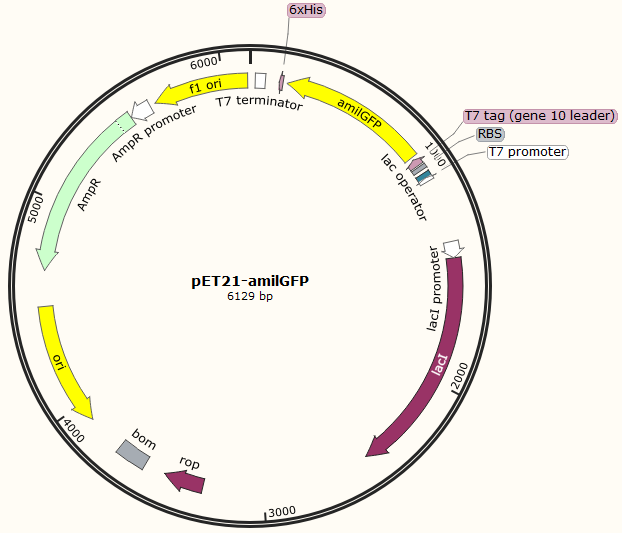
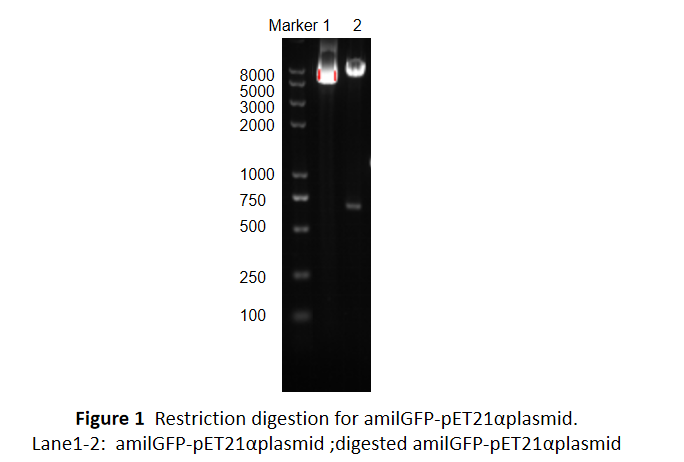
| + | This part was characterized in the measurement of amilGFP's absorption and emission spectra by the iGEM2019 SCU-China team. To express this chromoprotein, we cloned this part downstream T7 promoter on pET21α vector and transformed this T7-amilGFP-pET21α into E.coli BL21 cells.We verified our construction by restriction digestion (generating a fragment of 705 bp and a fragment of 5424 bp) and sequencing.(Figure 1) | ||
| + | |||
| + | |||
| + | [[File:measurement 1.png|420px|center|]] | ||
| + | [[File:measurement 9.png|center|]] | ||
| + | |||
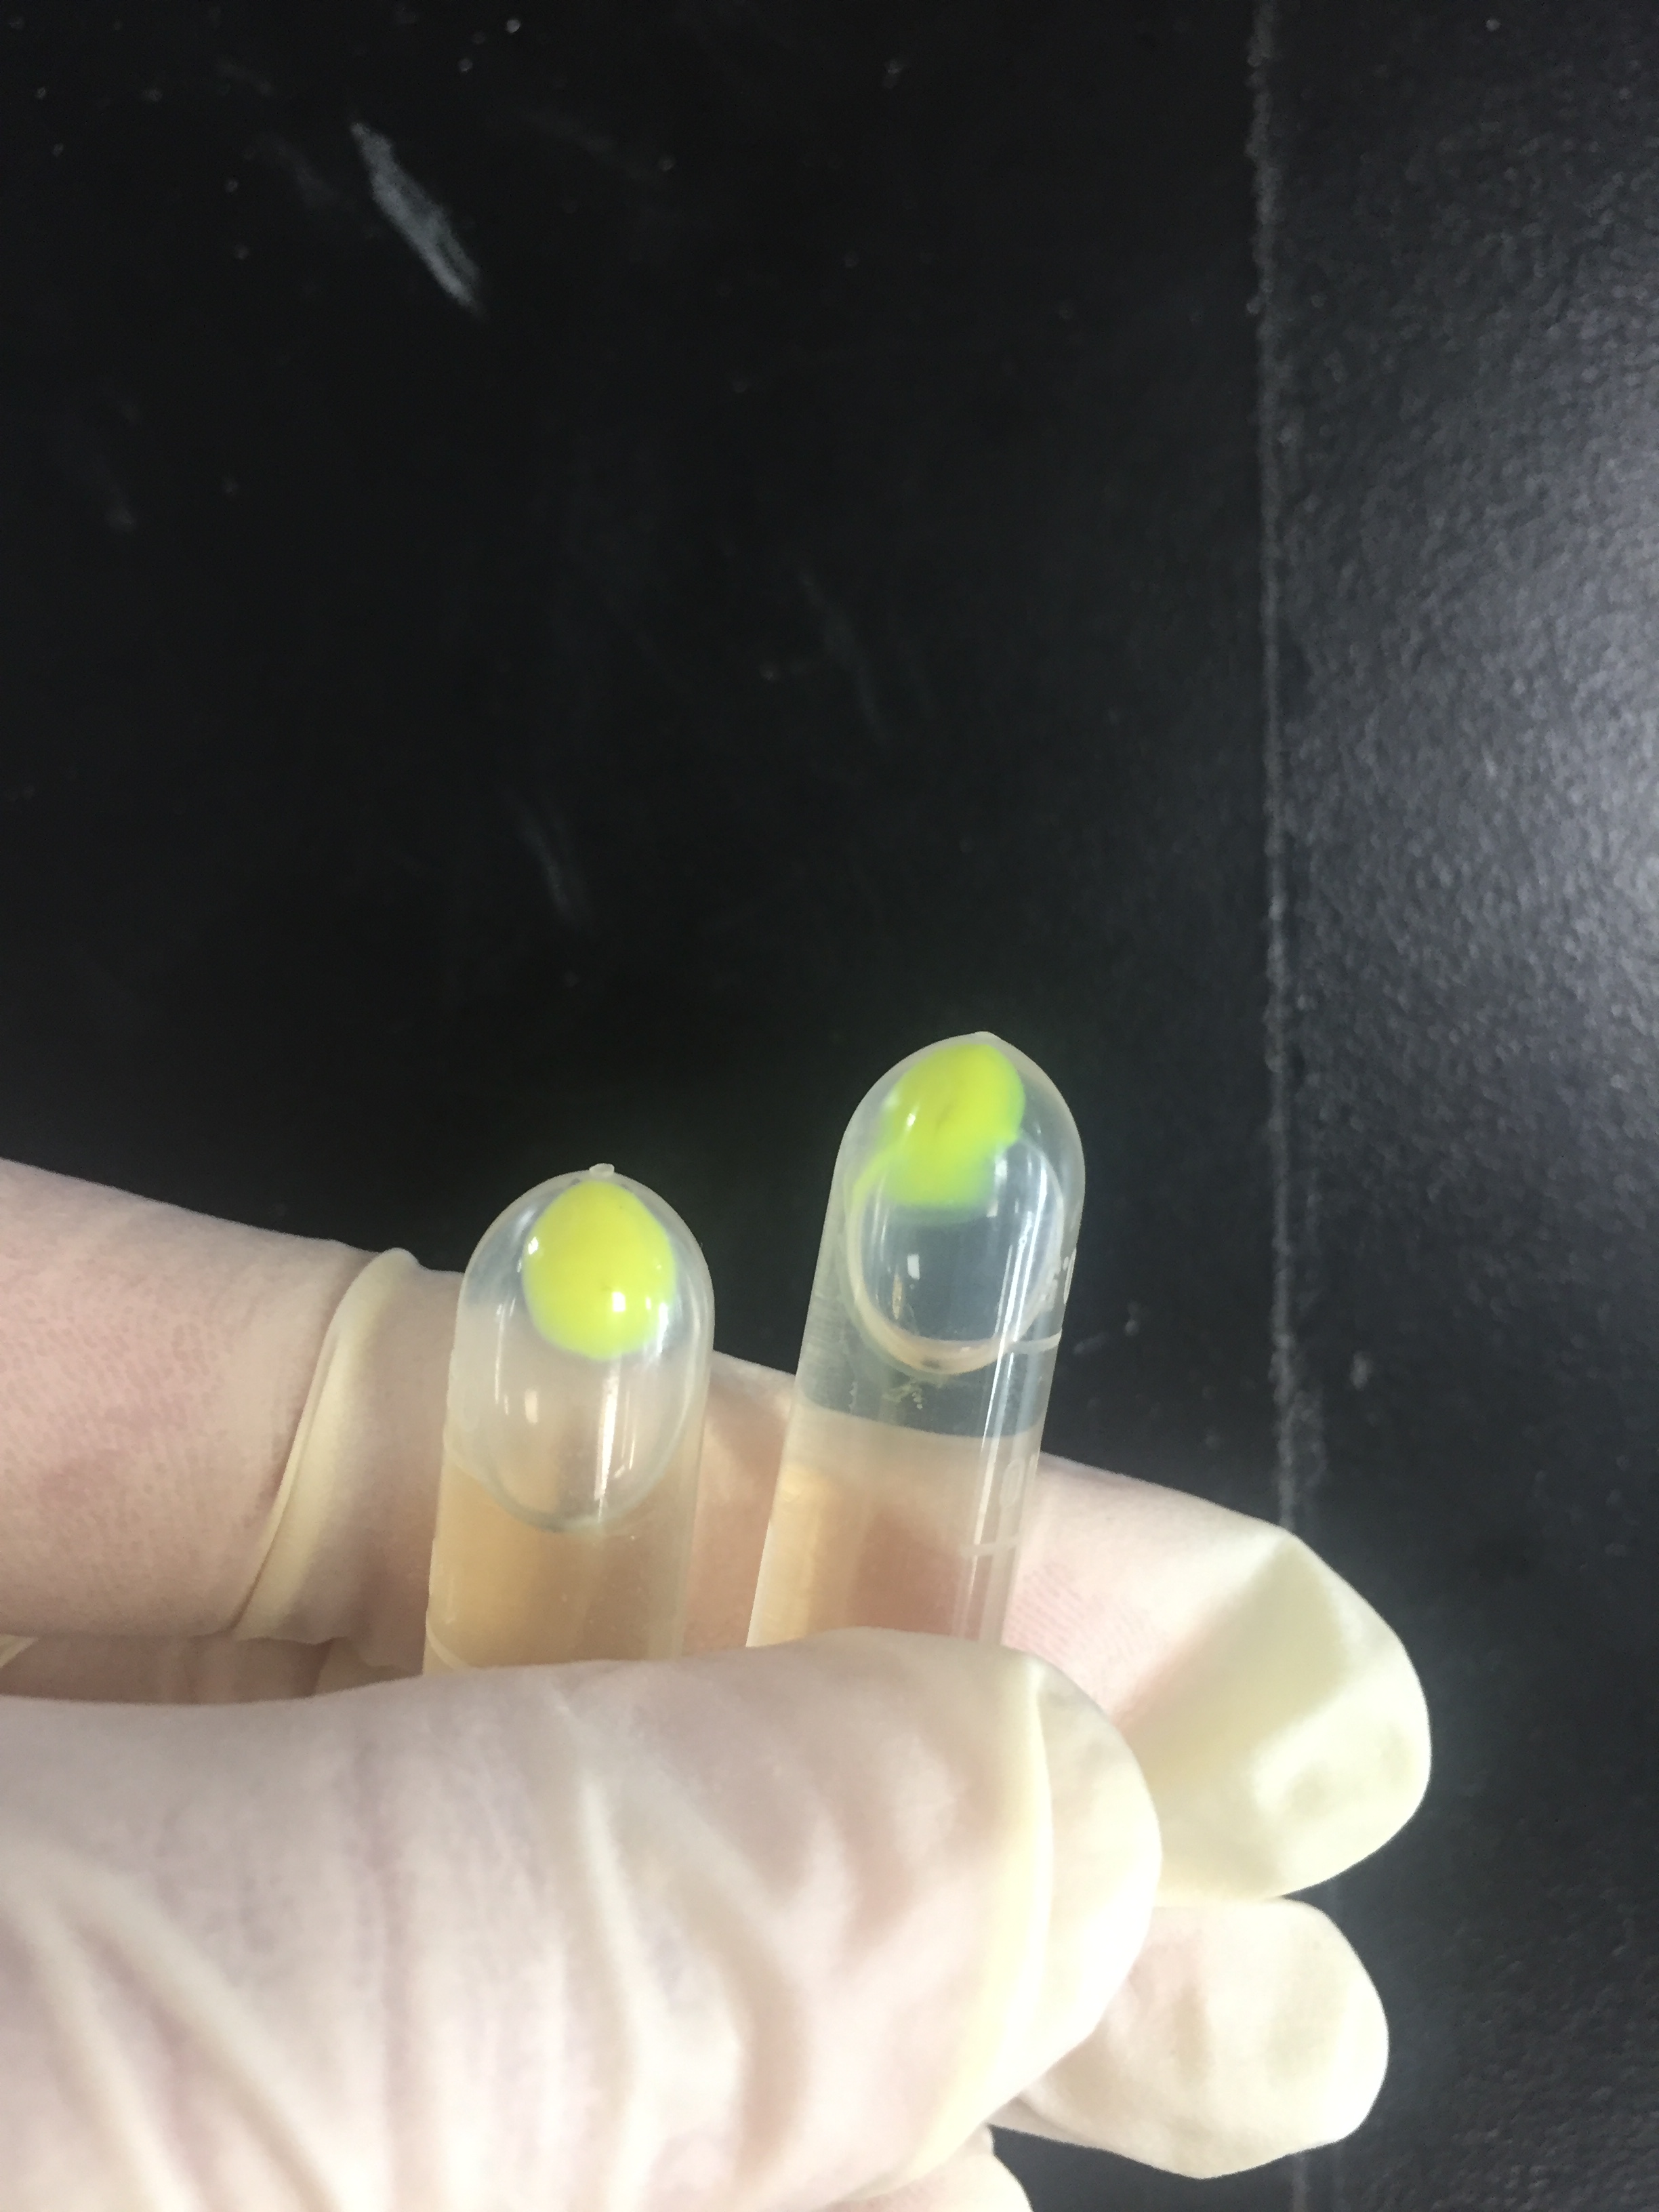
| + | The amilGFP protein was visible in yellow colour less than 24-hour incubation after adding IPTG both on LB plates or in liquid culture.(Figure 2) | ||
| + | |||
| + | [[File:measurement 3.png|center|]] | ||
| + | |||
| + | In order to measure the absorption and emission spectra of amilGFP, we cultured engineered E.coli cells in liquid LB medium, induced the expression of amilGFP with IPTG and incubated at 37℃ overnight. After centrifugation, Cells were treated with 5ml PBS, disrupted through ultrasonication and then centrifuged again, the supernatant was transferred into a new tube and measured with the Microplate Reader in a range between 300-700 nm. The absorption peak is 502 nm and the emission peak was at 512 nm.(Figure 3) | ||
| + | |||
| + | [[File:T--SCU-China--scu-measuremen-fig3.png|center||720px]] | ||
===References=== | ===References=== | ||
[http://www.ncbi.nlm.nih.gov/pubmed/18648549] Alieva, N. O., et al. 2008. ''Diversity and evolution of coral fluorescent proteins.'' PLoS One 3:e2680. | [http://www.ncbi.nlm.nih.gov/pubmed/18648549] Alieva, N. O., et al. 2008. ''Diversity and evolution of coral fluorescent proteins.'' PLoS One 3:e2680. | ||
| + | |||
| + | GenBank: AY646067.1 | ||
| + | |||
| + | ==Shanghai_HS_United 2019's characterization== | ||
| + | ===BBa_K592010 amilGFP, yellow chromoprotein=== | ||
| + | <p>The E. coli expressing blue fluorescent protein(amilGFP) were cultured at 28 °C and the overnight bacterial solution was collected for subsequent measurement.</p> | ||
| + | <p>After ultrasonically disruption of the above bacterial solution ,5 ul of each was added to 4 kinds of 45 ul solution having a pH of 3, 5, 7, and 9, and the fluorescence was measured using varioskan flash of Thermo Scientific. The excitation wavelength/emission wavelength corresponding to each fluorescent protein is: amilGFP: 395/509.</p> | ||
| + | [[Image:K592010-fig1.png|400px|center|Characterization of popular BioBrick RBSs]] | ||
| + | <strong>Fig1. Fluorescence of amilGFP under different pH.</strong><p>There were two kinds of amilGFP expressing in E.coli(amilGFP) and expressing in E.coli after ultrasonically disruption(amilGFP -UC). Under the same pH3 and pH5, the fluorescence of amilGFP was higher than amilGFP-UC. Under the same pH7 and pH9, the fluorescence of amilGFP was lower than amilGFP-UC. With increasing of pH( among pH3, pH5, pH7,), the fluorescence of amilGFP and amilGFP-UC all raised. When the pH increased from pH7 to pH9, the fluorescence of amilGFP and amilGFP-UC were all down.</p> | ||
| + | <p>The results showed that the fluorescent value of each fluorescent protein did not change significantly in acid and alkali circumstance before sonication, but after sonication, each fluorescent protein showed the highest fluorescent value at pH 7, and the fluorescent value decreased as the environment became more acidic.</p> | ||
| + | |||
| + | |||
| + | ==Shanghai-United 2019's characterization== | ||
| + | ===BBa_K592010 amilGFP, yellow chromoprotein=== | ||
| + | |||
| + | <p>The fluorescence intensity of fluorescent protein is related to protein expression. The protein expression level is related to the culture time and culture temperature. In addition, the fluorescence intensity of fluorescent protein is also related to excitation and emission spectra. We designed experiments to explore the effects of the above three factors on the intensity of fluorescent protein.</p> | ||
| + | <p>1. We transformed the plasmid contanining gfp, amilgfp into bacterial competent cells separately separately, plated and cultured overnight at 37 °C. </p> | ||
| + | <p>2. On the evening of the next day, we picked single clone into a tube containing 5 ml LB which is called 0h. At the same time, we also inoculated competent DH5α strain into a tube containing 5 ml LB as a blank control.We culture bacterial cells at 37 ° C, 220 rpm. The sampling time point is 24h.</p> | ||
| + | <p>3. We took 100ul of the bacteria culture and measured the total fluorescence with a Thermo fluorescence microplate reader. We took 200ul of the ten-fold diluted bacterial solution and measured the OD600 with BioTek optical microplate reader. Total fluorescence is divided by OD600 to obtain fluorescence value per OD600 .</p> | ||
| + | [[Image:K592010-S1.png|400px|Characterization of popular BioBrick RBSs]] | ||
| + | |||
| + | <strong>Figure1. GFP containing strain RFU/OD600 at different emission Wavelength.</strong> | ||
| + | <p>The Bba_K608008 strain RFU/OD600 of the strain varies with the emission wavelength. The overall curve showed a normal distribution and the RFU/OD600 of the strain reachs its maximum at 514 nm. The BBa_k1073024 strain RFU/OD600 of the strain varies with the emission wavelength. The overall curve showed a normal distribution and the RFU/OD600 of the strain reachs its maximum at 512 nm. The absorbance value of the blank control DH5α and H2O are close to zero.</p> | ||
| + | |||
| + | ==Hamburg 2020's characterisation== | ||
| + | <p> We investigated the influence of glucose concentration in growth media, on the amilGFP expression in different bacteria strains. <br> | ||
| + | To assess whether glucose is affecting the formation of amilGFP, two parameters were investigated. | ||
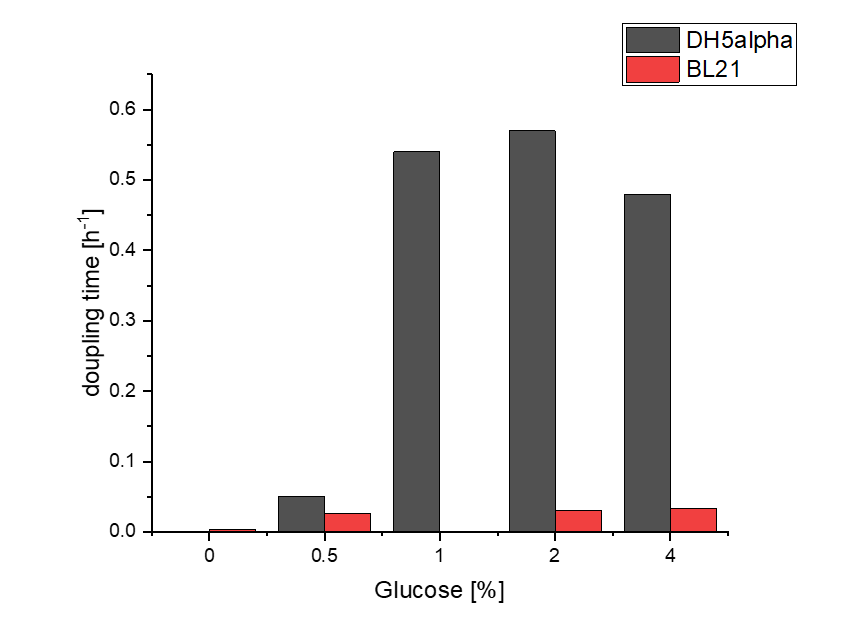
| + | Firstly, a growth experiment with differing glucose levels (0, 0.5, 1, 2 and 4%) was performed in a technical quadruplicate with measurements of the OD600 every 10 minutes over the curse of 20 hours shaking at 216 rpm at 37°C with two different <i>E.coli</i> strains (<i>E. coli DHα, E. coli BL21 DE3</i>).</p> | ||
| + | |||
| + | [[Image:Hamburg_Contribution_amilGFP_bacteria_growth.png||360px]] | ||
| + | <br> | ||
| + | <p>BL21 and DHα showed no noteworthy difference in the doubling time with rising glucose levels and no growth without glucose.</p> | ||
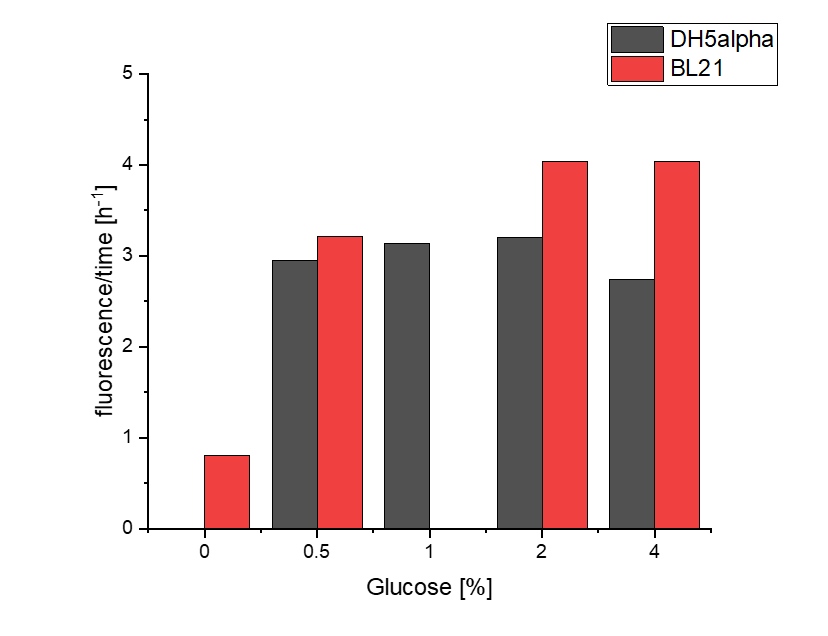
| + | <p>Next, optical measurements for the formation of amilGFP were performed at the same conditions as mentioned above. The excitation wavelength was 485 nm and the emission wavelength was 535 nm. | ||
| + | </p> | ||
| + | [[File:T--Hamburg--Contribution amilGFP fluorescein.png||360px]] | ||
| + | <p>The data of BL21 show that the best concentrations for the rise of fluorescence per hour are 1 and 2 % Glucose concentration. After the exponential growth phase, the rise decreases remarkably. | ||
| + | </p> | ||
| + | <p> The data of DH5α show that the best concentrations for the rise of fluorescence per hour are 2 and 4% Glucose concentration. After the exponential growth phase, the rise decreases remarkably. | ||
| + | </p> | ||
| + | <p> | ||
| + | Although BL21 had a higher OD600 DH5α showed higher fluorescence gain per hour. | ||
| + | </p> | ||
| + | |||
| + | == Characterization by 2021iGEM_Shanghai_United == | ||
| + | |||
| + | === Improvement of an existing part === | ||
| + | |||
| + | [[File:T--Shanghai United--BBa K3991006-figure5.jpg|500px|thumb|center|Fig5. The blast results about the DNA sequence of our new part BBa_K3991006 and the old one BBa_K592010..]] | ||
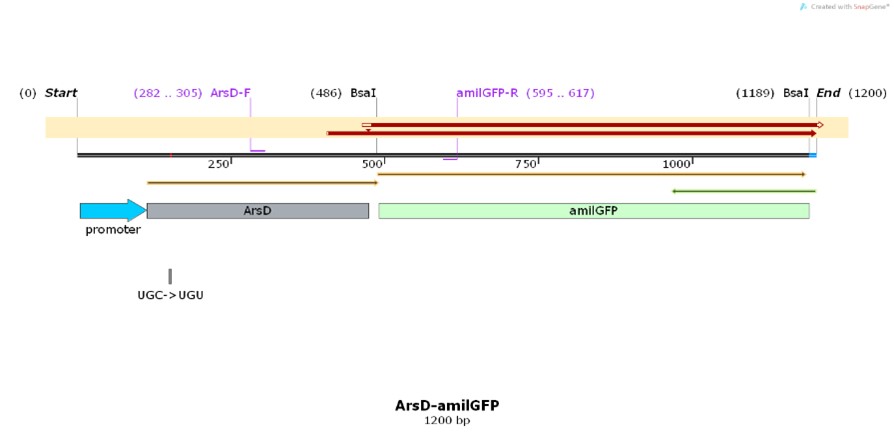
| + | In order to optimize the function of BBa_K592010, we constructed an improved composite part BBa_K3991006, which is involved in the response of E. coli to heavy metal arsenic. | ||
| + | The purpose of our product is to reduce individuals’ exposure to arsenic and prevent the harmful impact it might bring through accurately detecting the arsenic in people’s surroundings. After the successful construction of the engineering bacteria, on the one hand, it can help environmental monitors detect the pollution of heavy metal arsenic in the environment, and on the other hand, it can allow residents to detect whether there is heavy metal arsenic pollution in domestic water by themselves, thereby providing help for people's healthy life. | ||
| + | |||
| + | The improved strain can not only reflect the pollution situation according to the GFP signal, but also can be used for further transformation to reduce the pollution of heavy metal arsenic, such as promoting the enrichment of arsenic and then processing. | ||
| + | |||
| + | == Profile == | ||
| + | == BBa_K3991006 == | ||
| + | ==== Name: pro-ArsD-amilGFP ==== | ||
| + | ==== Base Pairs: 1200 bp ==== | ||
| + | ==== Origin: Escherichia coli (strain: LST424C, nat-host: Homo sapiens) ==== | ||
| + | ==== Properties: Gene technology for protecting patented bacterial strains ==== | ||
| + | |||
| + | == Usage and Biology == | ||
| + | According to the WHO, arsenic levels above 10 parts per billion in water are harmful to humans. Levels in Bangladesh, however, are five times as much. The Bangladesh arsenic contamination is pending a solution. "I have no alternative." Uddin, a villager in Bangladesh, helplessly expresses his views towards drinking arsenic-contaminated well water. | ||
| + | |||
| + | What comes to your mind first when talking about arsenic? Arsenic is a naturally occurring element that is widely distributed in the earth's crust. It is found in water, air, food, and soil. In recent years, reports of arsenic poisoning have been increasing year by year. | ||
| + | |||
| + | Arsenic seeps into groundwater through rocks and soil, resulting in drinking water from surface sources (such as wells) that often contain higher levels of arsenic than water from, for example, lakes or reservoirs. In addition to groundwater, arsenic levels of 1.7 μg/L have been detected in the ocean, far exceeding the international regulation of 0.0175 μg/L (Neff, 2009). Irrigation with arsenic-contaminated water sources makes arsenic hazardous to human health from the food side. In addition, arsenic can also enter the human body from external sources, such as paints, textiles, and metal adhesives, through direct ingestion, gaseous inhalation, or skin absorptio. Or it can be absorbed by humans as a component of tobacco (WHO, 2018). Long-term exposure to high levels of arsenic can be harmful to humans, especially to developing infants and children. Although arsenic is not well understood, once it enters the body, the skin and various systems such as the nervous, respiratory, cardiopulmonary, immune, and endocrine systems are affected. In addition, the liver, kidneys, bladder, and prostate, which are responsible for detoxification, are damaged and cannot function effectively (National Institute of Environment Health Science, 2021). | ||
| + | |||
| + | For example, in a village in Hunan, China, 1200 in total 3000 residents have been tested for arsenic poisoning, which was mainly caused by the mining of realgar ore. According to the local hospital, 400 of 600 miners who have been tested for arsenic poisoning died from cancer. For instance, a family of 7 people all died from cancer, and 5 of the cases were determined that they were caused by arsenic poisoning (Chinese Center for Disease Control and Prevention, 2014). | ||
| + | |||
| + | Not only for humans but excessive levels of arsenic can also affect plants and animals in the natural environment. For example, aquatic plants (e.g. algae), zooplankton, and amphibians, or aquatic animals (e.g. snails, fish, crustacean larvae, marine mammals) are all exposed to inorganic arsenic toxicity (Neff, 2009). | ||
| + | |||
| + | Arsenic is a microelement that is omnipresent in the environment. However, it is this common microelement that could be harmful to human body. If we take in more than 50 µg/L of arsenic, the function of our body will be disrupted. Also, the level of arsenic throughout the world is gradually increasing every year, and has already exceeded the level that human body can metabolize. | ||
| + | |||
| + | Areas close to factories whose product involves arsenic usually have a high arsenic concentration. Thus, we need arsenic detectors to ensure the security of people who work in these factories. According to the questionnaires and street research we did, although the general public did not know much about arsenic, most people believed that having an inexpensive and accurate sensor to detect arsenic is necessary. In addition, environmental and market scientists also considered that the current testing methods in the market are too cumbersome, so equipment that can detect arsenic levels easily and efficiently is required. | ||
| + | |||
| + | == Construct design == | ||
| + | [[File:T--Shanghai United--BBa K3991006-figure1.jpg|500px|thumb|center|Figure 1. Plasmid diagram..]] | ||
| + | |||
| + | == BBa_K3991000 == | ||
| + | ==== Name: ArsD ==== | ||
| + | ==== Base Pairs: 1200 bp ==== | ||
| + | ==== Origin: Escherichia coli (strain: LST424C, nat-host: Homo sapiens) ==== | ||
| + | ==== Properties: Gene technology for protecting patented bacterial strains ==== | ||
| + | ArsD is a trans-acting repressor of the arsRDABC operon that confers resistance to arsenicals and antimonials in Escherichia coli. | ||
| + | |||
| + | == BBa_K592010 == | ||
| + | ==== Name: amilGFP ==== | ||
| + | ==== Base Pairs: 699bp ==== | ||
| + | ==== Origin: Acropora millepora ==== | ||
| + | ==== Properties: A yellow chromoprotein ==== | ||
| + | |||
| + | ==== Usage and Biology ==== | ||
| + | This part is useful as a reporter and it naturally exhibits strong yellow color when expressed. | ||
| + | |||
| + | In the process of cultivating microorganisms, namely Escherichia coli, because of their small size, they cannot be directly observed with the naked eye, and a certain method is needed for monitoring. In cell biology and molecular biology, the green fluorescent protein (GFP) gene is often used as a reporter gene. Through genetic engineering technology, the green fluorescent protein (GFP) gene can be transferred into the genomes of different species and continue to be expressed in offspring. . Therefore, we constructed the amilGFP engineered bacteria to show the growth status (number and vitality) of E. coli by observing the strength of the green fluorescent protein signal. | ||
| + | |||
| + | == Experimental approach == | ||
| + | === Production, purification, and sequcing analysis of recombinant ArsD-amilGFP === | ||
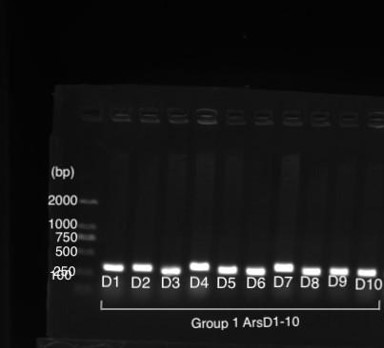
| + | [[File:T--Shanghai United--BBa K3991006-figure2.jpg|500px|thumb|center|Figure 2: Gel Electrophoresis Results of PCR of amilGFP Genes..]] | ||
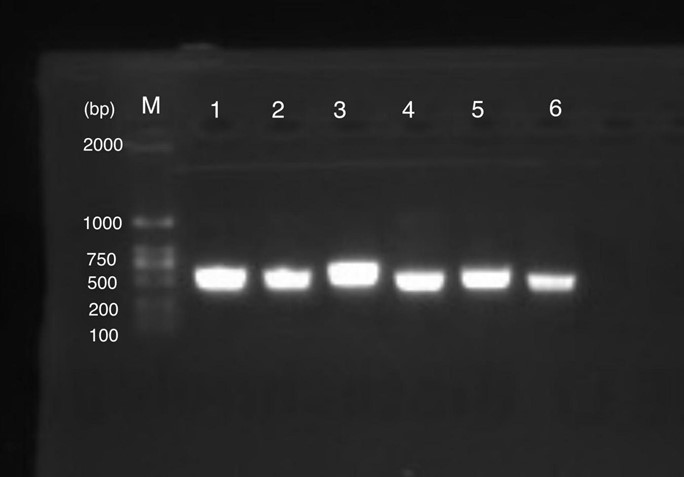
| + | Figure 1 shows gel electrophoresis results of amilGFP PCR. Column M is a 2K marker ladder. Columns 1-6 are PCR products of amilGFP genes. | ||
| + | |||
| + | All 1-6 columns displayed successful results at 700bp which could be used for later experiments. | ||
| + | |||
| + | [[File:T--Shanghai United--BBa K3991006-figure3.jpg|500px|thumb|center|Figure 3: Gel Electrophoresis Results of PCR of ArsD Gene..]] | ||
| + | Figures 3 show the result for colony PCR identification on the E.coli with ARSD/amilGFP inserted that were cultivated previously. The purpose is to examine whether the E.coli contains expected gene segment of ARSD. | ||
| + | |||
| + | |||
| + | == Function Tests == | ||
| + | === Function Test With NaH2PO4, Attempt 1 === | ||
| + | Such function tests were performed under the hypothesis that NaH2PO4 is structurally similar to arsenic compounds that were meant to be detected. NaH2PO4 is used to substitute for arsenic compounds due to experimental safety. No fluorescence was detected in all samples, indicating that the concentrations of NaH2PO4 may be too low or that genetically engineered E. coli will not react to NaH2PO4. | ||
| + | |||
| + | === Function Test With NaH2PO4, Attempt 2 === | ||
| + | In order to verify our assumption in attempt 1, NaH2PO4 was used again in this testing, with greater concentration than the last test. No fluorescence was detected in all samples, indicating the inability of the genetically engineered E. coli to react with NaH2PO4. | ||
| + | |||
| + | Function Test With C2H6AsNaO2 | ||
| + | |||
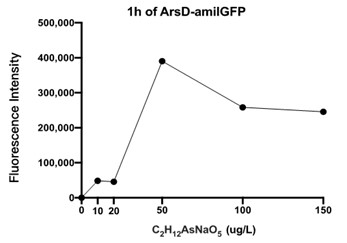
| + | [[File:T--Shanghai United--BBa K3991006-figure4.jpg|500px|thumb|center|Figure 4: Fluorescence Intensity of Transformed E. coli In Different Concentrations of C2H12AsNaO5 Solutions..]] | ||
| + | |||
| + | Given that NaH2PO4 cannot be used to stimulate the expression of amilGFP in genetically engineered E. coli, C2H6AsNaO5 was used for this function test. Extremely minor fluorescence was detected by a microplate reader after 19 hours of reaction time. This result confirms the design of E. coli to be correct and functional. | ||
| + | |||
| + | Figure 4 displays the fluorescence intensity generated by an ARSD/amilGFP transformed E. coli reacting for 1 hour in C2H6AsNaO5 solutions. As seen in the figure, fluorescence was detected for all C2H6AsNaO5 concentrations that are above 0, which confirms that the designed plasmid worked as intended. However the fluorescence was rather minor, so we speculate that E. coli responds poorly to organic arsenic compounds. Further experiments would be conducted to test for fluorescence intensities of E. coli in inorganic arsenic solutions. | ||
| + | |||
| + | |||
| + | |||
| + | |||
| + | == Future plan == | ||
| + | Our main target customer are companies, factories, and government departments that being involved with arsenic detection. The main reason is that this detecting equipment can detect arsenic in a more efficient, convenient, and most importantly, more economical way. It is true to say that, the only conceivable drawback might be the accuracy of the result. However, the result is comparatively accurate enough to support our target clients to make basic decisions. Besides, we also take into account that some families with high pursuit of life quality, who worry about arsenic’s harmfulness and might become our potential customers, because these groups are usually educated to know the necessity of protecting their health, while purchasing specialized equipment is also affordable for them. | ||
| + | |||
| + | |||
| + | == References == | ||
| + | ==== (1)Neff, J.M. (1997). ECOTOXICOLOGY OF ARSENIC IN THE MARINE ENVIRONMENT—Review. Environmental Toxicology and Chemistry, 16(5), p.917.==== | ||
| + | ==== (2)Chinese Center For Disease Control and Prevention (2014). 中国疾病预防控制中心. [online] www.chinacdc.cn. ==== | ||
| + | ==== (3)Ahmad, S. A., Khan, M. H., & Haque, M. (2018, November 30). Arsenic contamination in groundwater in Bangladesh: Implications and challenges for healthcare policy. Risk management and healthcare policy. https://www.ncbi.nlm.nih.gov/pmc/articles/PMC6281155/. ==== | ||
| + | ==== (4)Argos, M. (2012, December 1). Arsenic and human health: epidemiologic progress and public health implications. De Gruyter. https://www.degruyter.com/document/doi/10.1515/reveh-2012-0021/html ==== | ||
| + | ==== (5)Arsenic. (2021, May 3). National Institute of Environmental Health Sciences. https://www.niehs.nih.gov/health/topics/agents/arsenic/index.cfm ==== | ||
| + | ==== (6)Institute, E. (2020, May 6). Clay layers and Distant PUMPING Trigger arsenic contamination in Bangladesh Groundwater. State of the Planet. https://news.climate.columbia.edu/2020/05/07/clay-arsenic-bangladesh-groundwater/. ==== | ||
| + | ==== (7)International Agency for Research on Cancer. (2012). Review of Human Carcinogens: C. Metals, Arsenic, Dusts and Fibres (IARC Monographs on the Evaluation of the Carcinogenic Risks to Humans, 100) (Vol. 100C). World Health Organization. https://publications.iarc.fr/120 ==== | ||
| + | ==== (8)Matta, G. (2016, June). 2015 - 2016_Mercury, lead and arsenic impact on environment and human health.pdf. Academia.Edu. https://www.academia.edu/38166988/2015_2016_Mercury_lead_and_arsenic_impact_on_environment_and_human_health_pdf ==== | ||
| + | ==== (9)Saha, J. C., Dikshit, A. K., Bandyopadhyay, M. A., & Saha, K. C. (1999, July 1). A Review of Arsenic Poisoning and its Effects on Human Health. ResearchGate. https://www.researchgate.net/publication/248944528_A_Review_of_Arsenic_Poisoning_and_its_Effects_on_Human_Health ==== | ||
| + | ==== (10)SUI Jiachen, YU Hansong, DAI jiayu, et al. Advances in the application of biosensor technology for the detection of heavy metal arsenic in foods[J]. Food Science, 2016, 37(7): 233-238. DOI:10.7506/spkx1002-6630-201607042. http://www.spkx.net.cn ==== | ||
| + | ==== (11)Shaji, E., Santosh, M., Sarath, K., Prakash, P., Deepchand, V., & Divya, B. (2021). Arsenic contamination of groundwater: A global synopsis with focus on the Indian Peninsula. Geoscience Frontiers, 12(3). https://doi.org/10.1016/j.gsf.2020.08.015 ==== | ||
| + | ==== (12)The American Cancer Society medical and editorial content team. (2020, August 5). Arsenic and Cancer Risk. American Cancer Society. https://www.cancer.org/cancer/cancer-causes/arsenic.html ==== | ||
| + | ==== (13)Undark Magazine. (2019, December 20). The Poisoning of Bangladesh: How Arsenic Is Ravaging a Nation. https://undark.org/2017/08/16/bangladesh-arsenic-poisoning-drinking-water/ ==== | ||
| + | ==== (14)Yogarajah, N., & Tsai, S. S. H. (2015, May 1). Detection of trace arsenic in drinking water: challenges and opportunities for microfluidics - Environmental Science: Water Research & Technology (RSC Publishing) DOI:10.1039/C5EW00099H. Royal Society of Chemistry. https://pubs.rsc.org/en/content/articlehtml/2015/ew/c5ew00099h ==== | ||
| + | ==== (15)Arsenic W.H.O. World Health Organization. February. 2018. [Accessed August 3, 2018]. Available from: http://www.who.int/news-room/fact-sheets/detail/arsenic. ==== | ||
| + | |||
| + | |||
| + | |||
| + | |||
| + | == Characterization by 2021iGEM_The_Webb_Schools == | ||
| + | |||
| + | === Improvement of an Existing Part === | ||
| + | |||
| + | Compared to the old part BBa_K592010, expressing GFP, we design a new part BBa_K3983003, which is expressing Peroxidase (efeB). | ||
| + | The BBa_K592010 part is useful as a reporter. Peking iGEM 2016 has fused this part with triple spytag. The fused protein is participate in Peking’s polymer network. By adding this protein, the whole polymer network become visible in most conditions. | ||
| + | The difference is that our goal is to build an engineered bacterium that can produce peroxidase efeB, which can reduce excessive reactive oxygen species produced in patients with depression by producing peroxidase, thereby reducing the possibility of depression. We chose efeB, which sequence is different from BBa_K592010 (Fig8), to construct our desired engineering strain. | ||
| + | |||
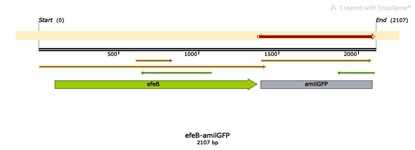
| + | [[File:T--The Webb Schools--BBa K3983003-figure8.jpg|500px|thumb|center|Fig8. The blast results about the DNA sequence of our new part BBa_K3983003 and the old one BBa_K592010...]] | ||
| + | |||
| + | First of all, we constructed a composite part BBa_K592010, and transformed it into E.coli DH5a. We successfully expressed and purified GFP protein , and detected the enzyme activity. | ||
| + | Furthermore, in order to optimize the function of BBa_K592010,we constructed an improved composite part BBa_K3983003, which can participate in the redox process in the organism, reduce the occurrence of oxidation process, thereby reducing the active oxygen in the body of patients with depression to a certain extent. | ||
| + | |||
| + | In addition, we select a kind of probiotics E.coli DR5α as the host. Therefore, our engineering strain was a strong potential drug that can be eaten by patients for ROS and reduce the incidence of depression in patients. | ||
| + | |||
| + | |||
| + | === Profile === | ||
| + | ==== Name: efeB-amilGFP ==== | ||
| + | ==== Base Pairs: 3953 bp ==== | ||
| + | ==== Origin: Escherichia coli str. K-12 substr. MG1655 ==== | ||
| + | ==== Properties: an antioxidant enzyme system ==== | ||
| + | |||
| + | === Usage and Biology === | ||
| + | In modern society, more and more people suffer from mild or severe depression. It has been reported that malondialdehyde (MDA) level in the plasma of depressed patients is significantly increased. After receiving conventional antidepressant treatment, the patient's MDA level decreased to the same as that of healthy people. Therefore, researchers believe that oxidative stress may play an important role in the occurrence and development of depression, and the activity of antidepressant therapy may be mediated by improving oxidative stress/antioxidant function. We attempt to express an antioxidant enzyme system (peroxidase gene efeB) in the cell or on the surface of the engineered probiotic bacteria to inhibit the production of malondialdehyde (MDA) by human cells and prevent cell oxidation from causing health damage to the body. So as to prevent or alleviate the condition of depression. | ||
| + | The oxidation rate of peroxisome increases in proportion to the increase of oxygen tension. Especially in the case of high oxygen concentrations, the oxidation reaction of peroxisomes dominates. This characteristic allows peroxisomes to protect cells from the toxic effects of high concentrations of oxygen. efeB reduces the oxidative stress in the cell by competing with mitochondria for oxygen, and reduces the MDA produced during the oxidation of lipids. | ||
| + | |||
| + | |||
| + | [[File:T--The Webb Schools--BBa K3983002-figure1.jpg|500px|thumb|center|Figure 1. Action and function of efeB in MDA reduction...]] | ||
| + | |||
| + | === Construct design === | ||
| + | |||
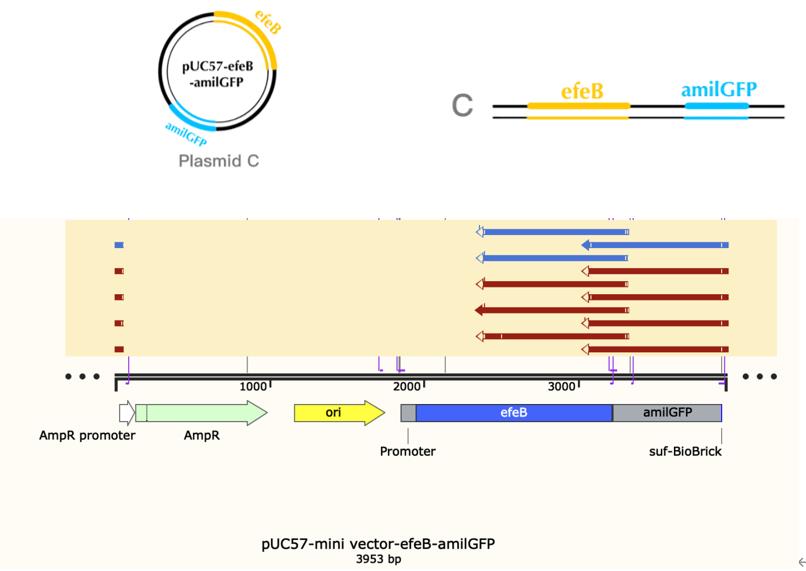
| + | [[File:T--The Webb Schools--BBa K3983003-figure2.jpg|500px|thumb|center|Figure 2. Plasmid diagram...]] | ||
| + | |||
| + | Peroxidase EfeB, originally studied as a substrate of the E. coli "double arginine" translocation system, is the first recognized peroxidase for bacterial dye decolorization. Subsequent studies have shown that EfeB is a peroxidase with heme as a prosthetic group, and has a specific iron transport function.We use E. coli as the starting strain and construct an engineered strain of efeB to explore the effects of efeB on bacterial growth, malondialdehyde concentration, ROS synthesis and antioxidant pathways under different oxidative stress conditions. | ||
| + | |||
| + | In the process of cultivating microorganisms, namely Escherichia coli, because of their small size, they cannot be directly observed with the naked eye, and a certain method is needed for monitoring. In cell biology and molecular biology, the green fluorescent protein (GFP) gene is often used as a reporter gene. Through genetic engineering technology, the green fluorescent protein (GFP) gene can be transferred into the genomes of different species and continue to be expressed in offspring. . Therefore, we constructed the amilGFP engineered bacteria to show the growth status (number and vitality) of E. coli by observing the strength of the green fluorescent protein signal. | ||
| + | |||
| + | The T7 promoter is often used for protein overexpression. It is powerful and specific. It is completely controlled by T7 RNAP. When T7 RNAP is present in the cell, the T7 expression system occupies an absolute advantage compared to the host expression system. Its expression The speed is 5 times that of the former. | ||
| + | |||
| + | === BBa_K592010 === | ||
| + | ==== Name: amilGFP ==== | ||
| + | ==== Base Pairs: 699bp ==== | ||
| + | ==== Origin: Acropora millepora ==== | ||
| + | ==== Properties: A yellow chromoprotein ==== | ||
| + | |||
| + | === Usage and Biology === | ||
| + | This part is useful as a reporter and it naturally exhibits strong yellow color when expressed. | ||
| + | |||
| + | === BBa_K3983002 === | ||
| + | ==== Name: pro-efeB ==== | ||
| + | ==== Base Pairs: 2107 bp ==== | ||
| + | ==== Origin: Escherichia coli str. K-12 substr. MG1655 ==== | ||
| + | ==== Properties: an antioxidant enzyme system ==== | ||
| + | |||
| + | === Experimental approach === | ||
| + | ==== Production, purification, and sequcing analysis of recombinant efeB-amilGFP ==== | ||
| + | |||
| + | [[File:T--The Webb Schools--BBa K3983003-figure3.jpg|500px|thumb|center|Figure 3. Gel electrophoresis of plasmids...]] | ||
| + | |||
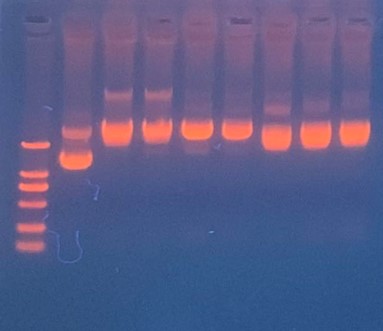
| + | This step is used to test if the plasmids efeB-amilGFP extracted from the E. coli DH5α are successful and could be used to do double enzyme digestion later in the process. Channel2-8: efeB-amilGFP succeeded | ||
| + | |||
| + | == Proof of function == | ||
| + | |||
| + | |||
| + | === The growth of engineering bacteria under H2O2 treatment conditions === | ||
| + | [[File:T--The Webb Schools--BBa K3983003-figure4.jpg|500px|thumb|center|Figure 4. Line chart of the OD600 of bacteria A, C and D against hours in 2.5mM H2O2...]] | ||
| + | |||
| + | The bacteria A contains plasmid A, pUC57-efeB. The bacteria C contains plasmid C, pUC57-efeB-amilGFP. The bacteria D contains plasmid D, pUC57. The bacteria are placed in 2.5mM hydrogen peroxide and their growth is measured for the first 4 hours. Bacteria D, without the efeB gene, has lower growth than bacteria A and bacteria C. This shows that efeB gene helps bacteria to grow when ROS is present. | ||
| + | |||
| + | === MDA and Fluorescence Measuring === | ||
| + | |||
| + | [[File:T--The Webb Schools--BBa K3983003-figure5.jpg|500px|thumb|center|Figure 5. Histogram of MDA in the systems with different H2O2 concentration of bacteria A, C and D...]] | ||
| + | |||
| + | Bacteria A, C, D were placed in hydrogen peroxide solution for 21 hours and the concentration of MDA was measured. Bacteria A and C kept the MDA concentration dramatically lower than those of Bacteria D under the hydrogen peroxide concentration of 0mM, 2mM and 2.5mM. There is a certain amount of MDA concentration within DH5α when the H2O2 concentration is 0mM. Starting from the original DH5α MDA concentration to the higher MDA concentration imposed by the 2mM and 2.5mM H2O2 concentration, Bacteria A and C with the efeB gene all effectively reduced the MDA concentration to the level lower than Bacteria D. | ||
| + | |||
| + | [[File:T--The Webb Schools--BBa K3983003-figure6.jpg|500px|thumb|center|Figure 6. Histogram of fluorescence intensity of bacteria C system with different H2O2 concentration ...]] | ||
| + | |||
| + | In bacteria C, the expression of GFP is controlled by the expression of efeB. The more intense the fluorescence is, the better efeB will express. H2O2 climbed from 0 to 2.5 mM, and the intensity of fluorescence climbed higher as well. The tendency of the intensity shows that the expression of efeB increases with the H2O2 concentration. Expression of efeB disturbs the production of MDA. | ||
| + | |||
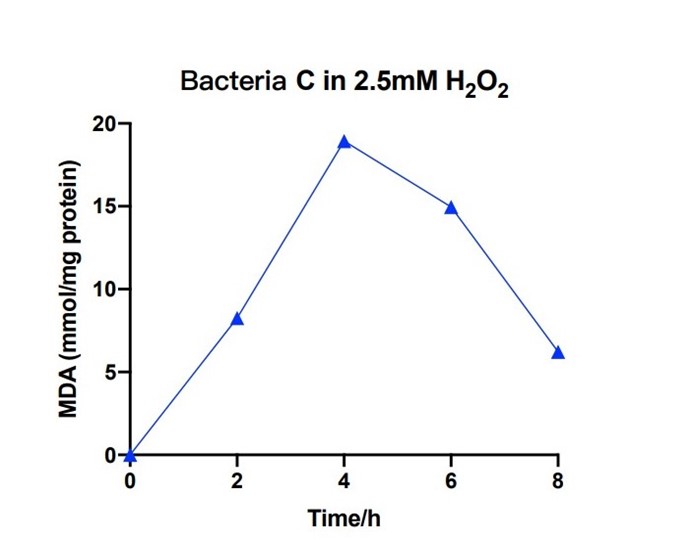
| + | [[File:T--The Webb Schools--BBa K3983003-figure7.jpg|500px|thumb|center|Figure 7. Line chart of MDA in bacteria C system with 2.5mM H2O2 against hours ...]] | ||
| + | |||
| + | Bacteria C was placed in the 2.5nM hydrogen peroxide solution, and the level of MDA was measured under different hours. During the first 4 hours, the concentration of MDA increased up to 20 mmol/mg. The concentration of MDA decreased to 6 mmol/mg for the next four hours. The measured levels of MDA demonstrate that the efeB gene can curb the increase of MDA and keep it in a relative low level. | ||
| + | |||
| + | In order to deeper analyze the factors which may affect the ability of bacteria C and bacteria A to inhibit MDA production, more function tests would be designed and conducted in future. | ||
| + | |||
| + | |||
| + | |||
| + | === Reference === | ||
| + | ==== [1] McCarter T. (2008). Depression overview. American health & drug benefits, 1(3), 44–51. ==== | ||
| + | |||
| + | ==== [2] Chand SP, Arif H. Depression. [Updated 2020 Nov 18]. In: StatPearls [Internet]. Treasure Island (FL): StatPearls Publishing; 2021 Jan-. Available from: https://www.ncbi.nlm.nih.gov/books/NBK430847/ ==== | ||
| + | |||
| + | ==== [3] Wang, J., Wu, X., Lai, W., Long, E., Zhang, X., Li, W., Zhu, Y., Chen, C., Zhong, X., Liu, Z., Wang, D., & Lin, H. (2017). Prevalence of depression and depressive symptoms among outpatients: a systematic review and meta-analysis. BMJ open, 7(8), e017173. https://doi.org/10.1136/bmjopen-2017-017173 ==== | ||
| + | ==== [4] Bueno-Notivol, J., Gracia-García, P., Olaya, B., Lasheras, I., López-Antón, R., & Santabárbara, J. (2021, January 1). Prevalence of depression during the COVID-19 outbreak: A meta-analysis of community-based studies. International Journal of Clinical and Health Psychology. DOI: 10.1016/j.ijchp.2020.07.007. ==== | ||
| + | ==== [5] U.S. Department of Health and Human Services (HHS). (n.d.). Major Depression. National Institute of Mental Health. https://www.nimh.nih.gov/health/statistics/major-depression#part_155720. ==== | ||
| + | ==== [6] Ferguson, J. M. (2001, February). SSRI Antidepressant Medications: Adverse Effects and Tolerability. Primary care companion to the Journal of clinical psychiatry. Doi: 10.4088/pcc.v03n0105 ==== | ||
| + | ==== [7] Jiménez-Fernández, S., Gurpegui, M., Dí¬az-Atienza, F., Pérez-Costillas, L., Gerstenberg, M., & Correll, C. U. (2021, March 1). Comparison of ODD vs Healthy Controls. Psychiatrist.com. dx.dot.org/10.4088/JPC.14r09179. ==== | ||
| + | ==== [8] Rowe, L. A., Degtyareva, N., & Doetsch, P. W. (2008). DNA damage-induced reactive oxygen species (ROS) stress response in Saccharomyces cerevisiae. Free radical biology & medicine, 45(8), 1167–1177. https://doi.org/10.1016/j.freeradbiomed.2008.07.018 ==== | ||
| + | ==== [9] Jiménez-Fernández, S., Gurpegui, M., Díaz-Atienza, F., Pérez-Costillas, L., Gerstenberg, M., & Correll, C. U. (2015). Oxidative stress and antioxidant parameters in patients with major depressive disorder compared to healthy controls before and after antidepressant treatment: results from a meta-analysis. The Journal of clinical psychiatry, 76(12), 1658–1667. https://doi.org/10.4088/JCP.14r09179 ==== | ||
| + | ==== [10] Li, J., Yang, Z., Qiu, H., Wang, Y., Jian, L., Ji, J., & Li, K. (2020). Anxiety and depression among general population in China at the peak of the COVID-19 epidemic. World psychiatry : official journal of the World Psychiatric Association (WPA), 19(2), 249–250. https://doi.org/10.1002/wps.20758 ==== | ||
| + | |||
| + | ==== [11] Vaváková, M., Ďuračková, Z., & Trebatická, J. (2015, May 20). Markers of Oxidative Stress and Neuroprogression in Depression Disorder. Oxidative Medicine and Cellular Longevity. https://doi.org/10.1155/2015/898393 ==== | ||
| + | ==== [12] Wang Y;Li H;Li T;He H;Du X;Zhang X;Kong J; (n.d.). Cytoprotective effect of Streptococcus thermophilus against oxidative stress mediated by a novel peroxidase (EfeB). Journal of dairy science. DOI: 10.3168/jds.2018-14601 ==== | ||
Latest revision as of 17:06, 21 October 2021
amilGFP, yellow chromoprotein
This chromoprotein from the coral Acropora millepora, amilGFP, naturally exhibits strong yellow color when expressed. The color is readily visible to naked eye both in LB-culture and on agar plates. Color development can be seen in less than 24 hours of incubation.
Important: This part is not available in the registry yet, however, the same part is available from the registry with the standard RBS B0034: BBa_K1033931.
Usage and Biology
This part is useful as a reporter.
Peking iGEM 2016 has fused this part with triple spytag. The fused protein is participate in Peking’s polymer network. By adding this protein, the whole polymer network become visible in most conditions. If you want to learn more about Peking’s polymer network and the role of mRFP in this network, please click here https://parts.igem.org/Part:BBa_K1989003", https://parts.igem.org/Part:BBa_K1989045" or https://parts.igem.org/Part:BBa_K1989048".
iGEM11_Uppsala-Sweden: Expression of chromoproteins. The images above show E coli constitutively expressing amilGFP BBa_K592010 (yellow), amilCP BBa_K592009 (blue), and RFP BBa_E1010 (red).
iGEM12_Uppsala_University: The Uppsala chromoprotein collection and RFP. The image shows pellets of E coli expressing chromoproteins eforRed BBa_K592012, RFP BBa_E1010, cjBlue BBa_K592011, aeBlue BBa_K864401, amilGFP BBa_K592010 and amilCP BBa_K592009.
iGEM17_SJTU_BioX_Shanghai:
J23119+Target3+amilGFP BBa_K2285013
J23119+Target1+amilGFP BBa_K2285017
An improved part has been constructed. Since this part is a coding sequence, we added a RBS which is on the upstream of sfGFP BBa_K515005 and terminator BBa_B1006 by PCR. What's more, our device have a stem-loop structure(called Target) following the constitutive promoter J23119, to achieve further control of amilGFP expression.
iGEM18_Bulgaria:
This part was characterized by the iGEM Bulgaria 2018 team. We cloned this chromoprotein CDS into a high copy number vector pSB1C3 that contains part BBa_K608002 (strong promoter and strong RBS). Additionally similar constructs with amilCP, cjBlue, gfasPurple, eforRed and spisPink were prepared. We tested all these constructs for colour stability upon re-cultivation. Under these conditions, most of the proteins showed as a severe metabolic burden to the host cells, leading to small sizes of the colonies and color loss upon re-cultivation. The exception was the amilGFP protein - it was stable enough to be used under the control of a strong promoter and on a high copy number vector. We also measured its growth kinetics in comparison with the standard pSB1C3 vector (with a red colour device) and a pSB1C3 vector with an AmilGFP CDS (without promoter and RBS, used as a control). The obtained data were normalized to AmilGFP-CDS vector (value of 1.00). The growth rate of pSB1C3-Amil GFP is 0.52 and the pSB1C3-mRFP red colour device (not with a strong promoter) has a value of 0,85. Despite these results we found that the AmilGFP was the only chromoprotein from the group tested that was always stable upon re-cultivation.
Next we tested the AmilGFP expression from our construct in LB media with increased levels of NaCl. The results can be seen on the following figure:
iGEM19_SCU-China:
This part was characterized in the measurement of amilGFP's absorption and emission spectra by the iGEM2019 SCU-China team. To express this chromoprotein, we cloned this part downstream T7 promoter on pET21α vector and transformed this T7-amilGFP-pET21α into E.coli BL21 cells.We verified our construction by restriction digestion (generating a fragment of 705 bp and a fragment of 5424 bp) and sequencing.(Figure 1)
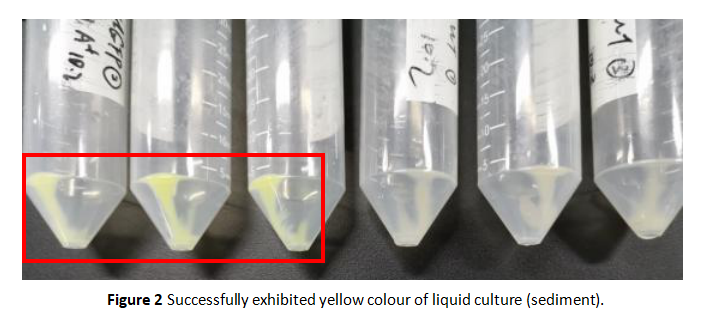
The amilGFP protein was visible in yellow colour less than 24-hour incubation after adding IPTG both on LB plates or in liquid culture.(Figure 2)
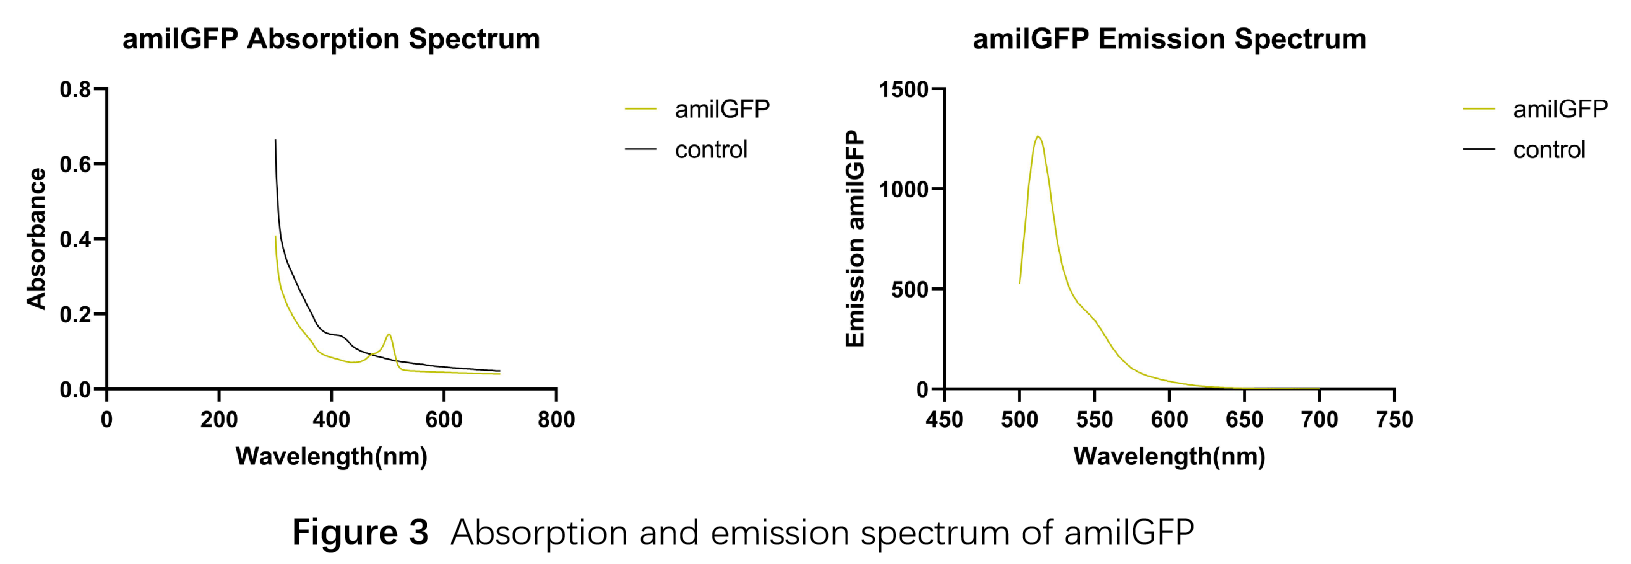
In order to measure the absorption and emission spectra of amilGFP, we cultured engineered E.coli cells in liquid LB medium, induced the expression of amilGFP with IPTG and incubated at 37℃ overnight. After centrifugation, Cells were treated with 5ml PBS, disrupted through ultrasonication and then centrifuged again, the supernatant was transferred into a new tube and measured with the Microplate Reader in a range between 300-700 nm. The absorption peak is 502 nm and the emission peak was at 512 nm.(Figure 3)
References
[http://www.ncbi.nlm.nih.gov/pubmed/18648549] Alieva, N. O., et al. 2008. Diversity and evolution of coral fluorescent proteins. PLoS One 3:e2680.
GenBank: AY646067.1
Shanghai_HS_United 2019's characterization
BBa_K592010 amilGFP, yellow chromoprotein
The E. coli expressing blue fluorescent protein(amilGFP) were cultured at 28 °C and the overnight bacterial solution was collected for subsequent measurement.
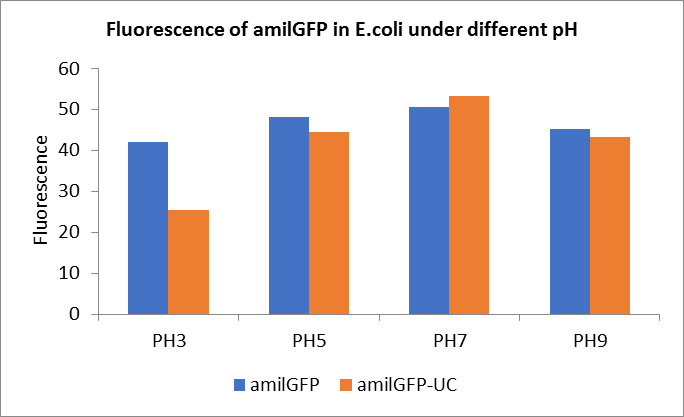
After ultrasonically disruption of the above bacterial solution ,5 ul of each was added to 4 kinds of 45 ul solution having a pH of 3, 5, 7, and 9, and the fluorescence was measured using varioskan flash of Thermo Scientific. The excitation wavelength/emission wavelength corresponding to each fluorescent protein is: amilGFP: 395/509.
Fig1. Fluorescence of amilGFP under different pH.There were two kinds of amilGFP expressing in E.coli(amilGFP) and expressing in E.coli after ultrasonically disruption(amilGFP -UC). Under the same pH3 and pH5, the fluorescence of amilGFP was higher than amilGFP-UC. Under the same pH7 and pH9, the fluorescence of amilGFP was lower than amilGFP-UC. With increasing of pH( among pH3, pH5, pH7,), the fluorescence of amilGFP and amilGFP-UC all raised. When the pH increased from pH7 to pH9, the fluorescence of amilGFP and amilGFP-UC were all down.
The results showed that the fluorescent value of each fluorescent protein did not change significantly in acid and alkali circumstance before sonication, but after sonication, each fluorescent protein showed the highest fluorescent value at pH 7, and the fluorescent value decreased as the environment became more acidic.
Shanghai-United 2019's characterization
BBa_K592010 amilGFP, yellow chromoprotein
The fluorescence intensity of fluorescent protein is related to protein expression. The protein expression level is related to the culture time and culture temperature. In addition, the fluorescence intensity of fluorescent protein is also related to excitation and emission spectra. We designed experiments to explore the effects of the above three factors on the intensity of fluorescent protein.
1. We transformed the plasmid contanining gfp, amilgfp into bacterial competent cells separately separately, plated and cultured overnight at 37 °C.
2. On the evening of the next day, we picked single clone into a tube containing 5 ml LB which is called 0h. At the same time, we also inoculated competent DH5α strain into a tube containing 5 ml LB as a blank control.We culture bacterial cells at 37 ° C, 220 rpm. The sampling time point is 24h.
3. We took 100ul of the bacteria culture and measured the total fluorescence with a Thermo fluorescence microplate reader. We took 200ul of the ten-fold diluted bacterial solution and measured the OD600 with BioTek optical microplate reader. Total fluorescence is divided by OD600 to obtain fluorescence value per OD600 .
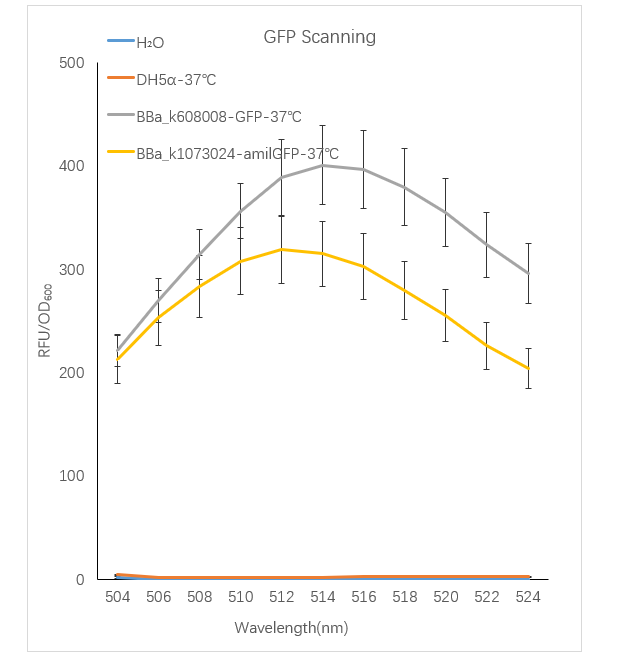
Figure1. GFP containing strain RFU/OD600 at different emission Wavelength.
The Bba_K608008 strain RFU/OD600 of the strain varies with the emission wavelength. The overall curve showed a normal distribution and the RFU/OD600 of the strain reachs its maximum at 514 nm. The BBa_k1073024 strain RFU/OD600 of the strain varies with the emission wavelength. The overall curve showed a normal distribution and the RFU/OD600 of the strain reachs its maximum at 512 nm. The absorbance value of the blank control DH5α and H2O are close to zero.
Hamburg 2020's characterisation
We investigated the influence of glucose concentration in growth media, on the amilGFP expression in different bacteria strains.
To assess whether glucose is affecting the formation of amilGFP, two parameters were investigated.
Firstly, a growth experiment with differing glucose levels (0, 0.5, 1, 2 and 4%) was performed in a technical quadruplicate with measurements of the OD600 every 10 minutes over the curse of 20 hours shaking at 216 rpm at 37°C with two different E.coli strains (E. coli DHα, E. coli BL21 DE3).
BL21 and DHα showed no noteworthy difference in the doubling time with rising glucose levels and no growth without glucose.
Next, optical measurements for the formation of amilGFP were performed at the same conditions as mentioned above. The excitation wavelength was 485 nm and the emission wavelength was 535 nm.
The data of BL21 show that the best concentrations for the rise of fluorescence per hour are 1 and 2 % Glucose concentration. After the exponential growth phase, the rise decreases remarkably.
The data of DH5α show that the best concentrations for the rise of fluorescence per hour are 2 and 4% Glucose concentration. After the exponential growth phase, the rise decreases remarkably.
Although BL21 had a higher OD600 DH5α showed higher fluorescence gain per hour.
Characterization by 2021iGEM_Shanghai_United
Improvement of an existing part
In order to optimize the function of BBa_K592010, we constructed an improved composite part BBa_K3991006, which is involved in the response of E. coli to heavy metal arsenic. The purpose of our product is to reduce individuals’ exposure to arsenic and prevent the harmful impact it might bring through accurately detecting the arsenic in people’s surroundings. After the successful construction of the engineering bacteria, on the one hand, it can help environmental monitors detect the pollution of heavy metal arsenic in the environment, and on the other hand, it can allow residents to detect whether there is heavy metal arsenic pollution in domestic water by themselves, thereby providing help for people's healthy life.
The improved strain can not only reflect the pollution situation according to the GFP signal, but also can be used for further transformation to reduce the pollution of heavy metal arsenic, such as promoting the enrichment of arsenic and then processing.
Profile
BBa_K3991006
Name: pro-ArsD-amilGFP
Base Pairs: 1200 bp
Origin: Escherichia coli (strain: LST424C, nat-host: Homo sapiens)
Properties: Gene technology for protecting patented bacterial strains
Usage and Biology
According to the WHO, arsenic levels above 10 parts per billion in water are harmful to humans. Levels in Bangladesh, however, are five times as much. The Bangladesh arsenic contamination is pending a solution. "I have no alternative." Uddin, a villager in Bangladesh, helplessly expresses his views towards drinking arsenic-contaminated well water.
What comes to your mind first when talking about arsenic? Arsenic is a naturally occurring element that is widely distributed in the earth's crust. It is found in water, air, food, and soil. In recent years, reports of arsenic poisoning have been increasing year by year.
Arsenic seeps into groundwater through rocks and soil, resulting in drinking water from surface sources (such as wells) that often contain higher levels of arsenic than water from, for example, lakes or reservoirs. In addition to groundwater, arsenic levels of 1.7 μg/L have been detected in the ocean, far exceeding the international regulation of 0.0175 μg/L (Neff, 2009). Irrigation with arsenic-contaminated water sources makes arsenic hazardous to human health from the food side. In addition, arsenic can also enter the human body from external sources, such as paints, textiles, and metal adhesives, through direct ingestion, gaseous inhalation, or skin absorptio. Or it can be absorbed by humans as a component of tobacco (WHO, 2018). Long-term exposure to high levels of arsenic can be harmful to humans, especially to developing infants and children. Although arsenic is not well understood, once it enters the body, the skin and various systems such as the nervous, respiratory, cardiopulmonary, immune, and endocrine systems are affected. In addition, the liver, kidneys, bladder, and prostate, which are responsible for detoxification, are damaged and cannot function effectively (National Institute of Environment Health Science, 2021).
For example, in a village in Hunan, China, 1200 in total 3000 residents have been tested for arsenic poisoning, which was mainly caused by the mining of realgar ore. According to the local hospital, 400 of 600 miners who have been tested for arsenic poisoning died from cancer. For instance, a family of 7 people all died from cancer, and 5 of the cases were determined that they were caused by arsenic poisoning (Chinese Center for Disease Control and Prevention, 2014).
Not only for humans but excessive levels of arsenic can also affect plants and animals in the natural environment. For example, aquatic plants (e.g. algae), zooplankton, and amphibians, or aquatic animals (e.g. snails, fish, crustacean larvae, marine mammals) are all exposed to inorganic arsenic toxicity (Neff, 2009).
Arsenic is a microelement that is omnipresent in the environment. However, it is this common microelement that could be harmful to human body. If we take in more than 50 µg/L of arsenic, the function of our body will be disrupted. Also, the level of arsenic throughout the world is gradually increasing every year, and has already exceeded the level that human body can metabolize.
Areas close to factories whose product involves arsenic usually have a high arsenic concentration. Thus, we need arsenic detectors to ensure the security of people who work in these factories. According to the questionnaires and street research we did, although the general public did not know much about arsenic, most people believed that having an inexpensive and accurate sensor to detect arsenic is necessary. In addition, environmental and market scientists also considered that the current testing methods in the market are too cumbersome, so equipment that can detect arsenic levels easily and efficiently is required.
Construct design
BBa_K3991000
Name: ArsD
Base Pairs: 1200 bp
Origin: Escherichia coli (strain: LST424C, nat-host: Homo sapiens)
Properties: Gene technology for protecting patented bacterial strains
ArsD is a trans-acting repressor of the arsRDABC operon that confers resistance to arsenicals and antimonials in Escherichia coli.
BBa_K592010
Name: amilGFP
Base Pairs: 699bp
Origin: Acropora millepora
Properties: A yellow chromoprotein
Usage and Biology
This part is useful as a reporter and it naturally exhibits strong yellow color when expressed.
In the process of cultivating microorganisms, namely Escherichia coli, because of their small size, they cannot be directly observed with the naked eye, and a certain method is needed for monitoring. In cell biology and molecular biology, the green fluorescent protein (GFP) gene is often used as a reporter gene. Through genetic engineering technology, the green fluorescent protein (GFP) gene can be transferred into the genomes of different species and continue to be expressed in offspring. . Therefore, we constructed the amilGFP engineered bacteria to show the growth status (number and vitality) of E. coli by observing the strength of the green fluorescent protein signal.
Experimental approach
Production, purification, and sequcing analysis of recombinant ArsD-amilGFP
Figure 1 shows gel electrophoresis results of amilGFP PCR. Column M is a 2K marker ladder. Columns 1-6 are PCR products of amilGFP genes.
All 1-6 columns displayed successful results at 700bp which could be used for later experiments.
Figures 3 show the result for colony PCR identification on the E.coli with ARSD/amilGFP inserted that were cultivated previously. The purpose is to examine whether the E.coli contains expected gene segment of ARSD.
Function Tests
Function Test With NaH2PO4, Attempt 1
Such function tests were performed under the hypothesis that NaH2PO4 is structurally similar to arsenic compounds that were meant to be detected. NaH2PO4 is used to substitute for arsenic compounds due to experimental safety. No fluorescence was detected in all samples, indicating that the concentrations of NaH2PO4 may be too low or that genetically engineered E. coli will not react to NaH2PO4.
Function Test With NaH2PO4, Attempt 2
In order to verify our assumption in attempt 1, NaH2PO4 was used again in this testing, with greater concentration than the last test. No fluorescence was detected in all samples, indicating the inability of the genetically engineered E. coli to react with NaH2PO4.
Function Test With C2H6AsNaO2
Given that NaH2PO4 cannot be used to stimulate the expression of amilGFP in genetically engineered E. coli, C2H6AsNaO5 was used for this function test. Extremely minor fluorescence was detected by a microplate reader after 19 hours of reaction time. This result confirms the design of E. coli to be correct and functional.
Figure 4 displays the fluorescence intensity generated by an ARSD/amilGFP transformed E. coli reacting for 1 hour in C2H6AsNaO5 solutions. As seen in the figure, fluorescence was detected for all C2H6AsNaO5 concentrations that are above 0, which confirms that the designed plasmid worked as intended. However the fluorescence was rather minor, so we speculate that E. coli responds poorly to organic arsenic compounds. Further experiments would be conducted to test for fluorescence intensities of E. coli in inorganic arsenic solutions.
Future plan
Our main target customer are companies, factories, and government departments that being involved with arsenic detection. The main reason is that this detecting equipment can detect arsenic in a more efficient, convenient, and most importantly, more economical way. It is true to say that, the only conceivable drawback might be the accuracy of the result. However, the result is comparatively accurate enough to support our target clients to make basic decisions. Besides, we also take into account that some families with high pursuit of life quality, who worry about arsenic’s harmfulness and might become our potential customers, because these groups are usually educated to know the necessity of protecting their health, while purchasing specialized equipment is also affordable for them.
References
(1)Neff, J.M. (1997). ECOTOXICOLOGY OF ARSENIC IN THE MARINE ENVIRONMENT—Review. Environmental Toxicology and Chemistry, 16(5), p.917.
(2)Chinese Center For Disease Control and Prevention (2014). 中国疾病预防控制中心. [online] www.chinacdc.cn.
(3)Ahmad, S. A., Khan, M. H., & Haque, M. (2018, November 30). Arsenic contamination in groundwater in Bangladesh: Implications and challenges for healthcare policy. Risk management and healthcare policy. https://www.ncbi.nlm.nih.gov/pmc/articles/PMC6281155/.
(4)Argos, M. (2012, December 1). Arsenic and human health: epidemiologic progress and public health implications. De Gruyter. https://www.degruyter.com/document/doi/10.1515/reveh-2012-0021/html
(5)Arsenic. (2021, May 3). National Institute of Environmental Health Sciences. https://www.niehs.nih.gov/health/topics/agents/arsenic/index.cfm
(6)Institute, E. (2020, May 6). Clay layers and Distant PUMPING Trigger arsenic contamination in Bangladesh Groundwater. State of the Planet. https://news.climate.columbia.edu/2020/05/07/clay-arsenic-bangladesh-groundwater/.
(7)International Agency for Research on Cancer. (2012). Review of Human Carcinogens: C. Metals, Arsenic, Dusts and Fibres (IARC Monographs on the Evaluation of the Carcinogenic Risks to Humans, 100) (Vol. 100C). World Health Organization. https://publications.iarc.fr/120
(8)Matta, G. (2016, June). 2015 - 2016_Mercury, lead and arsenic impact on environment and human health.pdf. Academia.Edu. https://www.academia.edu/38166988/2015_2016_Mercury_lead_and_arsenic_impact_on_environment_and_human_health_pdf
(9)Saha, J. C., Dikshit, A. K., Bandyopadhyay, M. A., & Saha, K. C. (1999, July 1). A Review of Arsenic Poisoning and its Effects on Human Health. ResearchGate. https://www.researchgate.net/publication/248944528_A_Review_of_Arsenic_Poisoning_and_its_Effects_on_Human_Health
(10)SUI Jiachen, YU Hansong, DAI jiayu, et al. Advances in the application of biosensor technology for the detection of heavy metal arsenic in foods[J]. Food Science, 2016, 37(7): 233-238. DOI:10.7506/spkx1002-6630-201607042. http://www.spkx.net.cn
(11)Shaji, E., Santosh, M., Sarath, K., Prakash, P., Deepchand, V., & Divya, B. (2021). Arsenic contamination of groundwater: A global synopsis with focus on the Indian Peninsula. Geoscience Frontiers, 12(3). https://doi.org/10.1016/j.gsf.2020.08.015
(12)The American Cancer Society medical and editorial content team. (2020, August 5). Arsenic and Cancer Risk. American Cancer Society. https://www.cancer.org/cancer/cancer-causes/arsenic.html
(13)Undark Magazine. (2019, December 20). The Poisoning of Bangladesh: How Arsenic Is Ravaging a Nation. https://undark.org/2017/08/16/bangladesh-arsenic-poisoning-drinking-water/
(14)Yogarajah, N., & Tsai, S. S. H. (2015, May 1). Detection of trace arsenic in drinking water: challenges and opportunities for microfluidics - Environmental Science: Water Research & Technology (RSC Publishing) DOI:10.1039/C5EW00099H. Royal Society of Chemistry. https://pubs.rsc.org/en/content/articlehtml/2015/ew/c5ew00099h
(15)Arsenic W.H.O. World Health Organization. February. 2018. [Accessed August 3, 2018]. Available from: http://www.who.int/news-room/fact-sheets/detail/arsenic.
Characterization by 2021iGEM_The_Webb_Schools
Improvement of an Existing Part
Compared to the old part BBa_K592010, expressing GFP, we design a new part BBa_K3983003, which is expressing Peroxidase (efeB). The BBa_K592010 part is useful as a reporter. Peking iGEM 2016 has fused this part with triple spytag. The fused protein is participate in Peking’s polymer network. By adding this protein, the whole polymer network become visible in most conditions. The difference is that our goal is to build an engineered bacterium that can produce peroxidase efeB, which can reduce excessive reactive oxygen species produced in patients with depression by producing peroxidase, thereby reducing the possibility of depression. We chose efeB, which sequence is different from BBa_K592010 (Fig8), to construct our desired engineering strain.
First of all, we constructed a composite part BBa_K592010, and transformed it into E.coli DH5a. We successfully expressed and purified GFP protein , and detected the enzyme activity. Furthermore, in order to optimize the function of BBa_K592010,we constructed an improved composite part BBa_K3983003, which can participate in the redox process in the organism, reduce the occurrence of oxidation process, thereby reducing the active oxygen in the body of patients with depression to a certain extent.
In addition, we select a kind of probiotics E.coli DR5α as the host. Therefore, our engineering strain was a strong potential drug that can be eaten by patients for ROS and reduce the incidence of depression in patients.
Profile
Name: efeB-amilGFP
Base Pairs: 3953 bp
Origin: Escherichia coli str. K-12 substr. MG1655
Properties: an antioxidant enzyme system
Usage and Biology
In modern society, more and more people suffer from mild or severe depression. It has been reported that malondialdehyde (MDA) level in the plasma of depressed patients is significantly increased. After receiving conventional antidepressant treatment, the patient's MDA level decreased to the same as that of healthy people. Therefore, researchers believe that oxidative stress may play an important role in the occurrence and development of depression, and the activity of antidepressant therapy may be mediated by improving oxidative stress/antioxidant function. We attempt to express an antioxidant enzyme system (peroxidase gene efeB) in the cell or on the surface of the engineered probiotic bacteria to inhibit the production of malondialdehyde (MDA) by human cells and prevent cell oxidation from causing health damage to the body. So as to prevent or alleviate the condition of depression. The oxidation rate of peroxisome increases in proportion to the increase of oxygen tension. Especially in the case of high oxygen concentrations, the oxidation reaction of peroxisomes dominates. This characteristic allows peroxisomes to protect cells from the toxic effects of high concentrations of oxygen. efeB reduces the oxidative stress in the cell by competing with mitochondria for oxygen, and reduces the MDA produced during the oxidation of lipids.
Construct design
Peroxidase EfeB, originally studied as a substrate of the E. coli "double arginine" translocation system, is the first recognized peroxidase for bacterial dye decolorization. Subsequent studies have shown that EfeB is a peroxidase with heme as a prosthetic group, and has a specific iron transport function.We use E. coli as the starting strain and construct an engineered strain of efeB to explore the effects of efeB on bacterial growth, malondialdehyde concentration, ROS synthesis and antioxidant pathways under different oxidative stress conditions.
In the process of cultivating microorganisms, namely Escherichia coli, because of their small size, they cannot be directly observed with the naked eye, and a certain method is needed for monitoring. In cell biology and molecular biology, the green fluorescent protein (GFP) gene is often used as a reporter gene. Through genetic engineering technology, the green fluorescent protein (GFP) gene can be transferred into the genomes of different species and continue to be expressed in offspring. . Therefore, we constructed the amilGFP engineered bacteria to show the growth status (number and vitality) of E. coli by observing the strength of the green fluorescent protein signal.
The T7 promoter is often used for protein overexpression. It is powerful and specific. It is completely controlled by T7 RNAP. When T7 RNAP is present in the cell, the T7 expression system occupies an absolute advantage compared to the host expression system. Its expression The speed is 5 times that of the former.
BBa_K592010
Name: amilGFP
Base Pairs: 699bp
Origin: Acropora millepora
Properties: A yellow chromoprotein
Usage and Biology
This part is useful as a reporter and it naturally exhibits strong yellow color when expressed.
BBa_K3983002
Name: pro-efeB
Base Pairs: 2107 bp
Origin: Escherichia coli str. K-12 substr. MG1655
Properties: an antioxidant enzyme system
Experimental approach
Production, purification, and sequcing analysis of recombinant efeB-amilGFP
This step is used to test if the plasmids efeB-amilGFP extracted from the E. coli DH5α are successful and could be used to do double enzyme digestion later in the process. Channel2-8: efeB-amilGFP succeeded
Proof of function
The growth of engineering bacteria under H2O2 treatment conditions
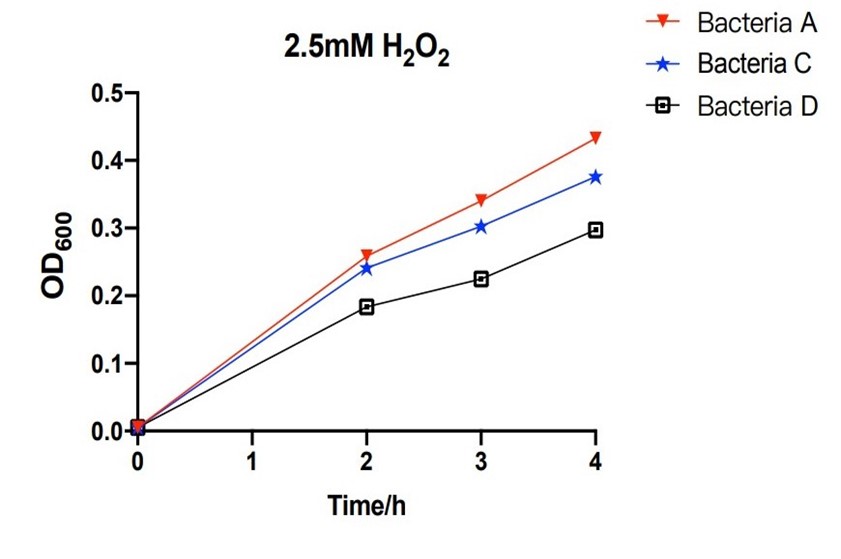
The bacteria A contains plasmid A, pUC57-efeB. The bacteria C contains plasmid C, pUC57-efeB-amilGFP. The bacteria D contains plasmid D, pUC57. The bacteria are placed in 2.5mM hydrogen peroxide and their growth is measured for the first 4 hours. Bacteria D, without the efeB gene, has lower growth than bacteria A and bacteria C. This shows that efeB gene helps bacteria to grow when ROS is present.
MDA and Fluorescence Measuring
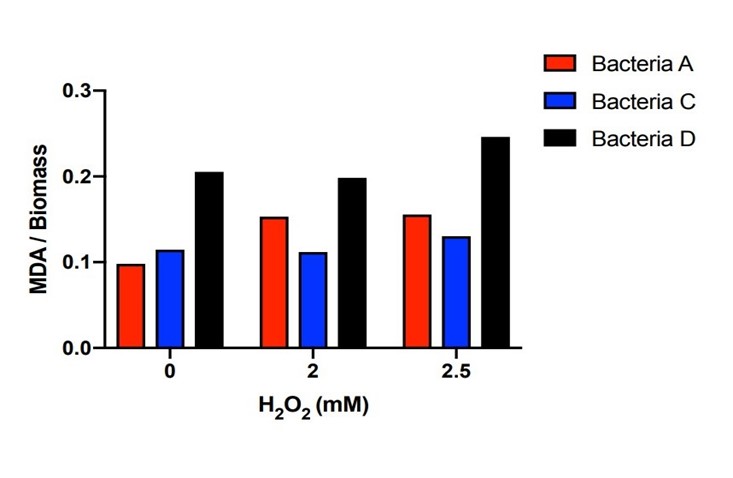
Bacteria A, C, D were placed in hydrogen peroxide solution for 21 hours and the concentration of MDA was measured. Bacteria A and C kept the MDA concentration dramatically lower than those of Bacteria D under the hydrogen peroxide concentration of 0mM, 2mM and 2.5mM. There is a certain amount of MDA concentration within DH5α when the H2O2 concentration is 0mM. Starting from the original DH5α MDA concentration to the higher MDA concentration imposed by the 2mM and 2.5mM H2O2 concentration, Bacteria A and C with the efeB gene all effectively reduced the MDA concentration to the level lower than Bacteria D.
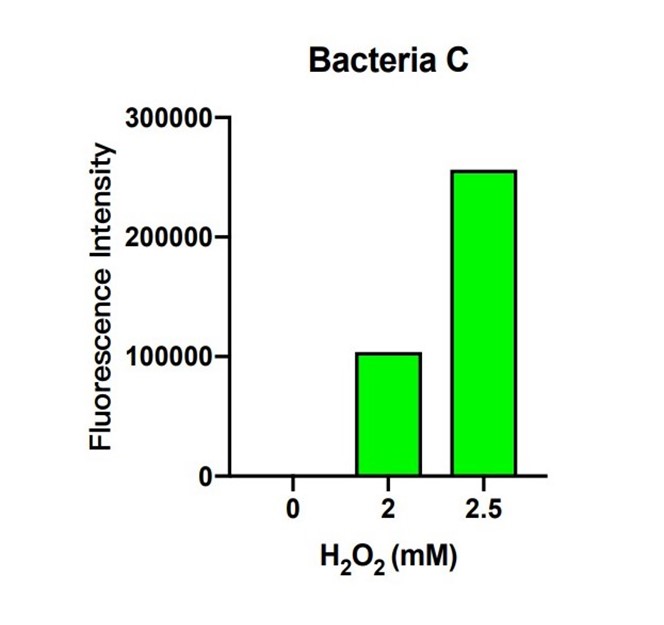
In bacteria C, the expression of GFP is controlled by the expression of efeB. The more intense the fluorescence is, the better efeB will express. H2O2 climbed from 0 to 2.5 mM, and the intensity of fluorescence climbed higher as well. The tendency of the intensity shows that the expression of efeB increases with the H2O2 concentration. Expression of efeB disturbs the production of MDA.
Bacteria C was placed in the 2.5nM hydrogen peroxide solution, and the level of MDA was measured under different hours. During the first 4 hours, the concentration of MDA increased up to 20 mmol/mg. The concentration of MDA decreased to 6 mmol/mg for the next four hours. The measured levels of MDA demonstrate that the efeB gene can curb the increase of MDA and keep it in a relative low level.
In order to deeper analyze the factors which may affect the ability of bacteria C and bacteria A to inhibit MDA production, more function tests would be designed and conducted in future.
Reference
[1] McCarter T. (2008). Depression overview. American health & drug benefits, 1(3), 44–51.
[2] Chand SP, Arif H. Depression. [Updated 2020 Nov 18]. In: StatPearls [Internet]. Treasure Island (FL): StatPearls Publishing; 2021 Jan-. Available from: https://www.ncbi.nlm.nih.gov/books/NBK430847/
[3] Wang, J., Wu, X., Lai, W., Long, E., Zhang, X., Li, W., Zhu, Y., Chen, C., Zhong, X., Liu, Z., Wang, D., & Lin, H. (2017). Prevalence of depression and depressive symptoms among outpatients: a systematic review and meta-analysis. BMJ open, 7(8), e017173. https://doi.org/10.1136/bmjopen-2017-017173
[4] Bueno-Notivol, J., Gracia-García, P., Olaya, B., Lasheras, I., López-Antón, R., & Santabárbara, J. (2021, January 1). Prevalence of depression during the COVID-19 outbreak: A meta-analysis of community-based studies. International Journal of Clinical and Health Psychology. DOI: 10.1016/j.ijchp.2020.07.007.
[5] U.S. Department of Health and Human Services (HHS). (n.d.). Major Depression. National Institute of Mental Health. https://www.nimh.nih.gov/health/statistics/major-depression#part_155720.
[6] Ferguson, J. M. (2001, February). SSRI Antidepressant Medications: Adverse Effects and Tolerability. Primary care companion to the Journal of clinical psychiatry. Doi: 10.4088/pcc.v03n0105
[7] Jiménez-Fernández, S., Gurpegui, M., Dí¬az-Atienza, F., Pérez-Costillas, L., Gerstenberg, M., & Correll, C. U. (2021, March 1). Comparison of ODD vs Healthy Controls. Psychiatrist.com. dx.dot.org/10.4088/JPC.14r09179.
[8] Rowe, L. A., Degtyareva, N., & Doetsch, P. W. (2008). DNA damage-induced reactive oxygen species (ROS) stress response in Saccharomyces cerevisiae. Free radical biology & medicine, 45(8), 1167–1177. https://doi.org/10.1016/j.freeradbiomed.2008.07.018
[9] Jiménez-Fernández, S., Gurpegui, M., Díaz-Atienza, F., Pérez-Costillas, L., Gerstenberg, M., & Correll, C. U. (2015). Oxidative stress and antioxidant parameters in patients with major depressive disorder compared to healthy controls before and after antidepressant treatment: results from a meta-analysis. The Journal of clinical psychiatry, 76(12), 1658–1667. https://doi.org/10.4088/JCP.14r09179
[10] Li, J., Yang, Z., Qiu, H., Wang, Y., Jian, L., Ji, J., & Li, K. (2020). Anxiety and depression among general population in China at the peak of the COVID-19 epidemic. World psychiatry : official journal of the World Psychiatric Association (WPA), 19(2), 249–250. https://doi.org/10.1002/wps.20758
[11] Vaváková, M., Ďuračková, Z., & Trebatická, J. (2015, May 20). Markers of Oxidative Stress and Neuroprogression in Depression Disorder. Oxidative Medicine and Cellular Longevity. https://doi.org/10.1155/2015/898393
[12] Wang Y;Li H;Li T;He H;Du X;Zhang X;Kong J; (n.d.). Cytoprotective effect of Streptococcus thermophilus against oxidative stress mediated by a novel peroxidase (EfeB). Journal of dairy science. DOI: 10.3168/jds.2018-14601
Sequence and Features
- 10COMPATIBLE WITH RFC[10]
- 12COMPATIBLE WITH RFC[12]
- 21COMPATIBLE WITH RFC[21]
- 23COMPATIBLE WITH RFC[23]
- 25COMPATIBLE WITH RFC[25]
- 1000COMPATIBLE WITH RFC[1000]

