Difference between revisions of "Part:BBa K592101"
(→Contribution) |
JingyiWang (Talk | contribs) (→Characterization) |
||
| (22 intermediate revisions by 6 users not shown) | |||
| Line 23: | Line 23: | ||
Author: Adrián Requena Gutiérrez | Author: Adrián Requena Gutiérrez | ||
<br> | <br> | ||
| − | Summary:We have adapted the part to be able to assemble transcriptional units with the Golden Gate method and we have added the degradation tag ssRA LVA. After that, we have characterized the protein degradation | + | Summary:We have adapted the part to be able to assemble transcriptional units with the Golden Gate method and we have added the degradation tag ssRA LVA. After that, we have characterized the change in the protein degradation due to this tag. |
<br> | <br> | ||
Documentation: | Documentation: | ||
| Line 29: | Line 29: | ||
<html> | <html> | ||
<p> | <p> | ||
| − | First, we adapted the CDS BBa_K592101 to be used to assemble composite parts using the Golden Gate method, creating <a href="https://parts.igem.org/Part:BBa_K2656021">BBa_K2656021</a>. Next, we performed an <a href="http://2018.igem.org/Team:Valencia_UPV/Experiments#spectra">experiment</a> to obtain the excitation and emission spectra. To do this, we created the transcriptional unit <a href="https://parts.igem.org/Part:BBa_K2656112"> BBa_K2656112</a> and we used the parameters of the Table 1: | + | First, we adapted the CDS BBa_K592101 to be used to assemble composite parts using the Golden Gate method, creating <a href="https://parts.igem.org/Part:BBa_K2656021">BBa_K2656021</a> and we added the LVA degradation tag, creating <a href="https://parts.igem.org/Part:BBa_K2656020">BBa_K2656020</a>, our improved part. Next, we performed an <a href="http://2018.igem.org/Team:Valencia_UPV/Experiments#spectra">experiment</a> to obtain the excitation and emission spectra. To do this, we created the transcriptional unit <a href="https://parts.igem.org/Part:BBa_K2656112"> BBa_K2656112</a> and we used the parameters of the Table 1: |
</p> | </p> | ||
<ul style=" | <ul style=" | ||
| − | padding-left: | + | padding-left: !important;"> |
<li><p><a href="https://parts.igem.org/Part:BBa_K2656004">BBa_K2656004</a>: the <a href="https://parts.igem.org/Part:BBa_J23106">J23106</a> promoter in its GoldenBraid compatible version from our <a href="http://2018.igem.org/Team:Valencia_UPV/Part_Collection">Part Collection</a></p></li> | <li><p><a href="https://parts.igem.org/Part:BBa_K2656004">BBa_K2656004</a>: the <a href="https://parts.igem.org/Part:BBa_J23106">J23106</a> promoter in its GoldenBraid compatible version from our <a href="http://2018.igem.org/Team:Valencia_UPV/Part_Collection">Part Collection</a></p></li> | ||
<li><p><a href="https://parts.igem.org/Part:BBa_K2656009">BBa_K2656009</a>: the <a href="https://parts.igem.org/Part:BBa_B0030">B0030</a> ribosome biding site in its GoldenBraid compatible version from our <a href="http://2018.igem.org/Team:Valencia_UPV/Part_Collection">Part Collection</a></p></li> | <li><p><a href="https://parts.igem.org/Part:BBa_K2656009">BBa_K2656009</a>: the <a href="https://parts.igem.org/Part:BBa_B0030">B0030</a> ribosome biding site in its GoldenBraid compatible version from our <a href="http://2018.igem.org/Team:Valencia_UPV/Part_Collection">Part Collection</a></p></li> | ||
| Line 77: | Line 77: | ||
</p> | </p> | ||
</li> | </li> | ||
| − | + | <li> | |
<p> | <p> | ||
<a href="https://parts.igem.org/Part:BBa_K2656111"> BBa_K2656111</a>: | <a href="https://parts.igem.org/Part:BBa_K2656111"> BBa_K2656111</a>: | ||
| Line 88: | Line 88: | ||
<li><p><a href="https://parts.igem.org/Part:BBa_K2656026">BBa_K2656026</a></p></li> | <li><p><a href="https://parts.igem.org/Part:BBa_K2656026">BBa_K2656026</a></p></li> | ||
</ul> | </ul> | ||
| − | </ul | + | </ul> |
<p> Once the experiment was carried out, the results were plotted and Figure 2 was obtained, in which we can observe that the growth of the bacteria with both constructions was very similar, while the fluorescence had a clear variation.</p> | <p> Once the experiment was carried out, the results were plotted and Figure 2 was obtained, in which we can observe that the growth of the bacteria with both constructions was very similar, while the fluorescence had a clear variation.</p> | ||
</html> | </html> | ||
| Line 97: | Line 97: | ||
| − | <p>These data were optimized with our <a href="http://2018.igem.org/Team:Valencia_UPV/Model#const_models"> model</a> and the parameters from Table 2 were obtained. With these parameters it is possible to obtain that <b>the | + | <p>These data were optimized with our <a href="http://2018.igem.org/Team:Valencia_UPV/Model#const_models"> model</a> and the parameters from Table 2 were obtained. With these parameters it is possible to obtain that <b>the degradation of the protein with the tag is around twice as much as the one without the tag</b>. |
| − | + | <h6>Table 2. Optimized values of translation rate, degradation rate and dilution rate from experimental data | |
| + | </h6> | ||
<table class="wikitable"> | <table class="wikitable"> | ||
| − | <tbody | + | <tbody><tr> |
| − | + | ||
<th><p>Optimized parameters</p></th> | <th><p>Optimized parameters</p></th> | ||
<th><p>Values</p></th> | <th><p>Values</p></th> | ||
| Line 144: | Line 144: | ||
</tr></tbody></table> | </tr></tbody></table> | ||
| − | </ | + | </html> |
| + | <html> | ||
| + | <br> | ||
| + | <br> | ||
| + | Group: KU_LEUVEN iGEM 2019 | ||
| + | <br> | ||
| + | Authors: Zarina Nauryzgaliyeva, Cheska Cadacio | ||
| + | <br> <br> | ||
| + | Summary: The fluorescent capacity of YFP (yellow fluorescent protein) was determined in varying salt concentrations. The degree of YFP fluorescence was measured at NaCl concentrations of 0%, 2.5%, 5%, 7.5% and 10%, as 3% is the physiological salt concentration of seawater. The performed experiment and obtained data were relevant to our project, where we envisioned to use marine cyanobacteria as a platform for enzyme production. As these marine bacteria require salty medium and grow in the sea, the stability of potentially secreted proteins was valuable information when projecting the use of such bacteria for industrial biomanufacturing. | ||
| + | |||
| + | <br> <br> | ||
| + | Documentation: A kinetic measurement of YFP degradation was done in different salt concentrations over the duration of 3 hours using a spectrofluorometer, with measurements being taken every 15 minutes. Numerical results can be seen in Figure 1. The protein seems to be remarkably stable, maintaining steady levels of fluorescent activity in NaCl concentrations up to 10% over a 3 hour period. | ||
| + | <br> | ||
| + | </html> | ||
| + | <br> | ||
| + | [[File:T--KU_LEUVEN--YFP_graph_parts.png|900px|thumb|none|alt=YFP_graph.|Figure 3. YFP activity in the presence of NaCl over time.]] | ||
| + | |||
| + | <h2>Team NAU-CHINA 2022: Contribution</h2> | ||
| + | ===Characterization=== | ||
| + | |||
| + | This composite part is used to do further research on the yellow fluorescent protein (YFP), which is commonly used as the reporter of a gene circuit. | ||
| + | We chose the Bobrick BBa_K592101 from the iGEM distribution kit and recombined it to plasmid pET-29a(+) by homologous recombination. | ||
| + | We firstly studied the effect of different concentration of IPTG(Isopropyl-beta-D-thiogalactopyranoside) on the expression of YFP and the fluorescence intensity of bacteria. After that, we also extracted the YFP from the bacteria and identified the effect of temperature on YFP activity. | ||
| + | |||
| + | |||
| + | <b>1. The effects of different concentrations of IPTG on <em>E.coli</em> BL21 containing BBa_K4164018</b> | ||
| + | |||
| + | We compared the inducing effects of IPTG on YFP through different concentrations of IPTG. According to the result data, no significant differences in fluorescence intensity were observed by using different concentrations of IPTG (figure 1). What's more, we could deduce that the leakage expression was very low and the bacteria was sensitive to the IPTG induction. For the first four hours, the fluorescent intensity did not differ much under IPTG induction, among which 0.5mM showed the best. While after 4 hours of incubation, the fluorescence intensity rose sharply, reaching its highest value at the sixth hour, and remained stable with slight fluctuations ever since. | ||
| + | |||
| + | <html> | ||
| + | <center><img src="https://static.igem.wiki/teams/4164/wiki/contribution/figure-2.png"with="1000" height="" width="700" height=""/></center> | ||
| + | </html> | ||
| + | |||
| + | <p style="text-align: center!important;"> | ||
| + | <b>Figure1.The effects of different concentrations of IPTG on <em>E.coli</em> BL21(DE3) containing BBa_K4164018. </b></p> | ||
| + | |||
| + | <b>2. The effects of temperature on the activity of YFP</b> | ||
| + | |||
| + | It is derived from the literature that the α-helix at the closed end of the structure of green fluorescent protein extends inward to the mid-axis to become a scaffold for the chromophore. The chromophore is at the core of the entire structure and is protected by the peripheral β-folded sheet layer. Such a structure ensures a high stability of the whole structure and greatly improves the resistance of the core chromophore to heat, acid, alkali and denaturant factors. Therefore, we speculated that the effect of temperature on the yellow fluorescent protein was mainly on the protein, while there was no significant effect on the chromophore. From the data, we can see that there were some differences in the activity of YFP at different temperatures for <em>E. coli</em> BL21 (Figure 3). The results indicated that YFP activity was higher in low temperatures (eg. 4℃, 16℃ and 37℃) and lower in higher degrees. According to the curve, the value of fluorescence intensity of YFP firstly witnessed a slow drop from 4℃ to 16℃. Then it climbed steadily and peaked at a point somewhere before 37℃, which met our expectation. This confirmed our suspicion. | ||
| + | |||
| + | <html> | ||
| + | <center><img src="https://static.igem.wiki/teams/4164/wiki/contribution/figure-3.png"with="1000" height="" width="700" height=""/></center> | ||
| + | </html> | ||
| + | |||
| + | <p style="text-align: center!important;"> | ||
| + | <b>Figure2. The effects of temperature on YFP activity.</b></p> | ||
| + | |||
| + | <b>Phenotypic Photos </b> | ||
| + | |||
| + | <html> | ||
| + | <center><img src="https://static.igem.wiki/teams/4164/wiki/contribution/figure-4.png"with="1000" height="" width="700" height=""/></center> | ||
| + | </html> | ||
| + | |||
| + | <p style="text-align: center!important;"> | ||
| + | <b>Figure3.a.Effects of different IPTG concentrations on YFP expression b.YFP incubate crude enzyme solution at different temperatures for 30 min.</b></p> | ||
| + | |||
| + | |||
| + | |||
| + | <!-- Add more about the biology of this part here | ||
| + | |||
===References=== | ===References=== | ||
| − | [http://www.ncbi.nlm.nih.gov/pubmed/12183631] Elowitz, M. B., A. J. Levine, et al. (2002). "Stochastic gene expression in a single cell." Science 297(5584): 1183-6. | + | [http://www.ncbi.nlm.nih.gov/pubmed/12183631] Elowitz, M. B., A. J. Levine, et al. (2002). "Stochastic gene expression in a single cell." Science 297(5584): 1183-6. <br> |
<!-- --> | <!-- --> | ||
Latest revision as of 02:31, 14 October 2022
Yellow Fluorescent Protein (YFP)
Yellow Fluorescent Protein derived from Aequorea victoria GFP. This sequence is cloned from the pZE12-YFP plasmid used by Elowitz (see reference). The original gene was made by the The Yeast Resource Center (YRC) based at the University of Washington in Seattle, Washington.
iGEM12_Uppsala_University: If you are looking for a bright yellow fluorescent protein, the improved gene SYFP2 BBa_K864100 is a better choice than this part.
Usage and Biology
This part is useful as a reporter.
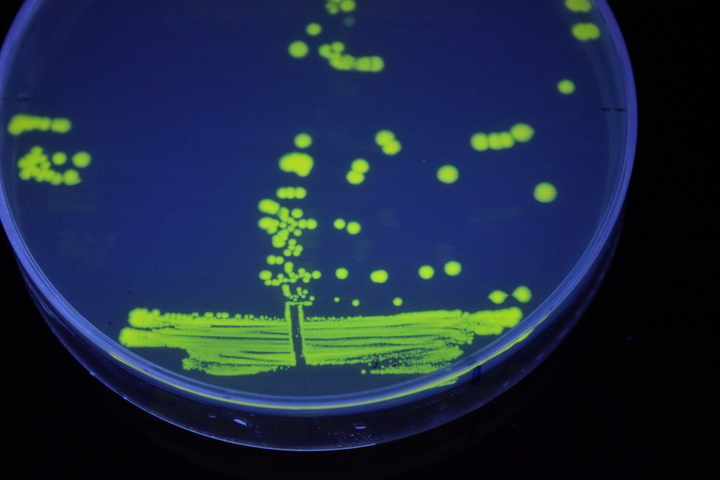
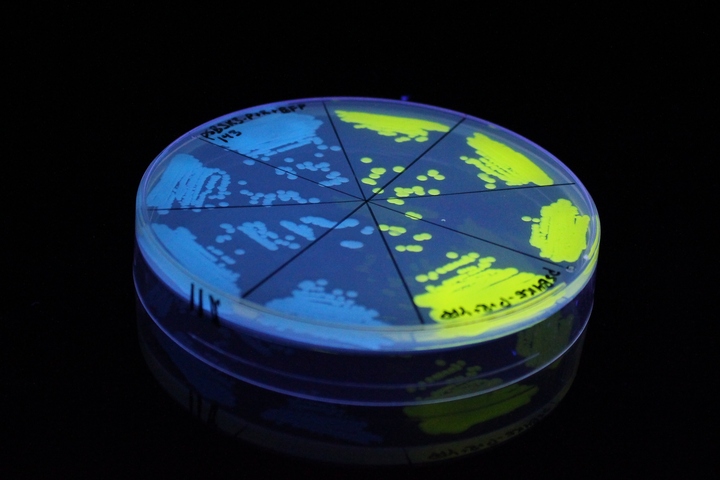
The images above show E coli constitutively expressing YFP BBa_K592101 (yellow) and mTagBFP BBa_K592100 (blue) illuminated on a UV table.
[http://2017.igem.org/Team:AFCM-Egypt# Egypt-AFCM Team] tried to improve YFP gel characterization and function at BBa_K592101 regarding its expression by the lac promoter (BBa_K2217017) as a weak constitutive promoter in one composite part to help enhancing YFP expression to characterize non-coding RNA regulatory activity. Part characterization and usage can be found at BBa_K2217023_Experience.
Contribution
Group: Valencia_UPV iGEM 2018
Author: Adrián Requena Gutiérrez
Summary:We have adapted the part to be able to assemble transcriptional units with the Golden Gate method and we have added the degradation tag ssRA LVA. After that, we have characterized the change in the protein degradation due to this tag.
Documentation:
First, we adapted the CDS BBa_K592101 to be used to assemble composite parts using the Golden Gate method, creating BBa_K2656021 and we added the LVA degradation tag, creating BBa_K2656020, our improved part. Next, we performed an experiment to obtain the excitation and emission spectra. To do this, we created the transcriptional unit BBa_K2656112 and we used the parameters of the Table 1:
BBa_K2656004: the J23106 promoter in its GoldenBraid compatible version from our Part Collection
BBa_K2656009: the B0030 ribosome biding site in its GoldenBraid compatible version from our Part Collection
BBa_K2656021: The original part BBa_K592101 compatible with the GoldenBraid assembly method
BBa_K2656026: the B0015 transcriptional terminator in its GoldenBraid compatible version from our Part Collection
Table 1. Parameters used to obtain the spectra
| Parameter | Value |
| Number of samples | 6 |
| Excitation Wavelength measurement range (nm) | [450-550] |
| Emission wavelenght (nm) | 580 |
| Emission Wavelength measurement range (nm) | [500-580] |
| Excitation wavelenght (nm) | 470 |
| Gain (G) | 50 |
To test the effect of the degradation tag, we designed an experiment with which we measured the increase in protein degradation due to this tag. To perform this experiment, we assembled two composite parts with the same promoter, RBS and terminator:
BBa_K2656020: The original part with the added LVA ssRA degradation tag compatible with the GoldenBraid assembly method
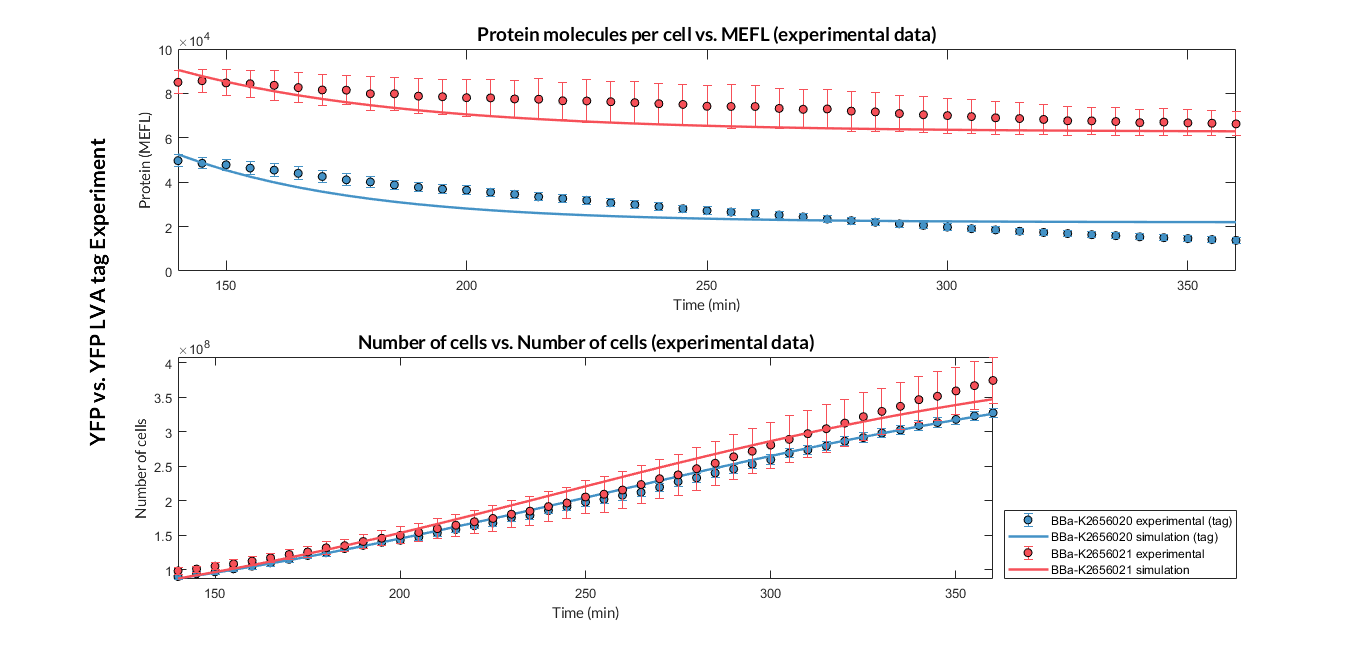
Once the experiment was carried out, the results were plotted and Figure 2 was obtained, in which we can observe that the growth of the bacteria with both constructions was very similar, while the fluorescence had a clear variation.
These data were optimized with our model and the parameters from Table 2 were obtained. With these parameters it is possible to obtain that the degradation of the protein with the tag is around twice as much as the one without the tag.
Table 2. Optimized values of translation rate, degradation rate and dilution rate from experimental data
Optimized parameters |
Values |
|---|---|
Translation rate p |
|
PoI degradation rate dp |
|
Dilution rate μ |
|
Group: KU_LEUVEN iGEM 2019
Authors: Zarina Nauryzgaliyeva, Cheska Cadacio
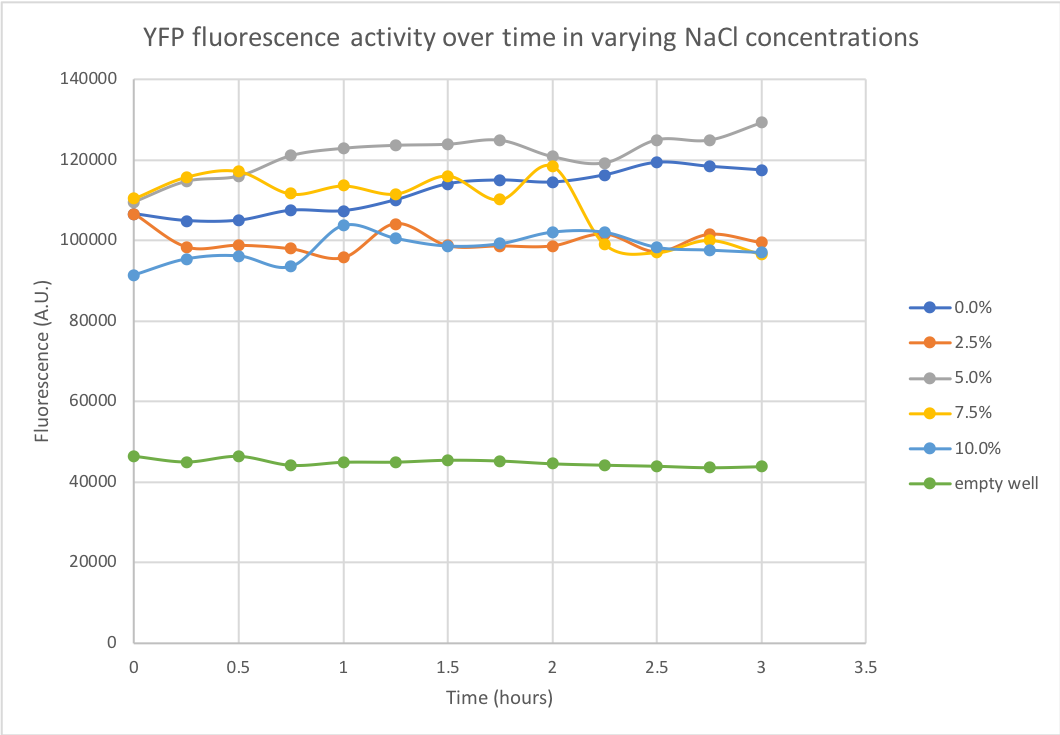
Summary: The fluorescent capacity of YFP (yellow fluorescent protein) was determined in varying salt concentrations. The degree of YFP fluorescence was measured at NaCl concentrations of 0%, 2.5%, 5%, 7.5% and 10%, as 3% is the physiological salt concentration of seawater. The performed experiment and obtained data were relevant to our project, where we envisioned to use marine cyanobacteria as a platform for enzyme production. As these marine bacteria require salty medium and grow in the sea, the stability of potentially secreted proteins was valuable information when projecting the use of such bacteria for industrial biomanufacturing.
Documentation: A kinetic measurement of YFP degradation was done in different salt concentrations over the duration of 3 hours using a spectrofluorometer, with measurements being taken every 15 minutes. Numerical results can be seen in Figure 1. The protein seems to be remarkably stable, maintaining steady levels of fluorescent activity in NaCl concentrations up to 10% over a 3 hour period.
Team NAU-CHINA 2022: Contribution
Characterization
This composite part is used to do further research on the yellow fluorescent protein (YFP), which is commonly used as the reporter of a gene circuit. We chose the Bobrick BBa_K592101 from the iGEM distribution kit and recombined it to plasmid pET-29a(+) by homologous recombination. We firstly studied the effect of different concentration of IPTG(Isopropyl-beta-D-thiogalactopyranoside) on the expression of YFP and the fluorescence intensity of bacteria. After that, we also extracted the YFP from the bacteria and identified the effect of temperature on YFP activity.
1. The effects of different concentrations of IPTG on E.coli BL21 containing BBa_K4164018
We compared the inducing effects of IPTG on YFP through different concentrations of IPTG. According to the result data, no significant differences in fluorescence intensity were observed by using different concentrations of IPTG (figure 1). What's more, we could deduce that the leakage expression was very low and the bacteria was sensitive to the IPTG induction. For the first four hours, the fluorescent intensity did not differ much under IPTG induction, among which 0.5mM showed the best. While after 4 hours of incubation, the fluorescence intensity rose sharply, reaching its highest value at the sixth hour, and remained stable with slight fluctuations ever since.

Figure1.The effects of different concentrations of IPTG on E.coli BL21(DE3) containing BBa_K4164018.
2. The effects of temperature on the activity of YFP
It is derived from the literature that the α-helix at the closed end of the structure of green fluorescent protein extends inward to the mid-axis to become a scaffold for the chromophore. The chromophore is at the core of the entire structure and is protected by the peripheral β-folded sheet layer. Such a structure ensures a high stability of the whole structure and greatly improves the resistance of the core chromophore to heat, acid, alkali and denaturant factors. Therefore, we speculated that the effect of temperature on the yellow fluorescent protein was mainly on the protein, while there was no significant effect on the chromophore. From the data, we can see that there were some differences in the activity of YFP at different temperatures for E. coli BL21 (Figure 3). The results indicated that YFP activity was higher in low temperatures (eg. 4℃, 16℃ and 37℃) and lower in higher degrees. According to the curve, the value of fluorescence intensity of YFP firstly witnessed a slow drop from 4℃ to 16℃. Then it climbed steadily and peaked at a point somewhere before 37℃, which met our expectation. This confirmed our suspicion.

Figure2. The effects of temperature on YFP activity.
Phenotypic Photos

Figure3.a.Effects of different IPTG concentrations on YFP expression b.YFP incubate crude enzyme solution at different temperatures for 30 min.
Sequence and Features
- 10COMPATIBLE WITH RFC[10]
- 12COMPATIBLE WITH RFC[12]
- 21COMPATIBLE WITH RFC[21]
- 23COMPATIBLE WITH RFC[23]
- 25COMPATIBLE WITH RFC[25]
- 1000INCOMPATIBLE WITH RFC[1000]Illegal BsaI.rc site found at 644


