Difference between revisions of "Part:BBa K2656020"
| (11 intermediate revisions by 2 users not shown) | |||
| Line 2: | Line 2: | ||
__NOTOC__ | __NOTOC__ | ||
<partinfo>BBa_K2656020 short</partinfo> | <partinfo>BBa_K2656020 short</partinfo> | ||
| + | [[File:T--Valencia_UPV--im11UPV2018.png|200px|thumb|right|alt=domestication.|Figure 1. DNA basic parts domestication. Third construction corresponds with CDS Basic Part adaptation into the GoldenBraid grammar. ]] | ||
| − | Part BBa_K2656020 is the Yellow fluorescent protein with LVA degradation tag sequence compatible with both Biobrick and [http://2018.igem.org/Team:Valencia_UPV/ | + | Part BBa_K2656020 is the Yellow fluorescent protein with LVA degradation tag sequence compatible with both Biobrick and [http://2018.igem.org/Team:Valencia_UPV/Design GoldenBraid 3.0] assembly methods. |
| + | It can be combined with other compatible parts from our [http://2018.igem.org/Team:Valencia_UPV/Part_Collection Valencia UPV IGEM 2018 Printeria Collection] to assemble transcriptional units with the <html><a href="https://static.igem.org/mediawiki/parts/b/bc/T--Valencia_UPV--protocols.pdf#page=27"> Golden Gate assembly protocol </a></html>. We designed this part to perform our [http://2018.igem.org/Team:Valencia_UPV/Improve improvement project]: | ||
<html> | <html> | ||
| Line 43: | Line 45: | ||
| − | [[File:T--Valencia_UPV--YFP_spectrum.png|900px|thumb|none|alt=YFP spectra.|Figure | + | [[File:T--Valencia_UPV--YFP_spectrum.png|900px|thumb|none|alt=YFP spectra.|Figure 2. YFP emission and excitation spectra]] |
<html> | <html> | ||
<p> | <p> | ||
| Line 63: | Line 65: | ||
<li><p><a href="https://parts.igem.org/Part:BBa_K2656004">BBa_K2656004</a></p></li> | <li><p><a href="https://parts.igem.org/Part:BBa_K2656004">BBa_K2656004</a></p></li> | ||
<li><p><a href="https://parts.igem.org/Part:BBa_K2656009">BBa_K2656009</a></p></li> | <li><p><a href="https://parts.igem.org/Part:BBa_K2656009">BBa_K2656009</a></p></li> | ||
| − | <li><p><a href="https://parts.igem.org/Part:BBa_K2656020">BBa_K2656020</a>: This | + | <li><p><a href="https://parts.igem.org/Part:BBa_K2656020">BBa_K2656020</a>: This part</p></li> |
<li><p><a href="https://parts.igem.org/Part:BBa_K2656026">BBa_K2656026</a></p></li> | <li><p><a href="https://parts.igem.org/Part:BBa_K2656026">BBa_K2656026</a></p></li> | ||
</ul> | </ul> | ||
| − | </ul | + | </ul> |
| − | <p> Once the experiment was carried out, the results were plotted and Figure | + | <p> Once the experiment was carried out, the results were plotted and Figure 3 was obtained, in which we can observe that the growth of the bacteria with both constructions was very similar, while the fluorescence had a clear variation.</p> |
</html> | </html> | ||
| − | [[File:T--Valencia_UPV--YFP-YFP_LVA.png|900px|thumb|none|alt=sfGFP spectra.|Figure | + | [[File:T--Valencia_UPV--YFP-YFP_LVA.png|900px|thumb|none|alt=sfGFP spectra.|Figure 3. Experimental results of the fluorescence comparison experiment between the transcriptional unit with BBa_K2656021 and the one with BBa_K2656020.]] |
<html> | <html> | ||
| − | <p>These data were optimized with our <a href="http://2018.igem.org/Team:Valencia_UPV/Model#const_models"> model</a> and the parameters from Table 2 were obtained. With these parameters it is possible to obtain that <b>the | + | <p>These data were optimized with our <a href="http://2018.igem.org/Team:Valencia_UPV/Model#const_models"> model</a> and the parameters from Table 2 were obtained. With these parameters it is possible to obtain that <b>the degradation of the protein with the tag is around twice as much as the degradation of the protein without the tag</b>. |
<h6>Table 2. Optimized values of translation rate, degradation rate and dilution rate from experimental data | <h6>Table 2. Optimized values of translation rate, degradation rate and dilution rate from experimental data | ||
</h6> | </h6> | ||
| Line 122: | Line 124: | ||
</tr></tbody></table> | </tr></tbody></table> | ||
| − | + | </html> | |
Latest revision as of 01:38, 18 October 2018
YFP_LVA Coding Sequence
Part BBa_K2656020 is the Yellow fluorescent protein with LVA degradation tag sequence compatible with both Biobrick and [http://2018.igem.org/Team:Valencia_UPV/Design GoldenBraid 3.0] assembly methods. It can be combined with other compatible parts from our [http://2018.igem.org/Team:Valencia_UPV/Part_Collection Valencia UPV IGEM 2018 Printeria Collection] to assemble transcriptional units with the Golden Gate assembly protocol . We designed this part to perform our [http://2018.igem.org/Team:Valencia_UPV/Improve improvement project]:
First, we adapted the CDS BBa_K592101 to be used to assemble composite parts using the Golden Gate method, creating BBa_K2656021 and we added the LVA degradation tag, creating BBa_K2656020, our improved part. Next, we performed an experiment to obtain the excitation and emission spectra. To do this, we created the transcriptional unit BBa_K2656112 and we used the parameters of the Table 1:
BBa_K2656004: the J23106 promoter in its GoldenBraid compatible version from our Part Collection
BBa_K2656009: the B0030 ribosome biding site in its GoldenBraid compatible version from our Part Collection
BBa_K2656021: The original part BBa_K592101 compatible with the GoldenBraid assembly method
BBa_K2656026: the B0015 transcriptional terminator in its GoldenBraid compatible version from our Part Collection
Table 1. Parameters used to obtain the spectra
| Parameter | Value |
| Number of samples | 6 |
| Excitation Wavelength measurement range (nm) | [450-550] |
| Emission wavelenght (nm) | 580 |
| Emission Wavelength measurement range (nm) | [500-580] |
| Excitation wavelenght (nm) | 470 |
| Gain (G) | 50 |
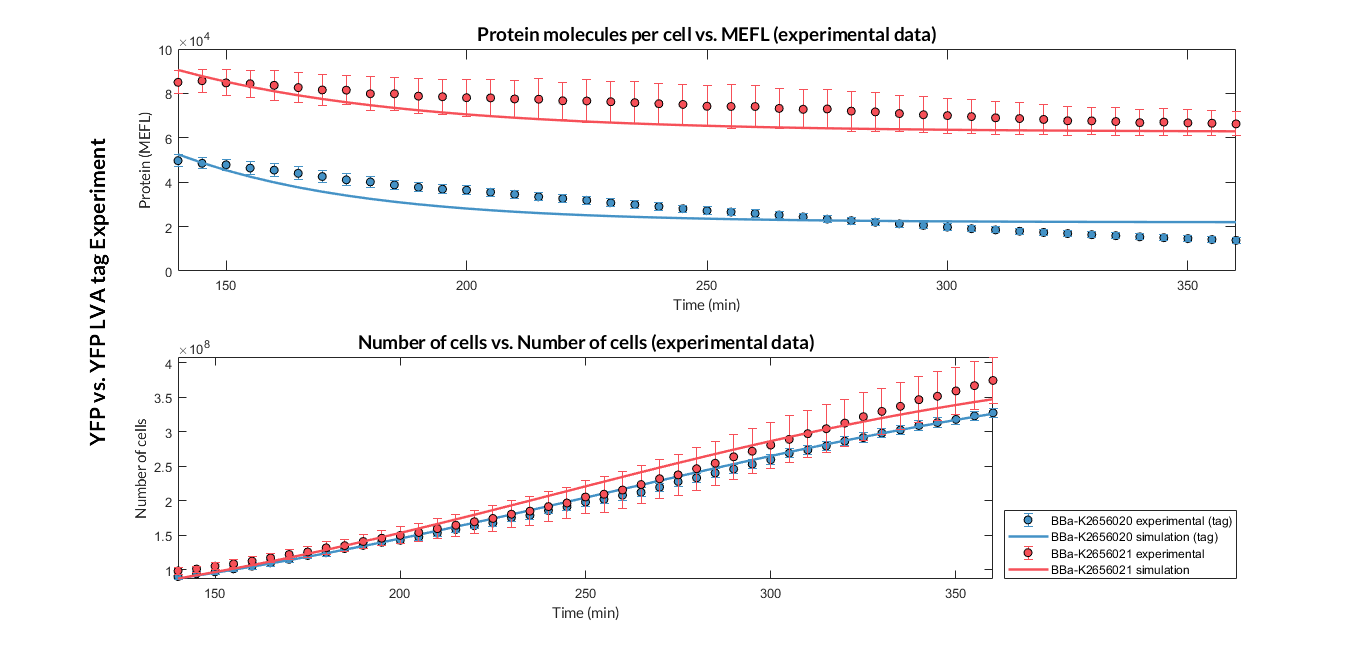
To test the effect of the degradation tag, we designed an experiment with which we measured the increase in protein degradation due to this tag. To perform this experiment, we assembled two composite parts with the same promoter, RBS and terminator:
Once the experiment was carried out, the results were plotted and Figure 3 was obtained, in which we can observe that the growth of the bacteria with both constructions was very similar, while the fluorescence had a clear variation.
These data were optimized with our model and the parameters from Table 2 were obtained. With these parameters it is possible to obtain that the degradation of the protein with the tag is around twice as much as the degradation of the protein without the tag.
Table 2. Optimized values of translation rate, degradation rate and dilution rate from experimental data
Optimized parameters |
Values |
|---|---|
Translation rate p |
|
PoI degradation rate dp |
|
Dilution rate μ |
|
Sequence and Features
- 10COMPATIBLE WITH RFC[10]
- 12COMPATIBLE WITH RFC[12]
- 21COMPATIBLE WITH RFC[21]
- 23COMPATIBLE WITH RFC[23]
- 25COMPATIBLE WITH RFC[25]
- 1000COMPATIBLE WITH RFC[1000]


