
Part:BBa_K863000
bpul (laccase from Bacillus pumilus) with T7 promoter, RBS and HIS tag
bpul (Laccase from Bacillus pumilus) with T7, RBS and HIS tag
[http://2013.igem.org/Team:TU-Munich Team TU Munich 2013] improved this part by making it compatible to RFC10 and RFC25 (see: BBa_K1159002)
(--TU Munich 19:30, 27 September 2013 (UTC))
Usage and Biology
In the last few years a lot of attention has been drawn to laccases due to their ability to oxidize both phenolic and nonphenolic lignin related compounds as well as highly recalcitrant environmental pollutants. This makes them very useful for applications concerning several biotechnological processes. This includes the detoxification of industrial effluents, for example from the paper and pulp, textile and petrochemical industries. Laccases are also valuable as a tool as a tool for medical diagnostics and as a bioremediation agent to clean up herbicides, pesticides and certain explosives in soil. Furthermore these enzymes are also used as catalysts for the manufacture of anti-cancer drugs and even as ingredients in cosmetics[1].
Their capacity to remove xenobiotic substances and produce polymeric products makes them a useful tool for bioremediation purposes. In our project laccases are used as cleaning agents for a water purification system.
Laccases are copper-containing polyphenol oxidase enzymes (EC 1.10.3.2) that can be found in many plants, insects, microorganisms and mainly in fungi. These enzymes fulfill several functions in different metabolic pathways.
Laccases are able to oxidize a broad range of substrates due to the contained copper-cluster, by reducing oxygen to water. The active site of the enzyme includes a four-copper-ion-cluster, which can be distinguished by spectroscopic analyses. This cluster consists of one blue copper-ion (type 1), one type 2 and two type 3 copper-ions. Because of the blue copper-ion, the laccases belong to the big family of the blue copper proteins. This specific blue copper ion is essential for the enzyme mediated radical oxidation of the phenolic groups. In this reaction the electron from the oxidation is transferred to the other three copper ions. These ions form a trinuclearic cluster, which transfers electrons to the terminal electron acceptor oxygen. By receiving four electrons the molecular oxygen is finally reduced to water.
[1] Susana Rodríguez Couto & José Luis Toca Herrera;Industrial and biotechnological applications of laccases: A review; 2006; Biotechnology Advances 24 500–513
Sequence and Features
- 10COMPATIBLE WITH RFC[10]
- 12COMPATIBLE WITH RFC[12]
- 21INCOMPATIBLE WITH RFC[21]Illegal BglII site found at 156
- 23COMPATIBLE WITH RFC[23]
- 25INCOMPATIBLE WITH RFC[25]Illegal NgoMIV site found at 523
Illegal NgoMIV site found at 991
Illegal AgeI site found at 279
Illegal AgeI site found at 1156 - 1000COMPATIBLE WITH RFC[1000]
First some trials of shaking flask cultivations were made with different parameters to define the best conditions for production of the His tagged CotA aus [http://www.dsmz.de/catalogues/details/culture/DSM-27.html Bacillus pumilus DSM 27 ( ATCC7061)] named BPUL. Due to inactivity of the enzyme in the cell lysate a purification method was established (using Ni-NTA-Histag resin and Syringe or ÄKTA method). The purified BPUL could be detected by SDS-PAGE (molecular weight of 58.6 kDa) as well as by MALDI-TOF. To improve the purification strategies the length of the linear elution gradient was increased up to 200 mL . The fractionated samples were also tested concerning their activity and revealed high activity. Optimal conditions for activity were identified. After measuring activity of BPUL a successful scale up was made up to 3 L and also up to 6 L that enables an intense screening afterwards. The scale up will be important for a further application.
- Allergen characterization of BBa_K863000: Not a potential allergen
The Baltimore Biocrew 2017 team discovered that proteins generated through biobrick parts can be evaluated for allergenicity. This information is important to the people using these parts in the lab, as well as when considering using the protein for mass production, or using in the environment. The allergenicity test permits a comparison between the sequences of the biobrick parts and the identified allergen proteins enlisted in a data base.The higher the similarity between the biobricks and the proteins, the more likely the biobrick is allergenic cross-reactive. In the full-length alignments by FASTA, 30% or more amount of similarity signifies that the biobrick has a Precaution Status meaning there is a potential risk with using the part. A 50% or more amount of identity signifies that the biobrick has a Possible Allergen Status. In the sliding window of 80 amino acid segments, greater than 35% signifies similarity to allergens. The percentage of similarity implies the potential of harm biobricks’ potential negative impact to exposed populations. For more information on how to assess your own biobrick part please see the “Allergenicity Testing Protocol” in the following page http://2017.igem.org/Team:Baltimore_Bio-Crew/Experiments
For the biobrick Part:BBa_K863006, there was a 0% of identity match and 0% similarity match to the top allergen in the allergen database. This means that the biobrick part is not of potential allergen status. In 80 amino acid alignments by FASTA window, no matches found that are greater than 35% for this biobrick. This also means that there is not of potential allergen status.
Contents
- 1 Usage and Biology
- 2 Cultivation, Purification and SDS-PAGE
- 2.1 Shaking Flask Cultivation
- 2.2 3 L Fermentation E. coli KRX with BBa_K863000
- 2.3 Purification of BPUL
- 2.4 SDS-PAGE of purified BPUL
- 2.5 6 L Fermentation of E. coli KRX with BBa_K863000
- 2.6 Purification of BPUL
- 2.7 SDS-PAGE of purified BPUL
- 2.8 12 L Fermentation E. coli KRX with BBa_K863000
- 2.9 Since Regionals: Purification of BPUL
- 2.10 SDS-PAGE of protein purification
- 2.11 MALDI-TOF Analysis of BPUL
- 3 Activity analysis of BPUL
- 3.1 Since Regionals: Initial activity tests of purified fractions
- 3.2 BPUL CuCl2 concentration
- 3.3 BPUL activity depending on different ABTS concentrations
- 3.4 Impact of MeOH and acteonitrile on BPUL
- 3.5 Since Regionals: Searching for substrate saturation ofBPUL
- 3.6 Since Regionals: BPUL pH optimum
- 3.7 Since Regionals: BPUL activity at different temperatures
- 4 Substrate Analysis
- 5 Immobilization
- 6 Expression under different conditions (2019 PuiChing_Macau)
- 7 Dye Decolorization (2019 PuiChing_Macau)
- 8 Endocrine Disrupting Chemical(EDC) Degradation (2019 PuiChing_Macau)
- 9 Team University of Edinburgh 2019
- 10 Assays to study Induction and secretion (2019 SNU_India)
- 11 Structural analysis by homology modelling and Docking(2019 SNU_India)
Cultivation, Purification and SDS-PAGE
Shaking Flask Cultivation
The first trials to produce the CotA-laccase from [http://www.dsmz.de/catalogues/details/culture/DSM-27.html Bacillus pumilus DSM 27] (ATCC7061, named BPUL) were performed in shaking flasks with various designs (from 100 mL-1 to 1 L flasks, with and without baffles) and under different conditions. The parameters tested during the screening experiments were temperature (27 °C,30 °C and 37 °C), the concentration of chloramphenicol (20 to 170 µg mL-1), induction strategy ([http://2012.igem.org/Team:Bielefeld-Germany/Protocols/Materials#Autoinduction_medium autoinduction] and manual induction with 0,1 % rhamnose) and cultivation time (6 to 24 h). Furthermore it was cultivated with and without 0.25 mM CuCl2, to provide a sufficient amount of copper, which is needed for the active center of the laccase. Based on the screening experiments the best conditions for expression of BPUL were identified(see below). The addition of CuCl2 did not increase activity, so it was omitted.
- flask design: shaking flask without baffles
- medium: [http://2012.igem.org/Team:Bielefeld-Germany/Protocols/Materials#Autoinduction_medium autoinduction medium]
- antibiotics: 60 µg mL-1 chloramphenicol
- temperature: 37 °C
- cultivation time: 12 h
The reproducibility of the measured data and results were investigated for the shaking flask and bioreactor cultivation.
3 L Fermentation E. coli KRX with BBa_K863000

After the measurement of BPUL activity we made a scale-up and fermented E. coli KRX with BBa_K863000 in a[http://2012.igem.org/Team:Bielefeld-Germany/Protocols/Materials#Biostat_B_Bioreactor_.283_L.29_by_Braun Braun Biostat B] fermenter with a total volume of 3 L. Agitation speed, pO2 and OD600 were determined and illustrated in Figure 1. We got a long lag phase of 2 hours due to a relatively old preculture. The cell growth caused a decrease in pO2 and after 3 hours the value fell below 50 %, so that the agitation speed increased automatically. After 8.5 hours the deceleration phase started and therefore the agitation speed was decreased. The maximal OD600 of 3.53 was reached after 10 hours, which means a decrease in comparison to the fermentation of E. coli KRX under the same conditions (OD600,max =4.86 after 8.5 hours, time shift due to long lag phase). The cells were harvested after 11 hours.
Purification of BPUL
The harvested cells were resuspended in [http://2012.igem.org/wiki/index.php?title=Team:Bielefeld-Germany/Protocols/Materials#Buffers_for_His-Tag_affinity_chromatography Ni-NTA-equilibrationbuffer], mechanically lysed by [http://2012.igem.org/Team:Bielefeld-Germany/Protocols/Production#Mechanical_lysis_of_the_.28bio-reactor.29_cultivation homogenization] and cell debris were removed by centrifugation. The supernatant of the lysed cell paste was loaded on the Ni-NTA-column (15 mL Ni-NTA resin) with a flowrate of 1 mL min-1 cm-2. The column was washed with 10 column volumes (CV) Ni-NTA-equilibrationbuffer. The bound proteins were eluted by an increasing Ni-NTA-elutionbuffer gradient from 0 % to 100 % with a total volume of 100 mL and the elution was collected in 10 mL fractions. Due to the high UV-detection signal of the loaded samples and to simplify the illustration of the detected product peak only the UV-detection signal of the wash step and the elution are shown. A typical chromatogram of purified laccases is illustrated here. The chromatogram of the BPUL-elution is shown in Figure 2:

The chromatogram shows a remarkable widespread peak between the process volume of 460 mL to 480 mL with the highest UV-detection signal of 69 mAU, which can be explained by the elution of bound proteins. The corresponding fractions were analyzed by SDS-PAGE analysis. During the elution, a steady increase of the UV-signal caused by the increasing imidazol concentration during the elution gradient. Between the process volume of 550 and 580 mL there are several peaks (up to a UV-detection-signal of 980 mAU) detectable. These results are caused by an accidental detachment in front of the UV-detector. Just to be on the safe side, the corresponding fractions were analyzed by SDS-PAGE analysis. The corresponding SDS-PAGE is shown in Figure 3.
SDS-PAGE of purified BPUL

Figure 3 shows the purified ECOL including flow-through, wash and the elution fractions 7 and 8. These two fractions were chosen due to a high peak in the chromatogram. BPUL has a molecular weight of 58.6 kDA and was marked with a red arrow. The band appears in both fractions. There are also some other non-specific bands, which could not be identified. To improve the purification the elution gradient length should be longer and slower the next time.
The appearing bands were analyzed by MALDI-TOF and could be identified as CotA (BPUL).
6 L Fermentation of E. coli KRX with BBa_K863000

Another scale-up for E. coli KRX with BBa_K863000 was made up to a final working volume of 6 L in a Bioengineering NFL22. Agitation speed, pO2 and OD600 were determined and illustrated in Figure 4. There was no noticeable lag phase. Agitation speed was increased up to 425 rpm after one hour due to problems caused by the control panel. The pO2 decreased until a cultivation time of 4.75 hours. The increasing pO2 level indicates the beginning of the deceleration phase. There is no visible break in cell growth caused by an induction of protein expression. A maximal OD600 of 3.68 was reached after 8 hours of cultivation, which is similar to the 3 L fermentation (OD600 = 3.58 after 10 hours, time shift due to long lag phase). The cells were harvested after 12 hours.
Purification of BPUL
The harvested cells were prepared in [http://2012.igem.org/wiki/index.php?title=Team:Bielefeld-Germany/Protocols/Materials#Buffers_for_His-Tag_affinity_chromatography Ni-NTA-equilibrationbuffer], mechanically lysed by [http://2012.igem.org/Team:Bielefeld-Germany/Protocols/Production#Mechanical_lysis_of_the_.28bio-reactor.29_cultivation homogenization] and cell debris were removed by centrifugation. The supernatant of the lysed cell paste was loaded on the Ni-NTA-column (15 mL Ni-NTA resin) with a flow rate of 1 mL min-1 cm-2. The column was washed with 5 column volumes (CV) [http://2012.igem.org/wiki/index.php?title=Team:Bielefeld-Germany/Protocols/Materials#Buffers_for_His-Tag_affinity_chromatography Ni-NTA-equilibrationbuffer]. The bound proteins were eluted by an increasing elutionbuffer gradient from 0 % (equates to 20 mM imidazol) to 100 % (equates to 500 mM imidazol) with a length of 200 mL. This strategy was chosen to improve the purification by a slower increase of [http://2012.igem.org/wiki/index.php?title=Team:Bielefeld-Germany/Protocols/Materials#Buffers_for_His-Tag_affinity_chromatography Ni-NTA-elutionbuffer] concentration. The elution was collected in 10 mL fractions. Due to the high UV-detection signal of the loaded samples and to simplify the illustration of the detected product peak only the UV-detection signal of the wash step and the elution are shown. A typical chromatogram of purified laccases is illustrated here. The chromatogram of the BPUL elution is shown in Figure 5.

The chromatogram shows a peak at the beginning of the elution. This can be explained by pressure fluctuations upon starting the elution procedure. In between the processing volumes of 832 mL and 900 mL there is remarkable widespread peak with a UV-detection signal of 115 mAU. This peak corresponds to an elution of bound proteins at a [http://2012.igem.org/wiki/index.php?title=Team:Bielefeld-Germany/Protocols/Materials#Buffers_for_His-Tag_affinity_chromatography Ni-NTA elution buffer] concentration between 10 % and 20 % (equates to 50-100 mM imidazol). The corresponding fractions were analyzed by SDS-PAGE. The ensuing upwards trend of the UV-signal is caused by the increasing imidazol concentration during the elution gradient. Towards the end of the elution procedure there is a constant UV-detection signal, which shows, that most of the bound proteins was already eluted. Just to be on the safe side, all fractions were analyzed by SDS-PAGE to detect BPUL. The SDS-PAGE is shown in Figure 6.
SDS-PAGE of purified BPUL

In Figure 6 the SDS-PAGE of the Ni-NTA purification of the lysed E. coli KRX culture containing BBa_K863000 is illustrated. It shows the flow-through, wash and elution fractions 1 to 9. The His-tagged BPUL has a molecular weight of 58.6 kDA and was marked with a red arrow. The band appears in all fractions from 2 to 9 with varying strength, the strongest ones in fractions 7 to 9. There are also some other non-specific bands, which could not be identified. Therefore the purification method could moreover be improved. In summary, the scale up was successful, improving protein production and purification method once again.
Furthermore the bands were analyzed by MALDI-TOF and identified as CotA (BPUL).
12 L Fermentation E. coli KRX with BBa_K863000

Finally another scale-up was made and E. coli KRX with BBa_K863000 was fermented in a Bioengineering NLF 22 fermenter with a total volume of 12 L to produce a high amount of the enzyme for further characterizations. This time [http://2012.igem.org/Team:Bielefeld-Germany/Protocols/Materials#HSG_Autoinduction_medium HSG autoinduction medium] was used to get a higher biomass. Agitation speed, pO2 and OD600 were determined and the glycerin concentration of the samples analyzed. The data are illustrated in Figure 7. At the beginning of the cultivation, the cells were in lag phase, in which they adapt to the medium. During their growth the cells consumed glycerin as well as O2, which leads to an increase of agitation speed to hold a minimal pO2 of 50 %. After 11 hours, the glycerin was completely consumed and the pO2 increased up to 100 %, which indicates that the cells entered the stationary phase. The maximal OD600 of 12.6 was reached after 12 hours of cultivation. The cells were harvested after 19 hours of cultivation.
Since Regionals: Purification of BPUL
The harvested cells were resuspended in [http://2012.igem.org/wiki/index.php?title=Team:Bielefeld-Germany/Protocols/Materials#Buffers_for_His-Tag_affinity_chromatography Ni-NTA- equilibration buffer], mechanically disrupted by [http://2012.igem.org/Team:Bielefeld-Germany/Protocols/Production#Mechanical_lysis_of_the_.28bio-reactor.29_cultivation homogenization] and cell debris were removed by centrifugation, microfiltration as well as diafiltration to concentrate the protein concentration in the cell lysate solution. This solution of the cell lysate was loaded on the Ni-NTA column (15 mL Ni-NTA resin) with a flow rate of 1 mL min-1 cm-2. Then the column was washed with 10 column volumes (CV) [http://2012.igem.org/wiki/index.php?title=Team:Bielefeld-Germany/Protocols/Materials#Buffers_for_His-Tag_affinity_chromatography Ni-NTA equilibration buffer]. The bound proteins were eluted by an increasing [http://2012.igem.org/wiki/index.php?title=Team:Bielefeld-Germany/Protocols/Materials#Buffers_for_His-Tag_affinity_chromatography Ni-NTA elution buffer] step elution from 5 % (equates to 25 mM imidazol) with a length of 50 mL, to 50 % (equates to 250 mM imidazol) with a length of 70 mL, to 80 % (equates to 400 mM imidazol) and finally to 100 % (equates to 500 mM imidazol) with a length of 100 mL. This strategy was chosen to improve the purification caused by a step by step increasing Ni-NTA-elution buffer concentration. The elution was collected in 10 mL fractions. A typical chromatogram of purified laccases is illustrated here. Unfortunately, the data of this procedure are not available due to a computer crash after the purification step. All Fractions were analysed to detect BPUL.
SDS-PAGE of protein purification

In Figure 8 the SDS-PAGE of the Ni-NTA purification of the lysed E.coli KRX culture containing BBa_K863000 is illustrated. It shows the permeate and retentate of microfiltration and diafiltration respectively, several fractions of flow-through, wash and the elutions with different buffer concentrations respectively. The selected samples were taken where peaks were seen in the chromatogram. The His-tagged BPUL has a molecular weight of 58.6 kDa. BPUL could not be attributed exactly to any band. There are some other non-specific bands, wich could not be identified because the MALDI was broken-down for the last two weeks.
MALDI-TOF Analysis of BPUL
The E. coli laccase was identified using the following software
- FlexControl
- Flexanalysis and
- Biotools
from Brunker Daltronics.
The peptid mass fingerprints were compared with the measured fingerprint gotten from the Maldi. With a sequence coverage of 21,9% BPUL was identified.
In Figure 9 and 10 the chromatogram of the peptide mass fingerprint and the single masses is shown.


Activity analysis of BPUL
Since Regionals: Initial activity tests of purified fractions
After the Regional Jamboree in Amsterdam further BPUL was produced. The most comprising fractions of the purification were analyzed for [http://2012.igem.org/Team:Bielefeld-Germany/Amsterdam/Labjournal#Tuesday_October_16th/ protein content] (10/16), re-buffered into deionized H2O and incubated in 0.4 mM CuCl2. Again, the [http://2012.igem.org/Team:Bielefeld-Germany/Amsterdam/Labjournal#Wednesday_October_17th/ protein content] (10/17) of each fraction was determined because of the loss of proteins through re-buffering. Initial activity tests were done in Britton-Robinson buffer with 0.1 mM ABTS. The protein content of each fraction was adjusted for comparison of the resulting activity (see Fig. 11).

Fraction 50% 2 showed the highest activity. The first number indicates the percentage of used elution buffer, whereas the second number stands for the fraction number of this elution. The saturation was reached at ~1 h. For comparison it was stated that this fraction contains 90 % laccase and therefore the BPUL concentration is 25,1 µg mL-1.
BPUL CuCl2 concentration
Another test of BPUL was done to survey the best CuCl2 concentration for the activity of the purified BPUL laccase. 0.03 mg mL-1 of protein were incubated with different CuCl2 concentrations ranging from 0 to 0.7 mM CuCl2. Activity tests were performed with the incubated samples, 0.1 mM ABTS and 100 mM sodium actetate buffer (pH 5) to a final volume of 200 µL. The reactivity was measured at 420 nm, 25°C and over a time period of 5 hours. As expected the saturation takes place after 3 hours (see Figure 12). The differences in the activity of BPUL laccases incubated in different CuCl2 differ minimal. The highest activity of BPUL laccase is observed after incubation with 0.6 mM CuCl2 (52% of added ABTS). With a higher concentration of 0.7 mM CuCl2 the activity seems to be reduced (only 48% ABTS got oxidized). This leads to the assumption that CuCl2 supports the BPUL laccase reactivity but concentrations exceeding this value of CuCl2 may have a negative impact on the ability of oxidizing ABTS. This fits the expectations as laccases are copper reliant enzymes and gain their activity through the incorporation of copper. Additionally negative controls were done using the tested concentrations of CuCl2 without applying laccase to detect the oxidization of ABTS through copper (see Figure 13). The more CuCl2 was present, the more ABTS was oxidzied after 5 hours. Still the maximal change accounts only for ~6% oxidized ABTS after 5 hours.


In relation to apply the laccase in waste water treatment plants it is beneficial knowing, that small amounts of CuCl2 are enough to activate the enzyme. Still it is expensive to be reliant on CuCl2 and a potential risk using heavy metals for waste water purifcation.
BPUL activity depending on different ABTS concentrations

Furthermore, BPUL laccase were tested using different amounts of ABTS to calculate KM and Kcat values. The same measurement setup as described above was used only with different amounts of ABTS. As anticipated, the amount of oxidized ABTS increased in dependence of the amount of ABTS used (Figure 14). Especially using 16 µL showed an increase in the activity until 1 hour (reaching 50 µM ABTSox), but the amount of oxidized ABTS decreased afterward.
Impact of MeOH and acteonitrile on BPUL
For substrate analytic tests the influence of MeOH and acetonitrile on BPUL laccases had to be determined, because substrates have to be dissolved in these reagents. The experiment setup included 0.03 mg mL-1 BPUL laccase, different amounts of MeOH (Figure 15) or acteonitrile (Figure 16), 0.1 mM ABTS and 100 mM sodium actetate buffer to a final volume of 200 µL. The observed reactivity of BPUL in regard of oxidizing ABTS did not reveal a huge decrease. The less MeOH or acetonitrile was used, the higher was the amount of oxidized ABTS after 3 hours. An application of 16 µL MeOH or acetonitrile led to a decrease of maximal 10% oxidized ABTS compared to 2 µL MeOH or acetonitrile. Negative controls are shown in [http://2012.igem.org/Team:Bielefeld-Germany/Results/coli#Impact_of_MeOH_and_acetonitrile_on_ECOL Figure 20 and 21] of the ECOL laccase. MeOH and acetonitril are able to oxidize ABTS. After 5 hours at 25°C ~15 µM ABTS get oxidized through MeOH or acetonitrile, but samples with BPUL laccase show a distinct higher activity of 50 µM ABTSox.


Since Regionals: Searching for substrate saturation ofBPUL
In order to find the substrate saturation, laccase activity was measured with ABTS concentrations ranging from 0.1 mM to 8 mM. 616 ng BPUL were used for measurements with ABTS concentrations of 0.1 mM to 5 mM, 308 ng BPUL were used for measurements with ABTS concentrations of 5 mM to 8 mM. Measurements were done in Britton-Robinson buffer (pH 5) at 25 °C for 30 minutes taking the OD420 every 5 minutes. Comparing the graphs in Figure 17 and Figure 18, both show a comprising substrate saturation with 5 mM ABTS. Higher concentrations of ABTS than 5 mM did not show any other effects on the activity of BPUL. For all following BPUL activity measurements after the Regional Jamborees in Amsterdam a concentration of 5 mM ABTS was applied.


Since Regionals: BPUL pH optimum

The pH of the medium containing the enzyme is of high importance for its activity. The pH optima of BPUL are pH 4 and pH 5. This is the result of activity measurements using Britton-Robinson buffer with differently adjusted pHs. BPUL was re-buffered into H2O and incubated with 0.4 mM CuCl2. The range from pH 4 to pH 9 was tested under substrate saturation at 25 °C for 30 minutes. At pH 4 and pH 5 ABTS got oxidized the fastest (see Fig. 19 and Fig. 20). At higher pHs than pH 5, the activity of BPUL was decreased considerably. The resulting Units mg-1 support the observed data (see Fig. 21). At pH 4 and pH 5 BPUL showed a specific enzyme activity of ~37 U mg-1. The higher the pH, the less U mg-1 could be calculated for BPUL. At pH 7 1/3 of the activity decreased, but still BPUL was active at this pH allowing an application of this laccase in a waste water treatment plant where the average pH is a pH of 6.9.


Since Regionals: BPUL activity at different temperatures


To investigate the activity of BPUL at temperatures that will apply at a waste water treatment plant throughout the year, activity tests were performed at 10 °C and 25 °C as described above. The obtained results reveal a comparable activity of BPUL at high and low temperatures (see Fig. 22). The measurements were conducted for 30 minutes until saturation initiated. Both samples reached saturation after 15-20 minutes. The obtained results were used to calculate the specific enzyme activity which was in both cases at about 37 U mg-1 (see Fig. 23). The negative control without BPUL laccase but 0.4 mM CuCl2 at 10 °C and 25 °C show a negligible oxidation of ABTS. The observed activity at both conditions was good news for the possible application in waste water treatment plants where the temperature differs from 8.1 °C to 20.8 °C.
Substrate Analysis
The measurements were made to test if the produced laccases were able to degrade different hormones. Therefore the produced laccases were inserted in the same concentrations (3 µg mL-1) to the different measurement approaches. To work with the correct pH value (which were measured by the Team Activity Test) Britton Robinson buffer at pH 5 was used for all measurements. The initial substrate concentration was 5 µg mL-1. The results of the reactions without ABTS are shown in Figure 24. On the Y-axis the percentages of degraded estradiol (blue) and ethinyl estradiol (red) are indicated. The X-axis displays the different tested laccases. The degradation was measured at t0 and after five hours of incubation at 30 °C. The negative control was the substrate in Britton Robinson buffer and showed no degradation of the substrates. The bought laccase TVEL0 which is used as positive control is able to degrade 94.7 % estradiol and 92.7 % ethinyl estradiol. The laccase BPUL (from Bacillus pumilus) degraded 35.9 % of used estradiol after five hours. ECOL was able to degrade 16.8 % estradiol. BHAL degraded 30.2 % estradiol. The best results were determined with TTHL (laccase from Thermus thermophilus). Here the percentage of degradation amounted 55.4 %.
The results of the reactions of the laccases with addition of ABTS are shown in Figure 25. The experimental set ups were the same as the reaction approach without ABTS described above. The X-axis displays the different tested laccases. On the Y-axis the percentages of degraded estradiol (blue) and ethinyl estradiol (red) are shown. The degradation was measured at t0 and after five hours of incubation at 20 °C. The negative control showed no degradation of estradiol. 6.8 % of ethinyl estradiol was decayed. The positive control TVEL0 is able to degrade 100 % estradiol and ethinyl estradiol. The laccase BPUL (from Bacillus pumilus) degraded 46.9 % of used estradiol after ten minutes incubation. ECOL was able to degrade 6.7 % estradiol. BHAL degraded 46.9 % estradiol. With TTHL (laccase from Thermus thermophilus)a degradation 29.5 % were determined.


Immobilization

Figure 26 shows the percentage of laccases bound after incubation with CPC-beads, relative to the original concentration. The concentration of laccases in the supernatant after incubation was measured using Roti®-Nanoquant. The results showed that only 3% of BPUL laccases was still present in the supernatant. This illustrates that BPUL was successfully immobilized on the CPC-beads.

In figure 27, the enzymatic activity of BPUL in the supernatant is compared to the activity of nontreated BPUL. Although an activity can already be detected in the supernatant, this activity is low compared to the original.

Figure 28 shows the illustration of ABTS oxidation by BPUL with time compared to the negative control. The increase in ABTS oxidized proves laccase activity even if a direct comparison with the original and not immobilized laccase solution was not possible due to the very high activity of BPUL, which could not be measured properly.
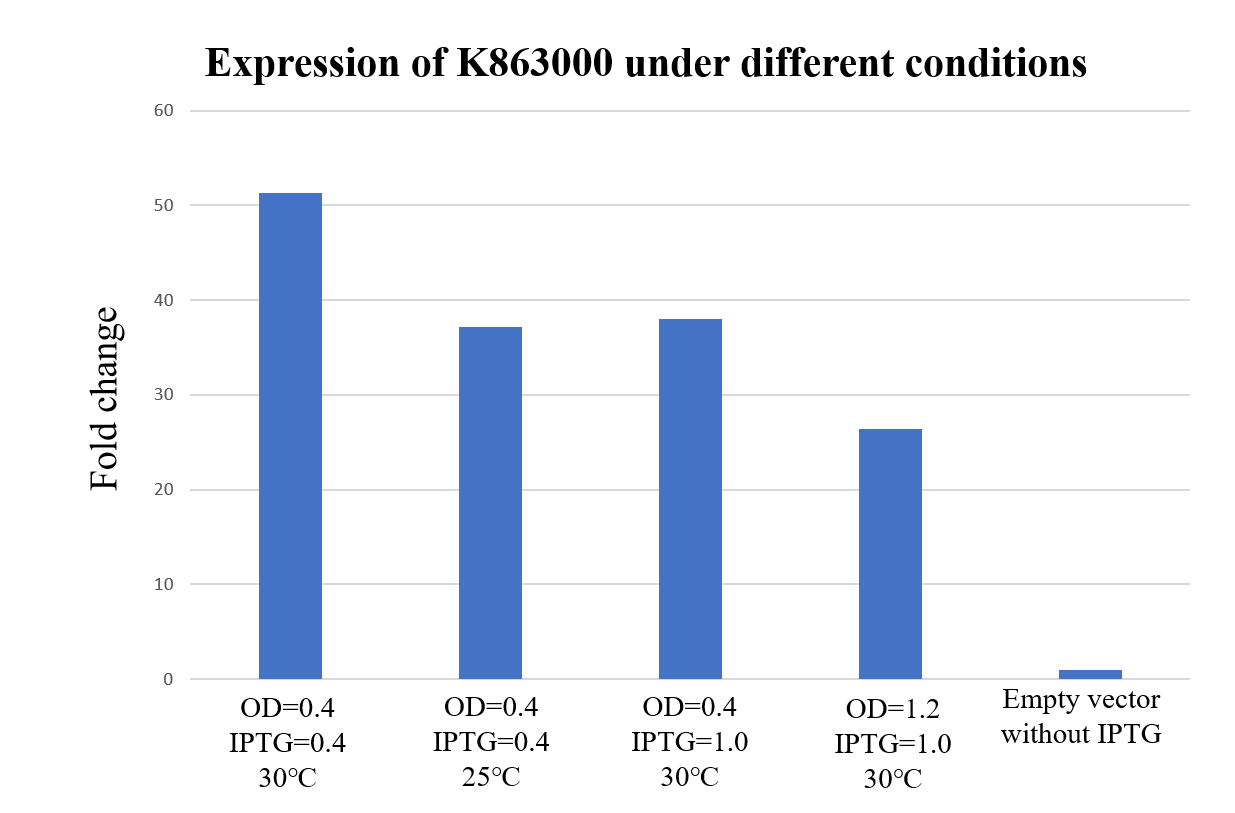
Expression under different conditions (2019 PuiChing_Macau)
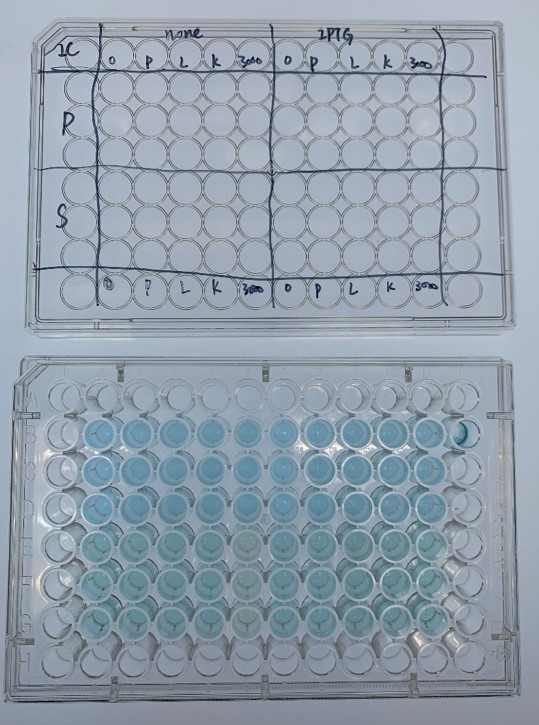
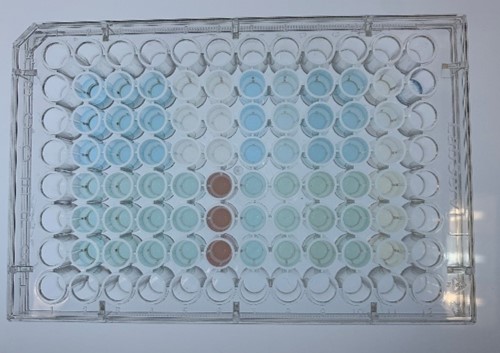
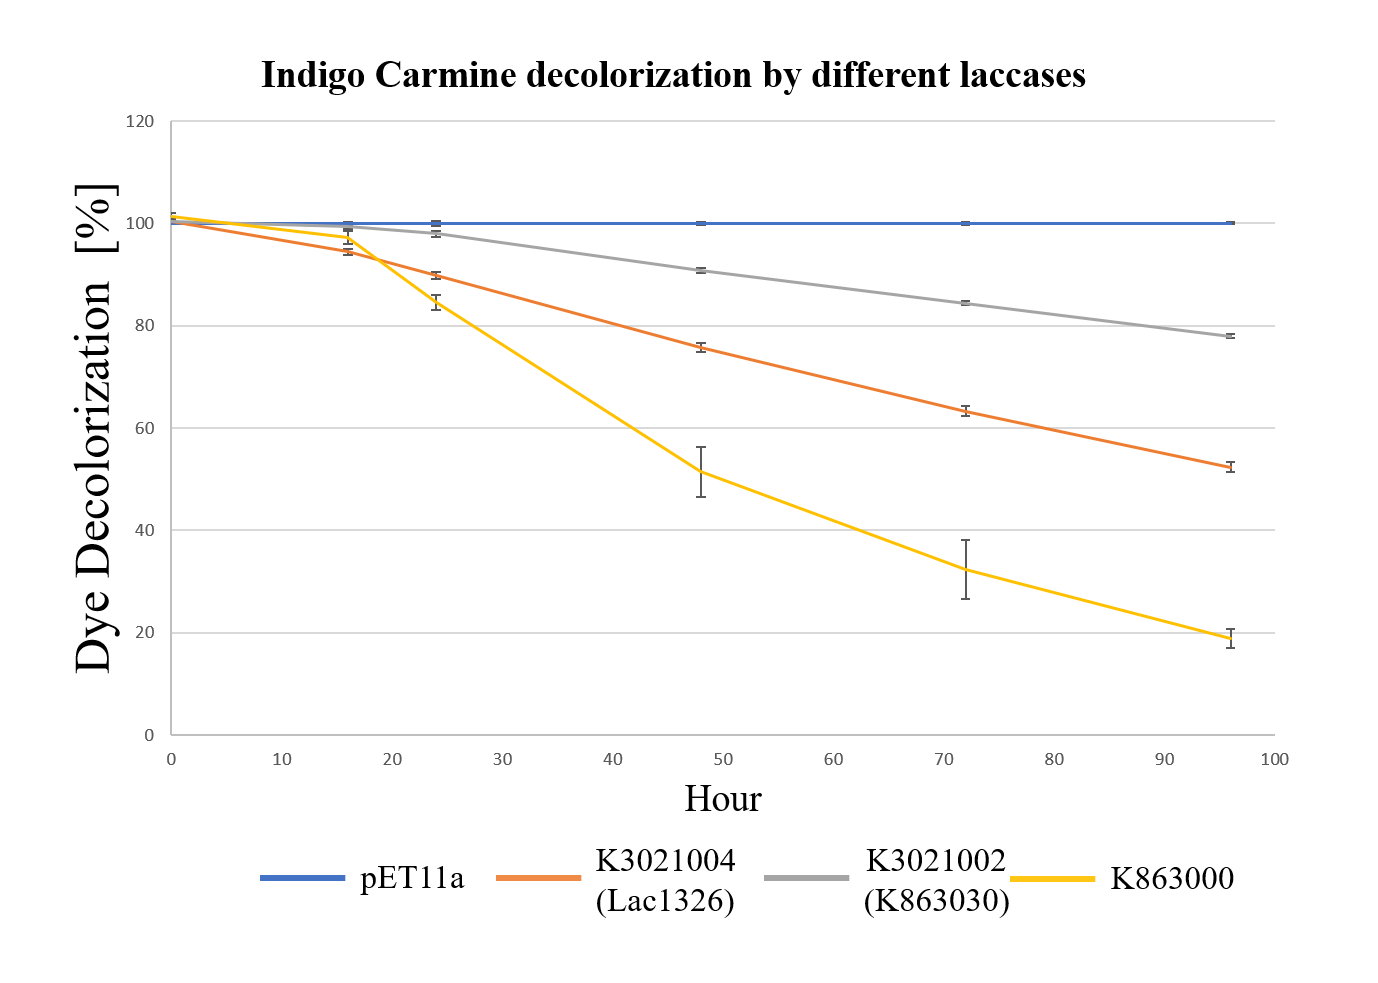
Dye Decolorization (2019 PuiChing_Macau)
Endocrine Disrupting Chemical(EDC) Degradation (2019 PuiChing_Macau)
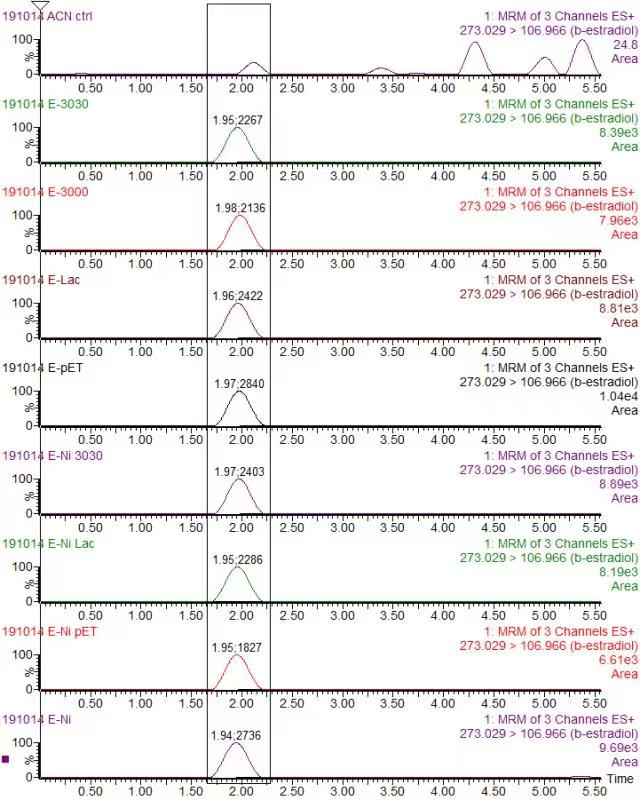
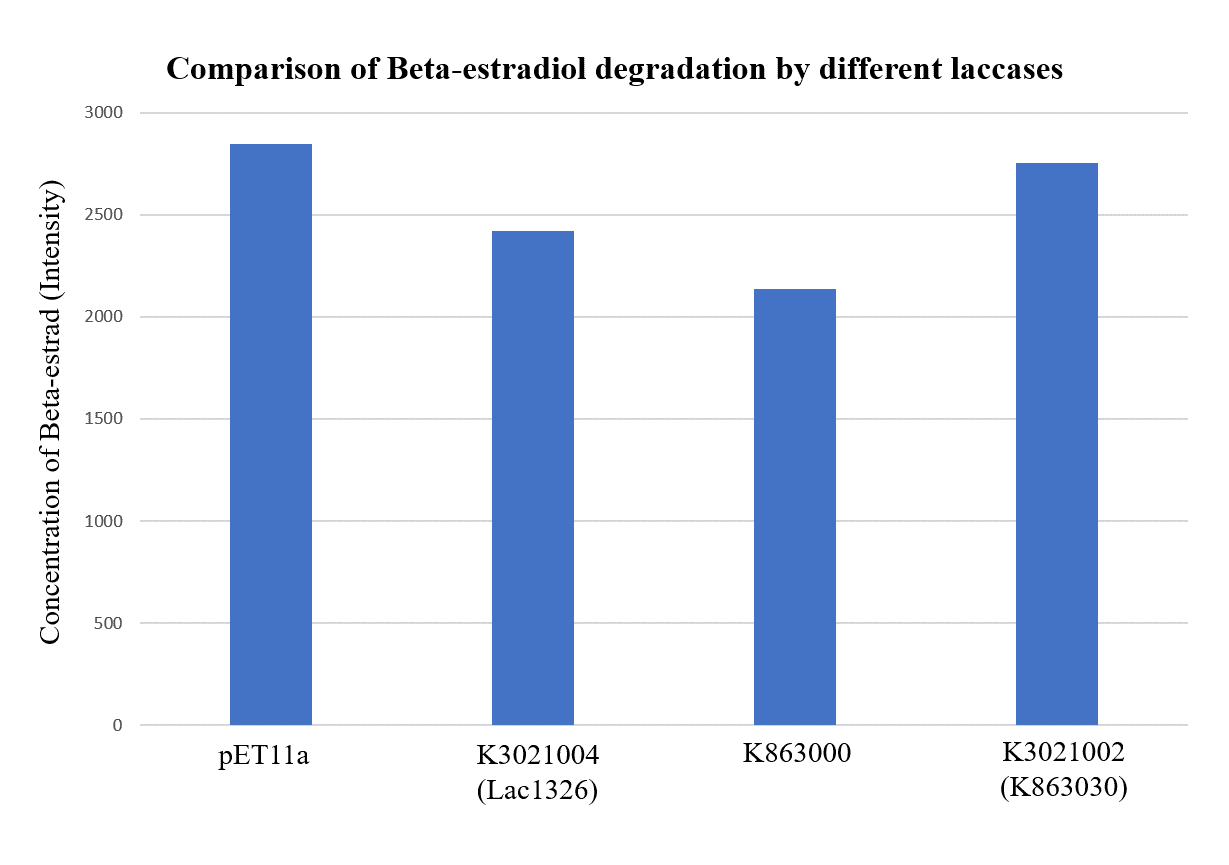
In order to validate our concept of using laccases to degrade Endocrine Disrupting Chemicals, biodegradation test were conducted. We used beta-estradiol (one of the EDCs) as our the target substrate. After incubation of laccases with beta-estradiol, we analyzed the amount beta-estradiol with Liquid Chromatography-Mass Spectrometry.
As shown in Figure 9 and Figure 10, the concentration of beta-estradiol decreased after treatment with K3021004 (wiht Lac1326 laccase), K863000 and K3021002 (with K863030 laccase) proteins, compared with pET-11a (empty vector), which successfully demonstrated our concept of utilizing K3021004 (with Lac1326 laccase) for EDC degradation. Among all of the laccases, K863000 and K3021004 (with Lac1326 laccase) had respectively displayed the lowest and second lowest intensity of 2137.657 and 2421.598, signifying K863000 possesses the highest biodegradation activity of all.
Moreover, we found that the results of dye decolorization and EDC degradation are consistent. Protein K863000 has the highest laccase activity, followed by K3021004 (wiht Lac1326 laccase) (OD0.4, IPTG=0.4mM, 25℃;) and then K3021002 (with K863030 laccase).
Team University of Edinburgh 2019
Group: University of Edinburgh OG, 2019
Author: Cathal O’Reilly
Summary: The Bpul laccase (BBa_k863000) in a pSB1C3 plasmid backbone was expressed in BL21 (DE3) E. coli cells. An SDS-PAGE was used to find where the protein was being expressed. This information was used to choose the correct sample to use for protein purification. His-tag purification was used to purify the protein. Bradford and ABTS assays were used to find if the protein had been purified as well as its concentration and activity.
MethodsBpul expression and purification. BL21 (DE3) Cells carrying Bpul were cultured and the expression of Bpul laccase was induced as described in Laccase Induction & Solubility Test protocol. An SDS-PAGE, also using this protocol. was used to find where the protein was being expressed. The gel showed the Bpul remained within the cell correct sample to use for protein purification. The Bpul laccase was then purified through its 6xHis-tag as described in his-tag purification protocol.
Results
The SDS-PAGE results (figure 1) show a very faint band around 58.6 kDa in the induced cell lysate. The band appeared clearer in person however the image quality fades it. This band would indicate that the Bpul enzyme is not extracellular. This may be due to it being expressed in gram negative (E. coli) rather than its original gram positive (B. pumilus) host. This sample was used for the enzyme purification step which verifies that the enzyme is intracellular within E. coli.

We successfully expressed and purified Bpul laccase. We were then able to characterize its thermostability and activity at different temperatures by carrying out an ABTS assay at different temperatures (figure 2). This graph shows that not only is the enzyme able to function at these temperatures but also has an increased activity.

Assays to study Induction and secretion (2019 SNU_India)


 ">
">


