Part:BBa_K864100
Super Yellow Fluorescent Protein 2 (SYFP2)
This part codes for the bright yellow fluorescent protein SYFP2. SYFP2 is a GFP based monomeric protein with optimized folding, maturation and a narrow fluorescence emission spectrum with a maximum of 515 nm. Bacteria expressing SYFP2 are reported to be 12 times brighter than those expressing EYFP(Q69K) and almost 2-fold brighter than bacteria expressing Venus (Kremer et al 2006). Mutations compared to wtGFP amino acid sequence (GenBank Accession number M62653) are F46L F64L S65G S72A M153T V163A S175G T203Y A206K. See the article listed in references. The sequence has been codon optimized for expression in E coli by DNA 2.0.
Kremers et al reported the following data:
Excitation peak: 515 nm. Emission peak: 527 nm. Relative brightness to EYFP2(Q96K) in E coli: 12.0. Extinction Coefficient (M-1 cm-1): 101000. Quantum Yield: 0.68.
Usage and Biology
This part is useful as a reporter.
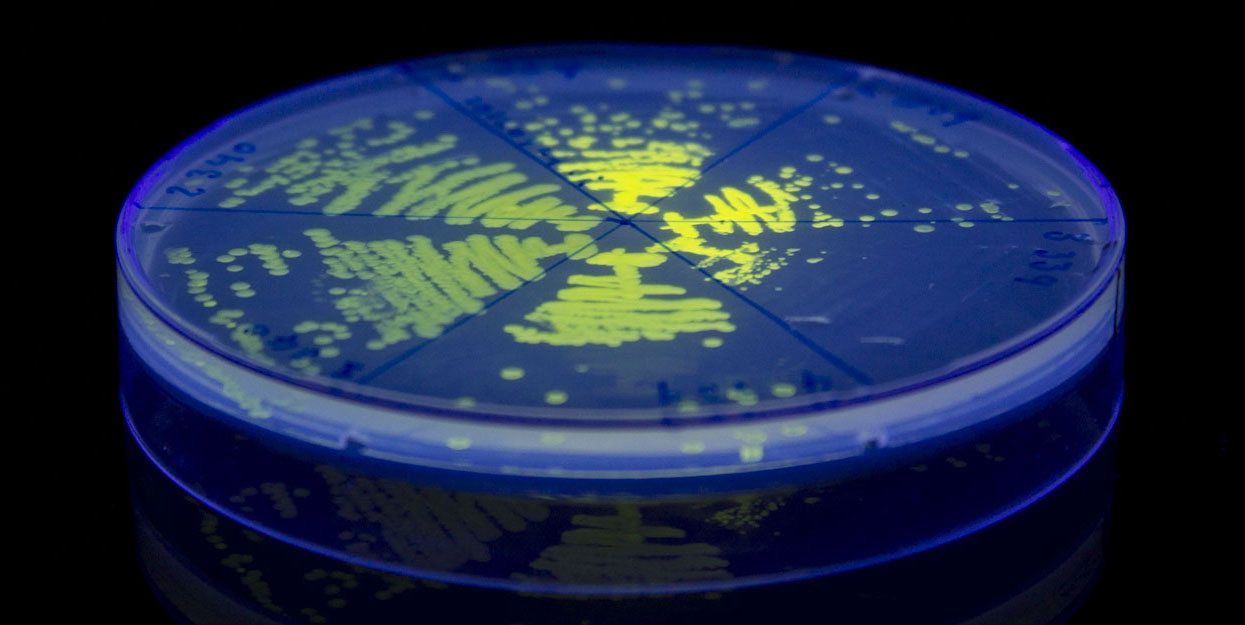
iGEM12_Uppsala_University. Fluorescence on UV table. The images above show E coli constitutively expressing SYFP BBa_K864100 using promoters with different strengths.
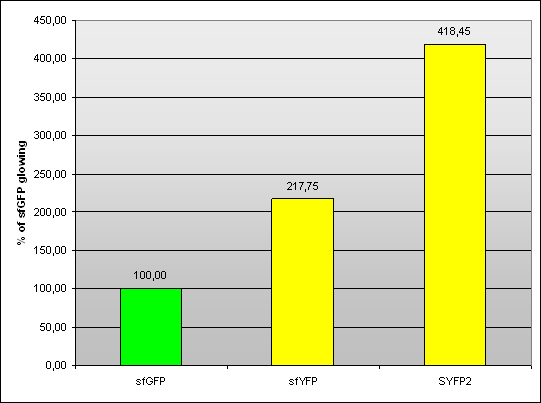
Team Warsaw 2013 designed sfYFP and compared it to SYFP2. Measurment was conducted on pSB1A3 plasmid with J23100 promoter and B0034 RBS in living cells in RF.
Fig 1. – Fluorescence of sfYFP and SYFP2 compared to sfGFP (BBa_I746908).
| - | Samples | Arithmetic mean | Standard deviation | ||
|---|---|---|---|---|---|
| sfGFP | 100,60 | 100,37 | 99,02 | 100,00 | 0,85 |
| sfYFP | 218,87 | 216,51 | 217,87 | 217,75 | 1,19 |
| SYFP2 | 424,70 | 418,26 | 412,40 | 418,45 | 6,15 |
Tab 1. – Fluorescence of sfYFP and SYFP2 compared to sfGFP (BBa_I746908).
R9-SYFP2-H6 Improvement by iGEM UCopenhagen 2017
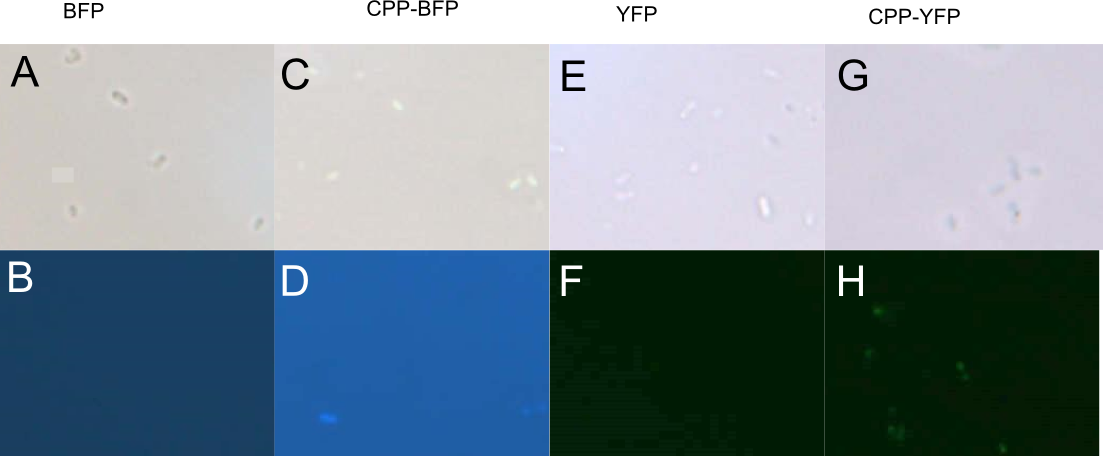
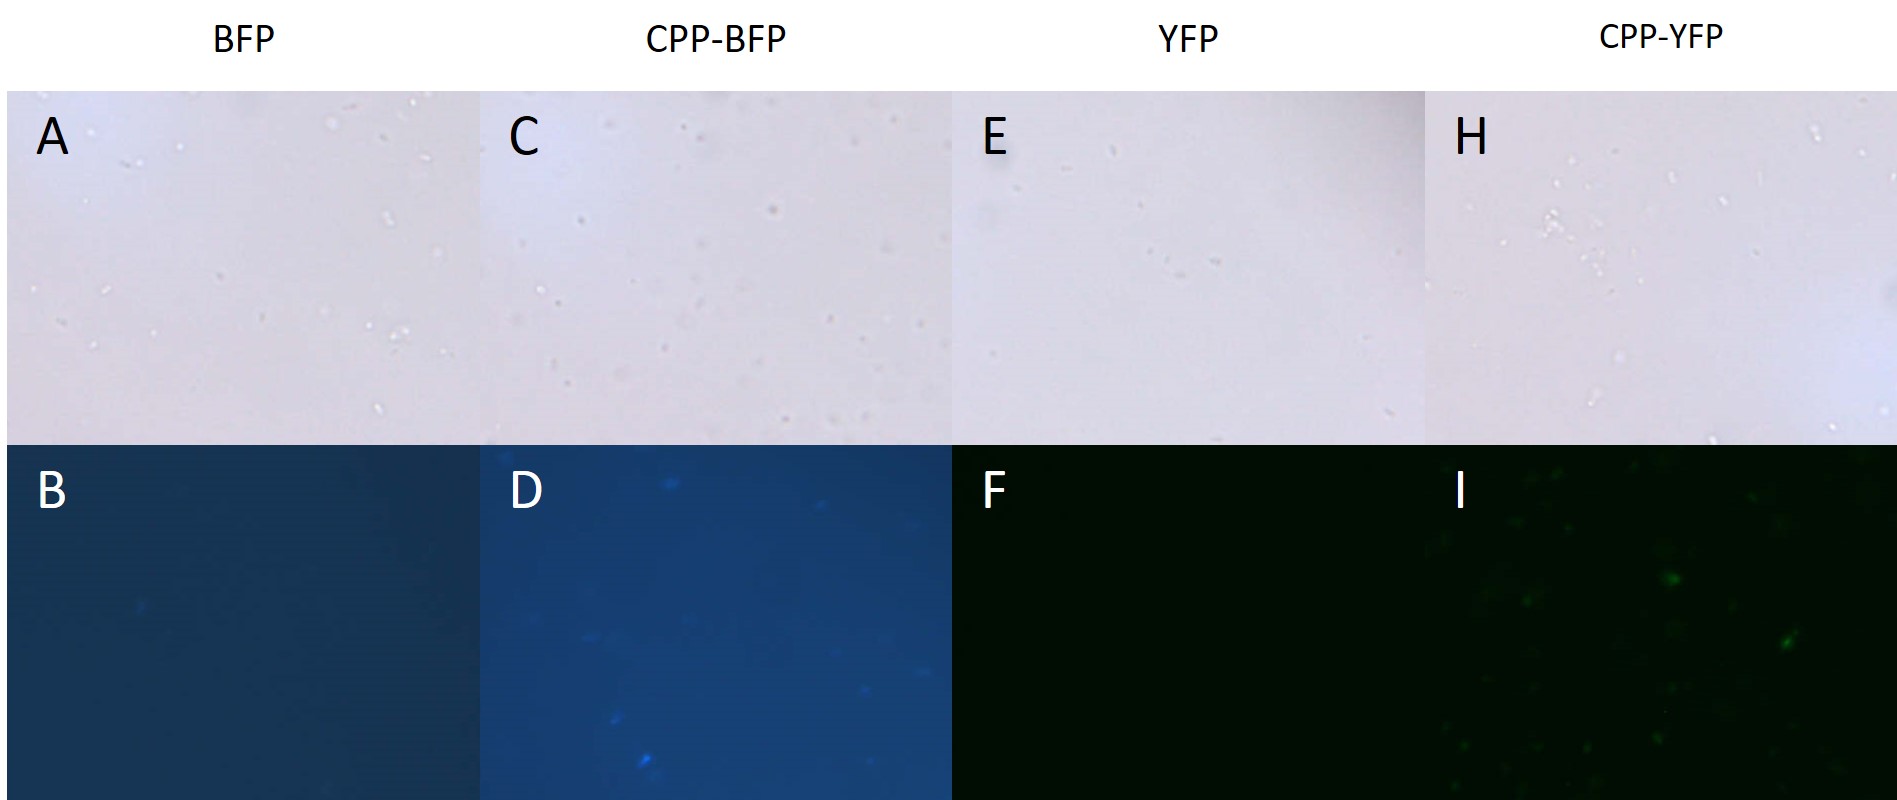
An improved version of the SYFP2 reporter with an N-terminal Cell-Penetrating peptide (CPP) signal was constructed by the UCopenhagen 2017 iGEM Team. The addition of the nona-argigine CPP tag was shown to give the SYFP2 biobrick the ability stain both E. coli and P. putida cells, presumably by causing internalisation. In addition the improved biobrick carries a C-terminal hexa-histidine tag. For more information please visit the improved part CPP-SYFP2.
Author: Jon Fugl
SYFP2 Evolutionary Stability Improvement by Austin_UTexas 2019
The SYFP2 plasmid was redesigned by changing the sequence in order to remove an IS10 hot spot identified by the 2015 Austin_UTexas iGEM team. The 2019 Austin_UTexas iGEM team measured the fluorescence of the redesigned plasmid in TOP10 E. coli cells over a period of 4 days. It was determined that expression of the redesigned SYFP2 lasted for up to four days in culture while the original SYFP2 plasmid lost expression within one day. For more information please visit the part page for the redesigned plasmid.
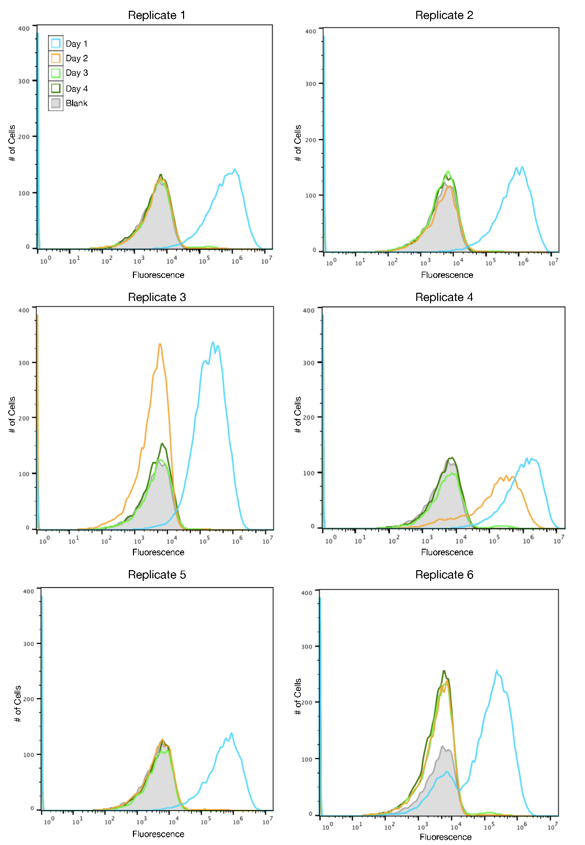
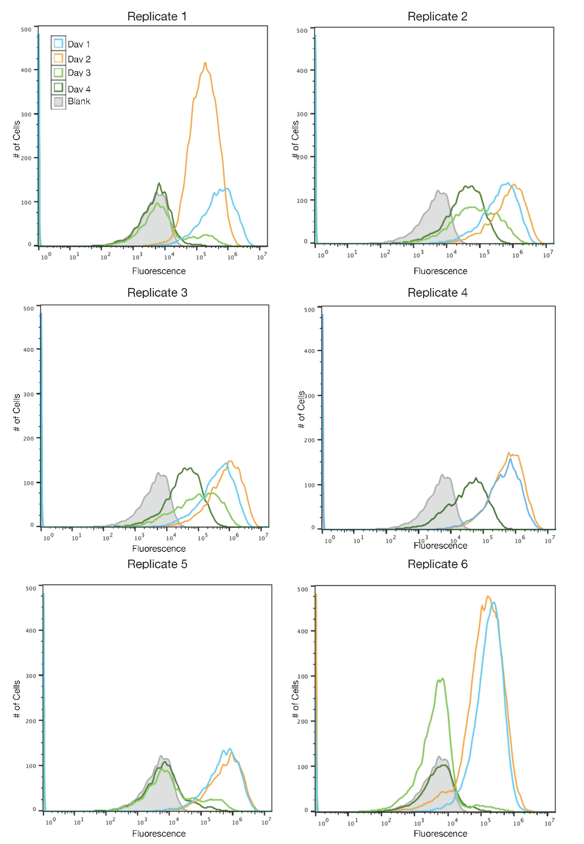
Author: Alex MacAskill
References
[http://pubs.acs.org/doi/abs/10.1021/bi0516273] Kremers, G.-J., Goedhart, J., van Munster, E. B., & Gadella, T. W. J. (2006). Cyan and yellow super fluorescent proteins with improved brightness, protein folding, and FRET Förster radius. Biochemistry, 45(21), 6570–6580. doi:10.1021/bi0516273
Sequence and Features
- 10COMPATIBLE WITH RFC[10]
- 12COMPATIBLE WITH RFC[12]
- 21COMPATIBLE WITH RFC[21]
- 23COMPATIBLE WITH RFC[23]
- 25COMPATIBLE WITH RFC[25]
- 1000COMPATIBLE WITH RFC[1000]
//collections/chromoprotein/uppsala
//function/reporter/fluorescence
| chassis | Codon optimized for expression in E coli. |
| color | Yellow |
| emission | 527 nm |
| excitation | 515 nm |

