Part:BBa_K525234
Fusion Protein of mRFP, S-layer cspB from Corynebacterium halotolerans with TAT-sequence, PT7, RBS
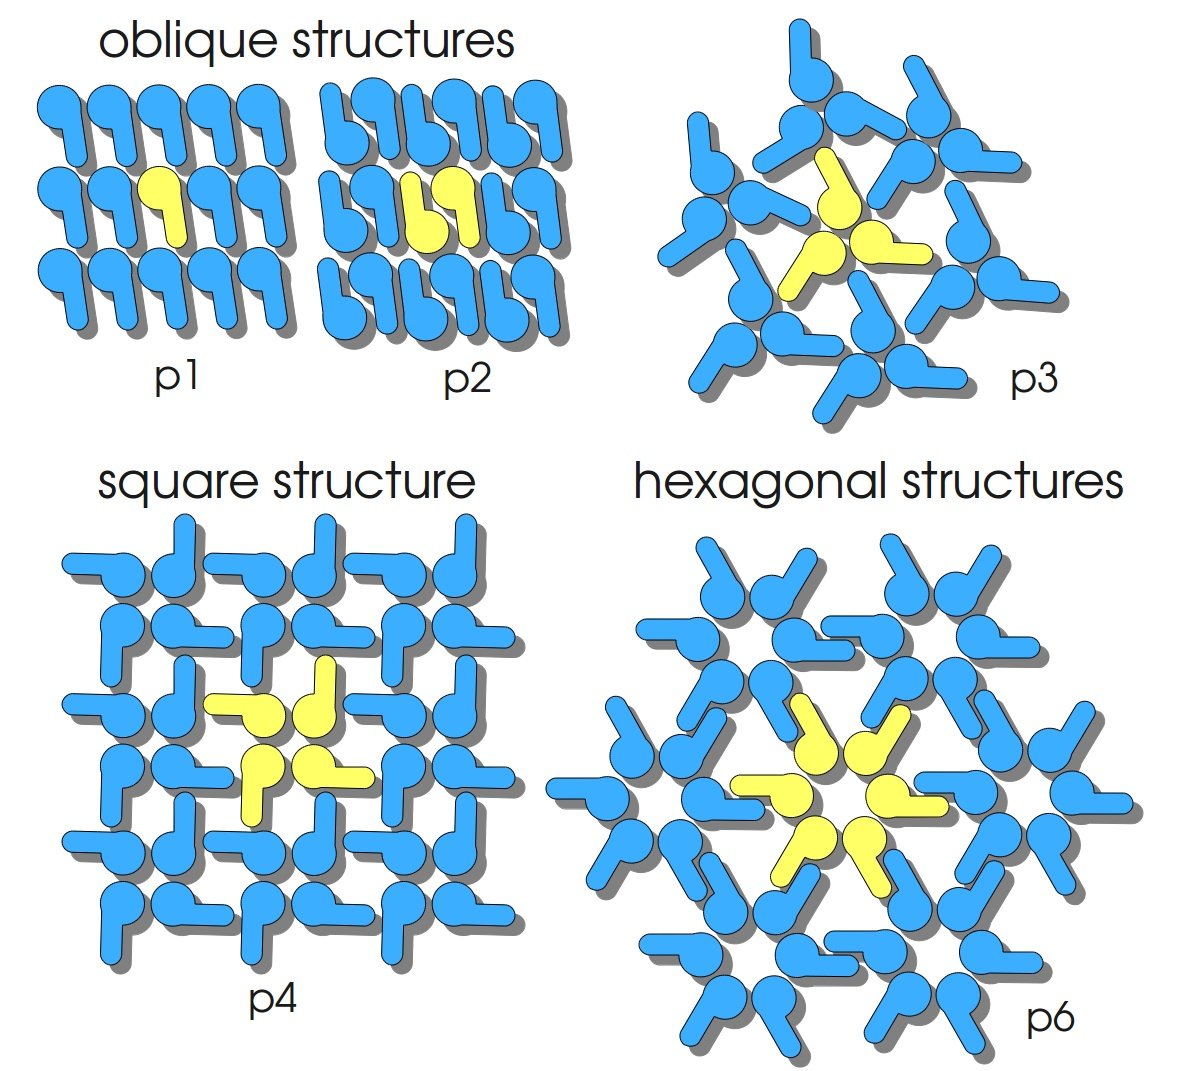
S-layers (crystalline bacterial surface layer) are crystal-like layers consisting of multiple protein monomers and can be found in various (archae-)bacteria. They constitute the outermost part of the cell wall. Especially their ability for self-assembly into distinct geometries is of scientific interest. At phase boundaries, in solutions and on a variety of surfaces they form different lattice structures. The geometry and arrangement is determined by the C-terminal self assembly-domain, which is specific for each S-layer protein. The most common lattice geometries are oblique, square and hexagonal. By modifying the characteristics of the S-layer through combination with functional groups and protein domains as well as their defined position and orientation to eachother (determined by the S-layer geometry) it is possible to realize various practical applications ([http://onlinelibrary.wiley.com/doi/10.1111/j.1574-6968.2006.00573.x/full Sleytr et al., 2007]).
Usage and Biology
S-layer proteins can be used as scaffold for nanobiotechnological applications and devices by e.g. fusing the S-layer's self-assembly domain to other functional protein domains. It is possible to coat surfaces and liposomes with S-layers. A big advantage of S-layers: after expressing in E. coli and purification, the nanobiotechnological system is cell-free. This enhances the biological security of a device.
This fluorescent S-layer fusion protein is used to characterize purification methods and the S-layer's ability to self-assemble on surfaces.
Important parameters
| Experiment | Characteristic | Result |
|---|---|---|
| Expression (E. coli) | Localisation | Inclusion body |
| Compatibility | E. coli KRX and BL21(DE3) | |
| Inductor for expression | T7 polymerase | |
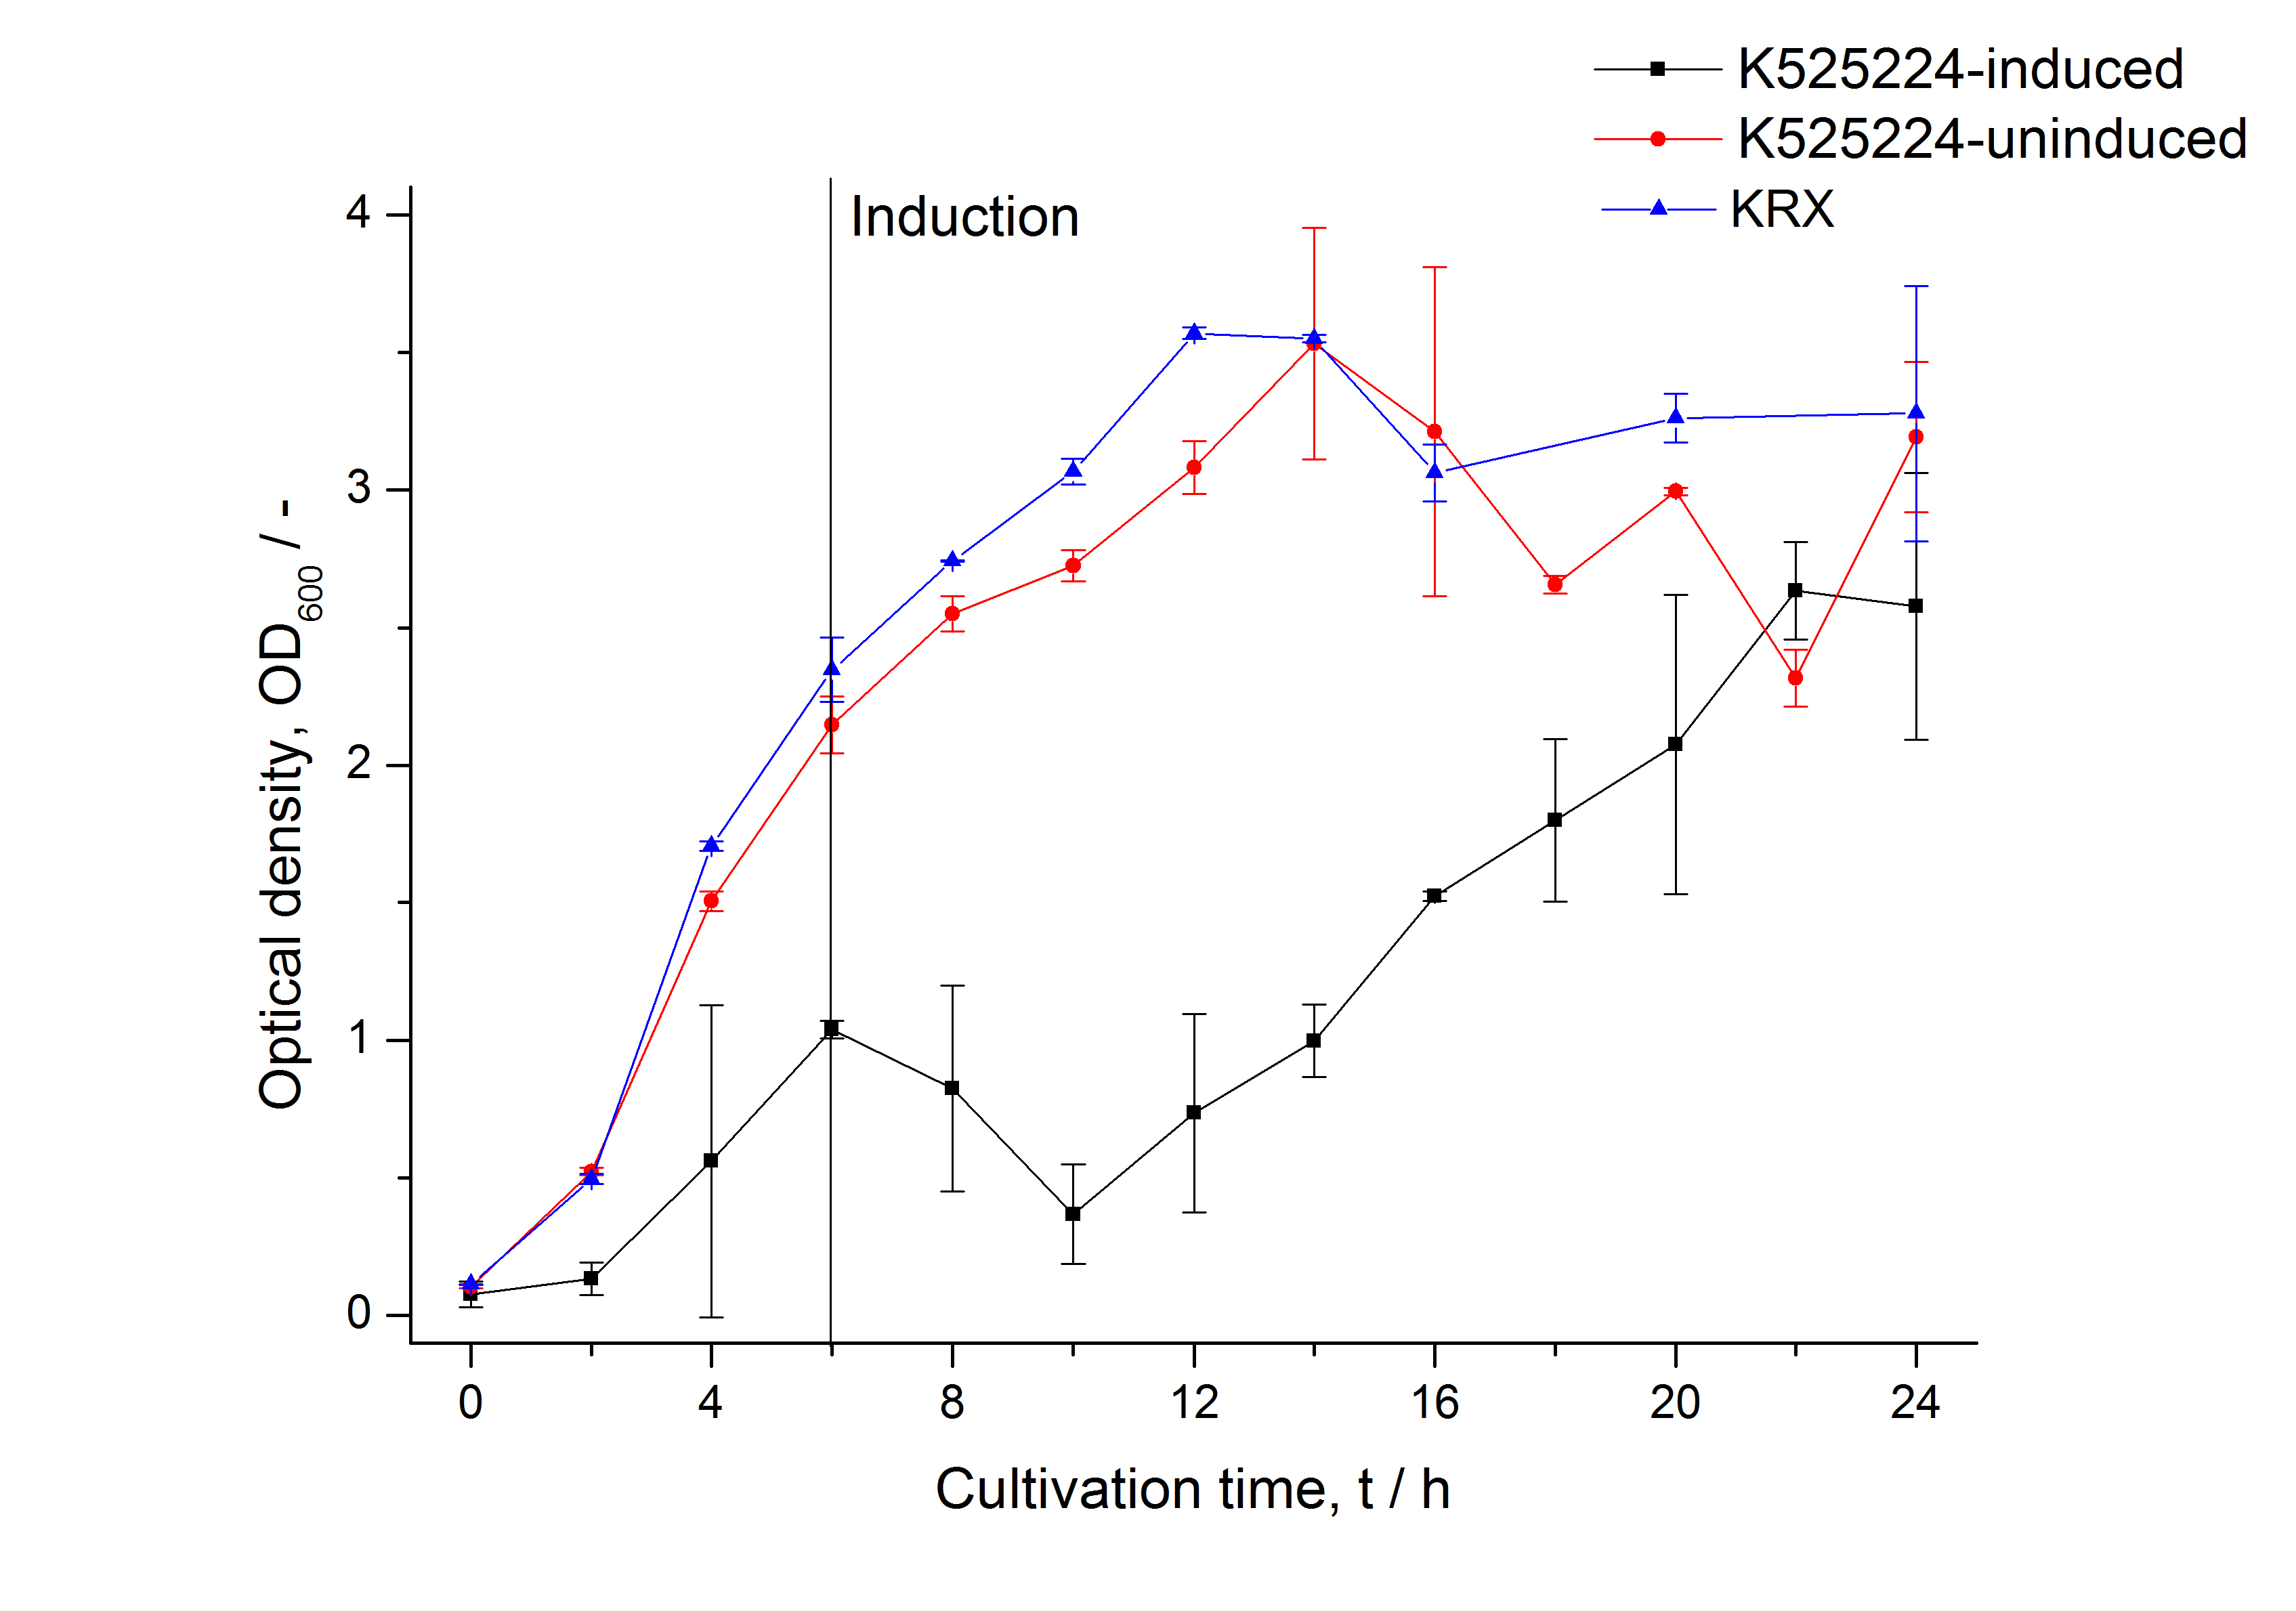
| Specific growth rate (un-/induced) | 0.251 h-1 / 0.157 h-1 | |
| Doubling time (un-/induced) | 2.76 h / 4.42 h | |
| Purification | Molecular weight | 79.2 kDa |
| Theoretical pI | 4.54 | |
| Excitation / emission | 584 / 607 nm |
Sequence and Features
- 10INCOMPATIBLE WITH RFC[10]Illegal PstI site found at 799
Illegal PstI site found at 1125 - 12INCOMPATIBLE WITH RFC[12]Illegal PstI site found at 799
Illegal PstI site found at 1125 - 21INCOMPATIBLE WITH RFC[21]Illegal BglII site found at 1876
Illegal XhoI site found at 1332 - 23INCOMPATIBLE WITH RFC[23]Illegal PstI site found at 799
Illegal PstI site found at 1125 - 25INCOMPATIBLE WITH RFC[25]Illegal PstI site found at 799
Illegal PstI site found at 1125
Illegal NgoMIV site found at 999
Illegal NgoMIV site found at 2088
Illegal AgeI site found at 87
Illegal AgeI site found at 680
Illegal AgeI site found at 792
Illegal AgeI site found at 990
Illegal AgeI site found at 1231
Illegal AgeI site found at 1278 - 1000INCOMPATIBLE WITH RFC[1000]Illegal BsaI site found at 1680
Illegal BsaI.rc site found at 987
Illegal BsaI.rc site found at 1365
Illegal BsaI.rc site found at 1767
Expression in E. coli
The CspB gene was fused with a monomeric RFP (BBa_E1010) using [http://2011.igem.org/Team:Bielefeld-Germany/Protocols#Gibson_assembly Gibson assembly] for characterization.
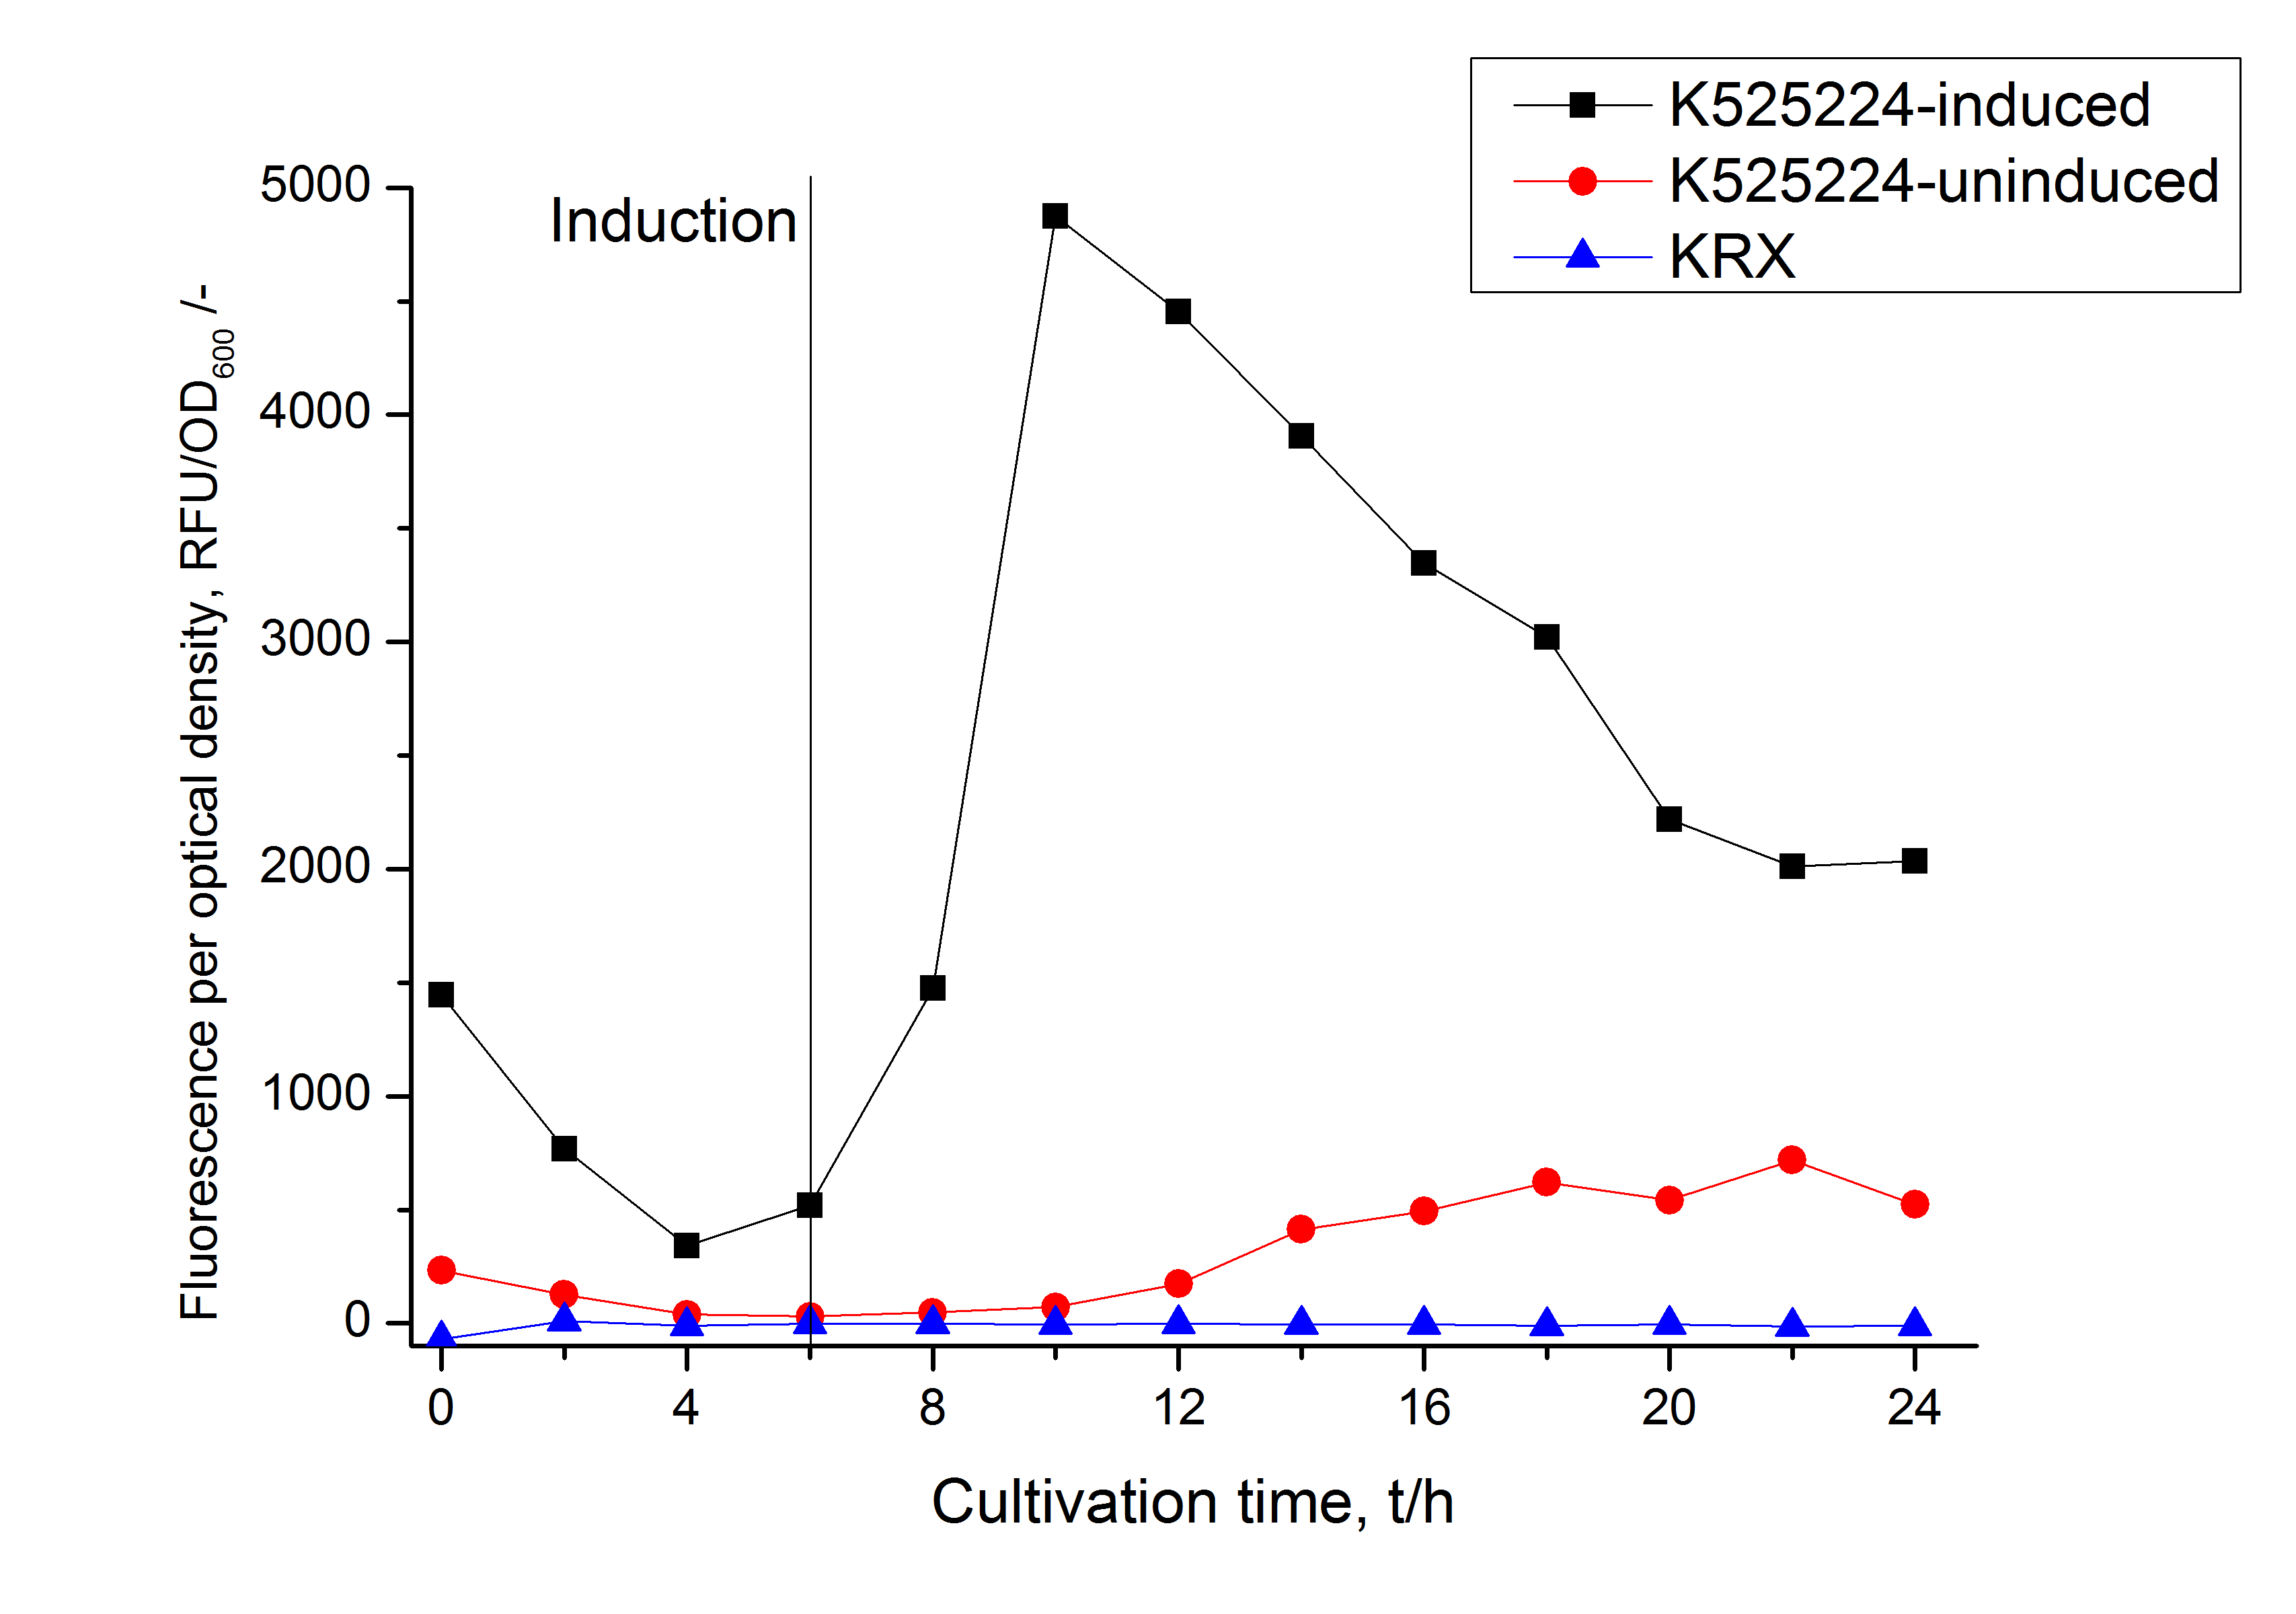
The CspB|mRFP fusion protein was overexpressed in E. coli KRX after induction of T7 polymerase by supplementation of 0,1 % L-rhamnose using the [http://2011.igem.org/Team:Bielefeld-Germany/Protocols/Downstream-processing#Expression_of_S-layer_genes_in_E._coli autinduction protocol] from Promega.
Intracellular and localisation
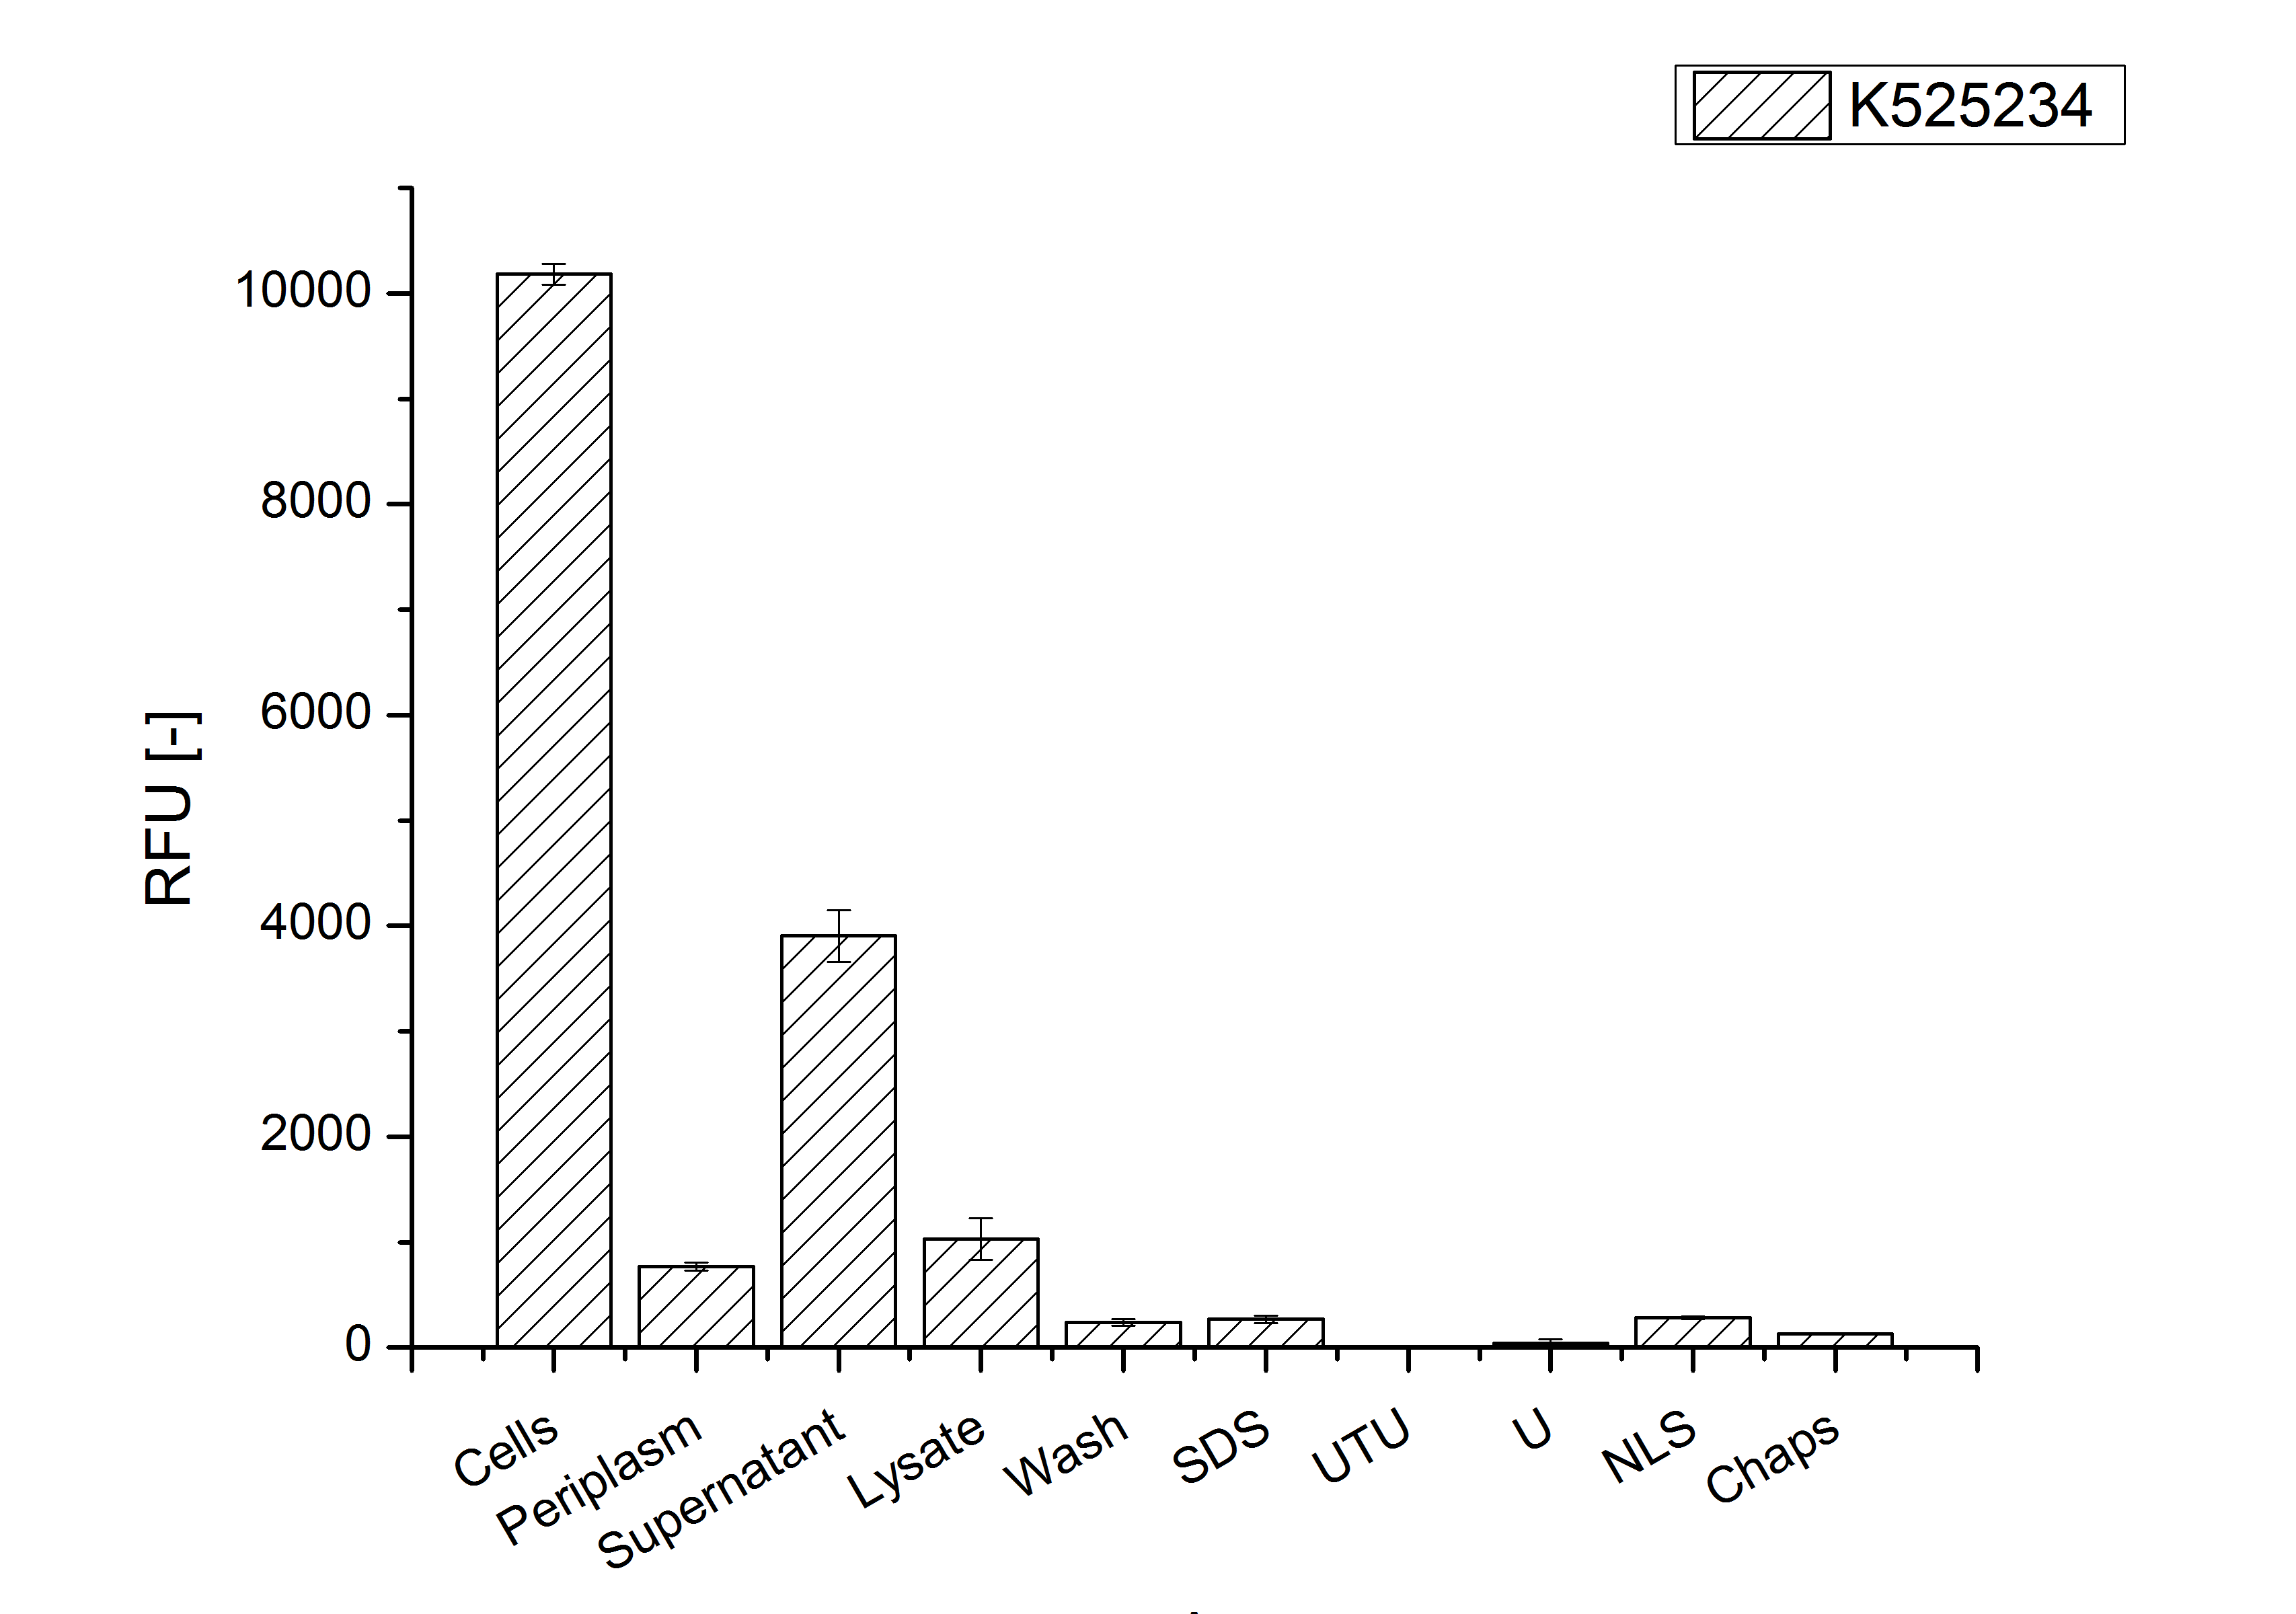
After a cultivation time of 18 h the mRFP|CspB fusion protein has to be localized in E. coli KRX. Therefor a part of the produced biomass was mechanically disrupted and the resulting lysate was washed with ddH2O. Then the lysate was treated with ionic, nonionic and zwitterionic detergents to release the mRFP|CspB out of the membranes, if it intigrates. From the other part of the cells the periplasm was detached by using a osmotic shock. The existance of fluorescene in the periplasm fraction, showed in fig. 3, indicates that C. halotolerans TAT-signal sequence is at least in part functional in E. coli KRX.
Specific for K525224 fused with mRFP is the proportional to the mRFP fusion proteins of K525222 and K525223 high fluorescence in the culture supernatant. This indicates that the fusion protein is secreted into the periplasm via the TAT-pathway and partly released into the culture medium. Because there is no known release pathway for S-layer proteins in E. coli the periplasm might burst in consequence of the overexpression.
The fluorescence in all cultivation fractions plus the fluorescence in the lysis und wash fraction shows that the fusion protein is water soluble and doesn't sediment during centrifugation.
The absence of fluotrescence indicates that the expressed fusion protein doesn't form inclusion bodies during cultivation.
Purification
After the localisation of the S-layer protein in E. coli, different methods for purification were tested. The results of these methods are shown in fig. 4. Fig. 4 shows, that the CspB protein does not form inclusion bodies in E. coli and most of the protein is transported out of the cell into the periplasm and a lot of protein is even secreted into the medium (all fractions were concentrated by filtration and precipitation, respectively). The secretion into the culture medium is very interesting because the purification is much faster (no cell disruption necessary).
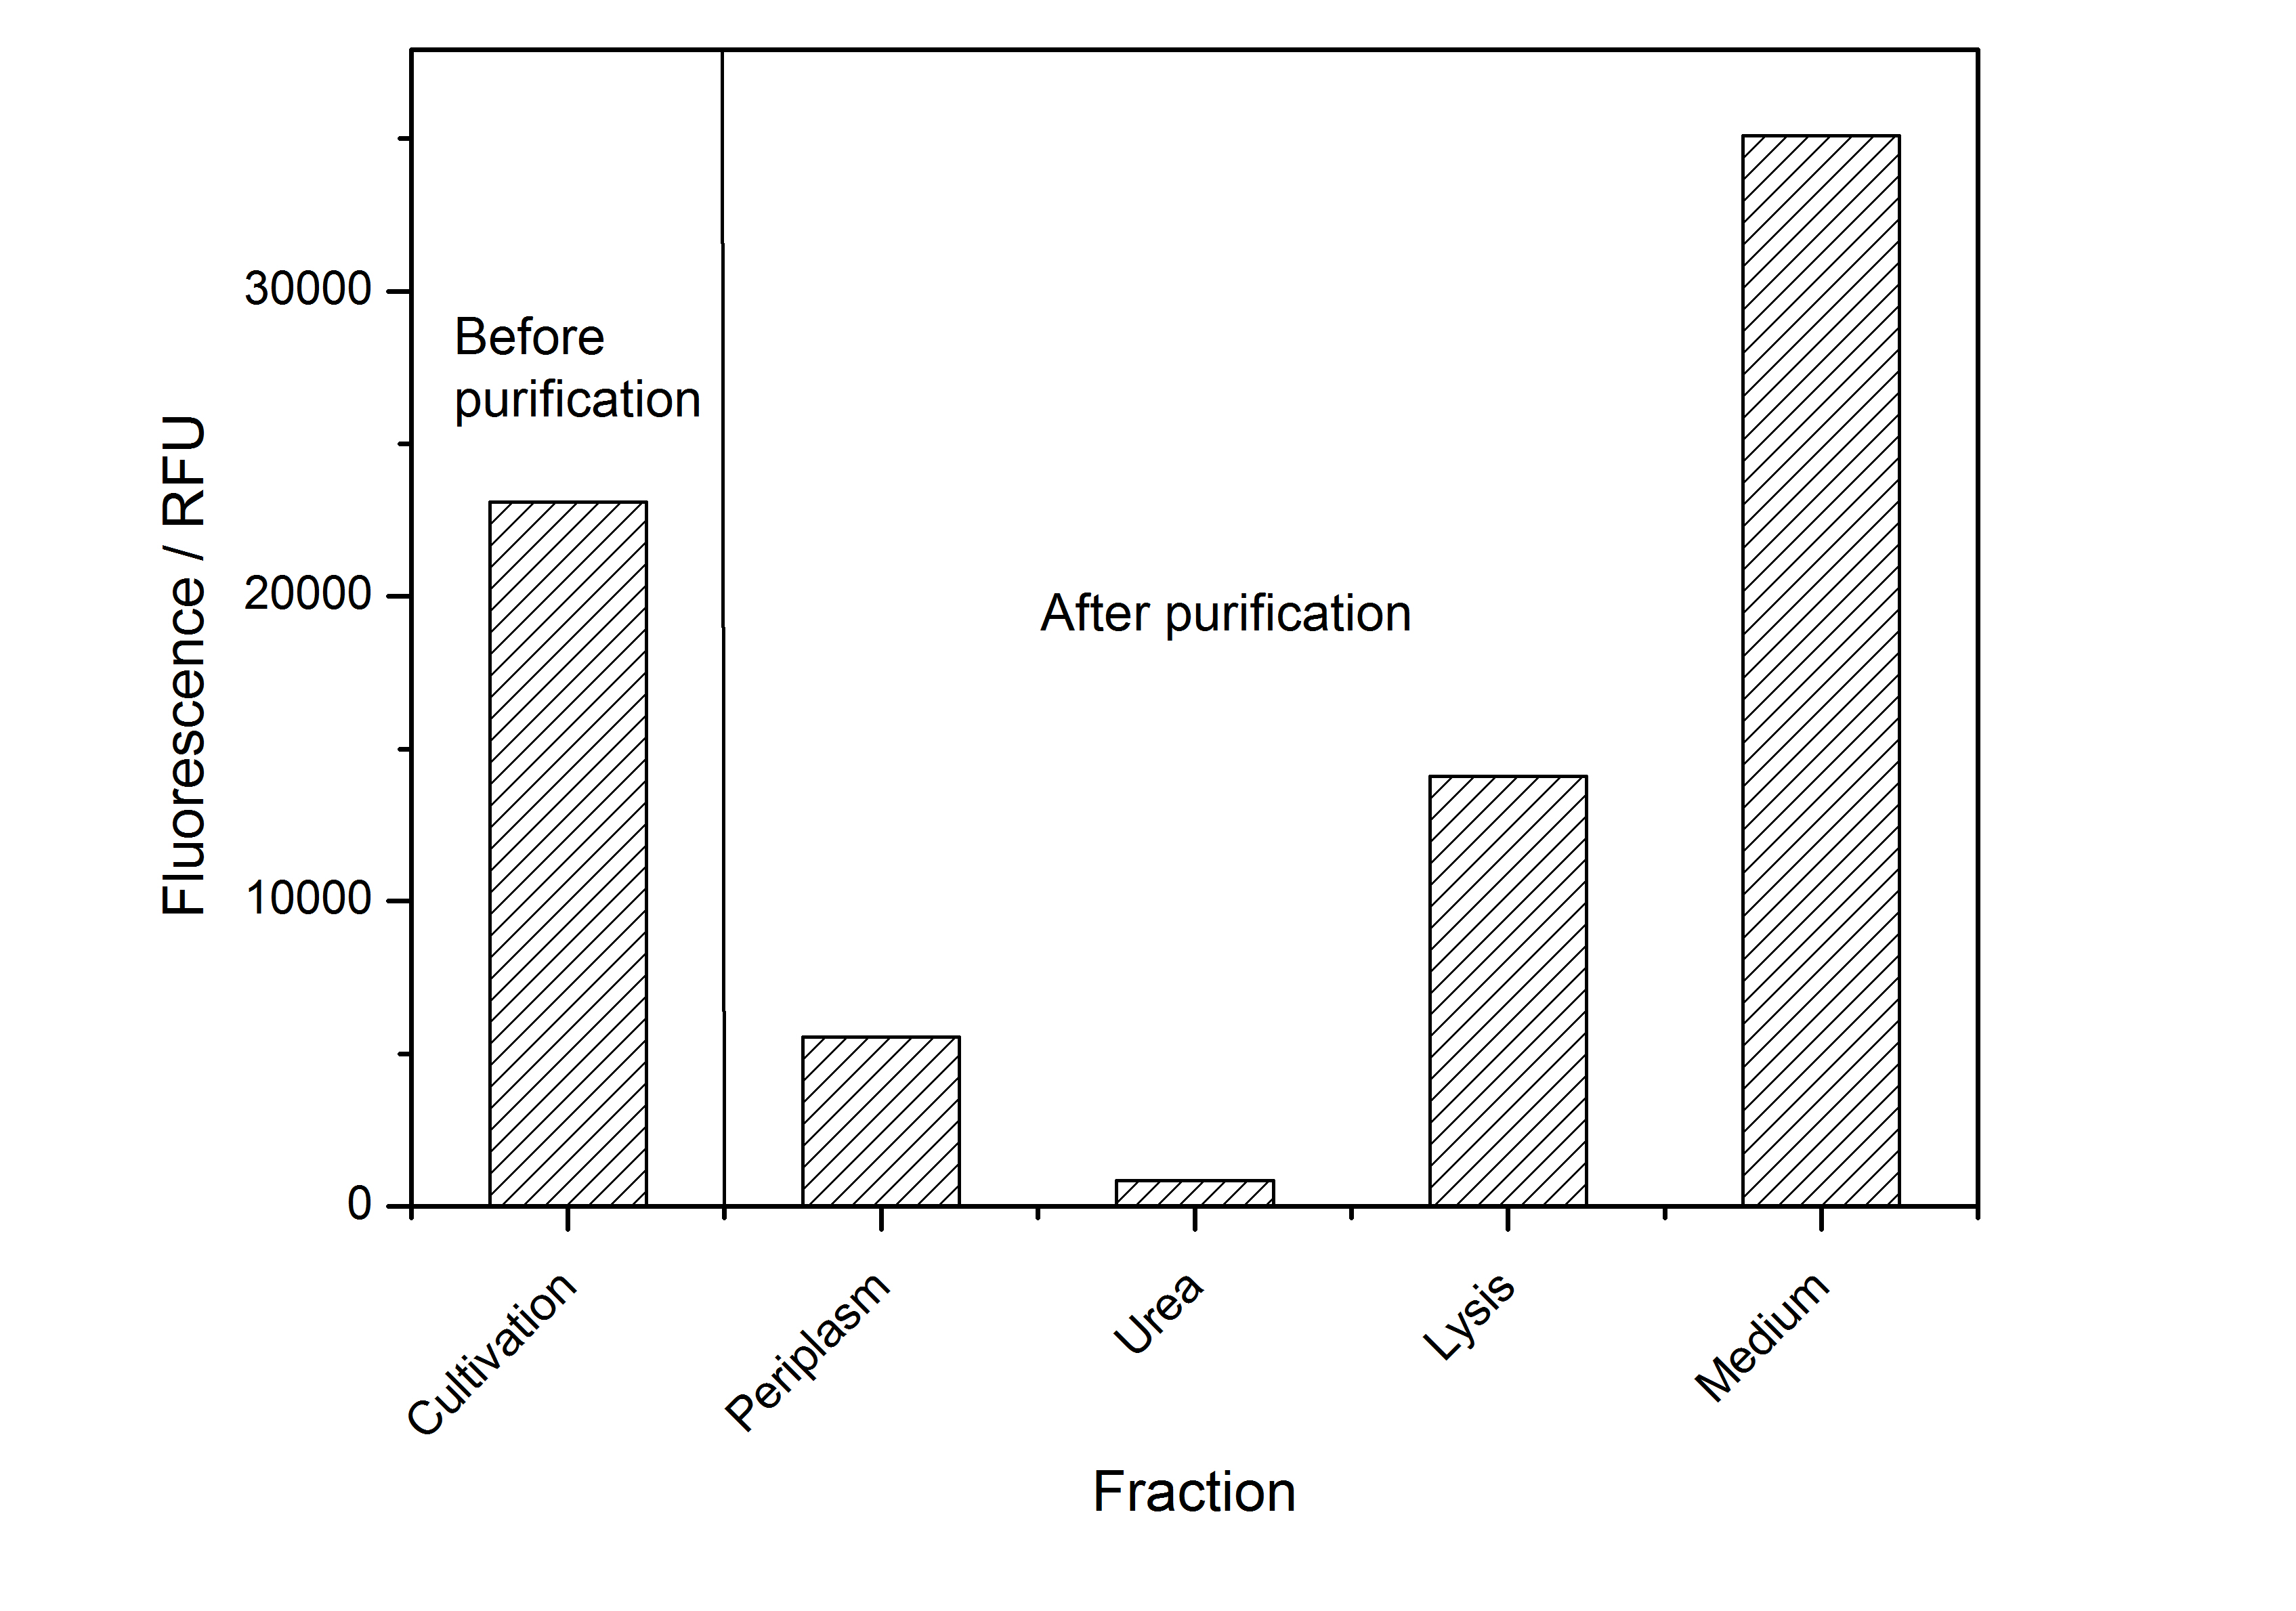
The highest fluorescence could be obtained by a precipitation with ammonium sulfate of the culture supernatant followed by an ultrafiltration with a 300 kDa membrane and a diafiltration with a 50 kDa membrane. The diafiltration was against a binding buffer for an anion exchange chromatography (25 mM sodium acetate, 25 mM sodium chloride) with pH 6, due to the theoretical pI of BBa_K525234. The fluorescence of the collected fractions of the following anion exchange chromatography are shown in fig. 5.
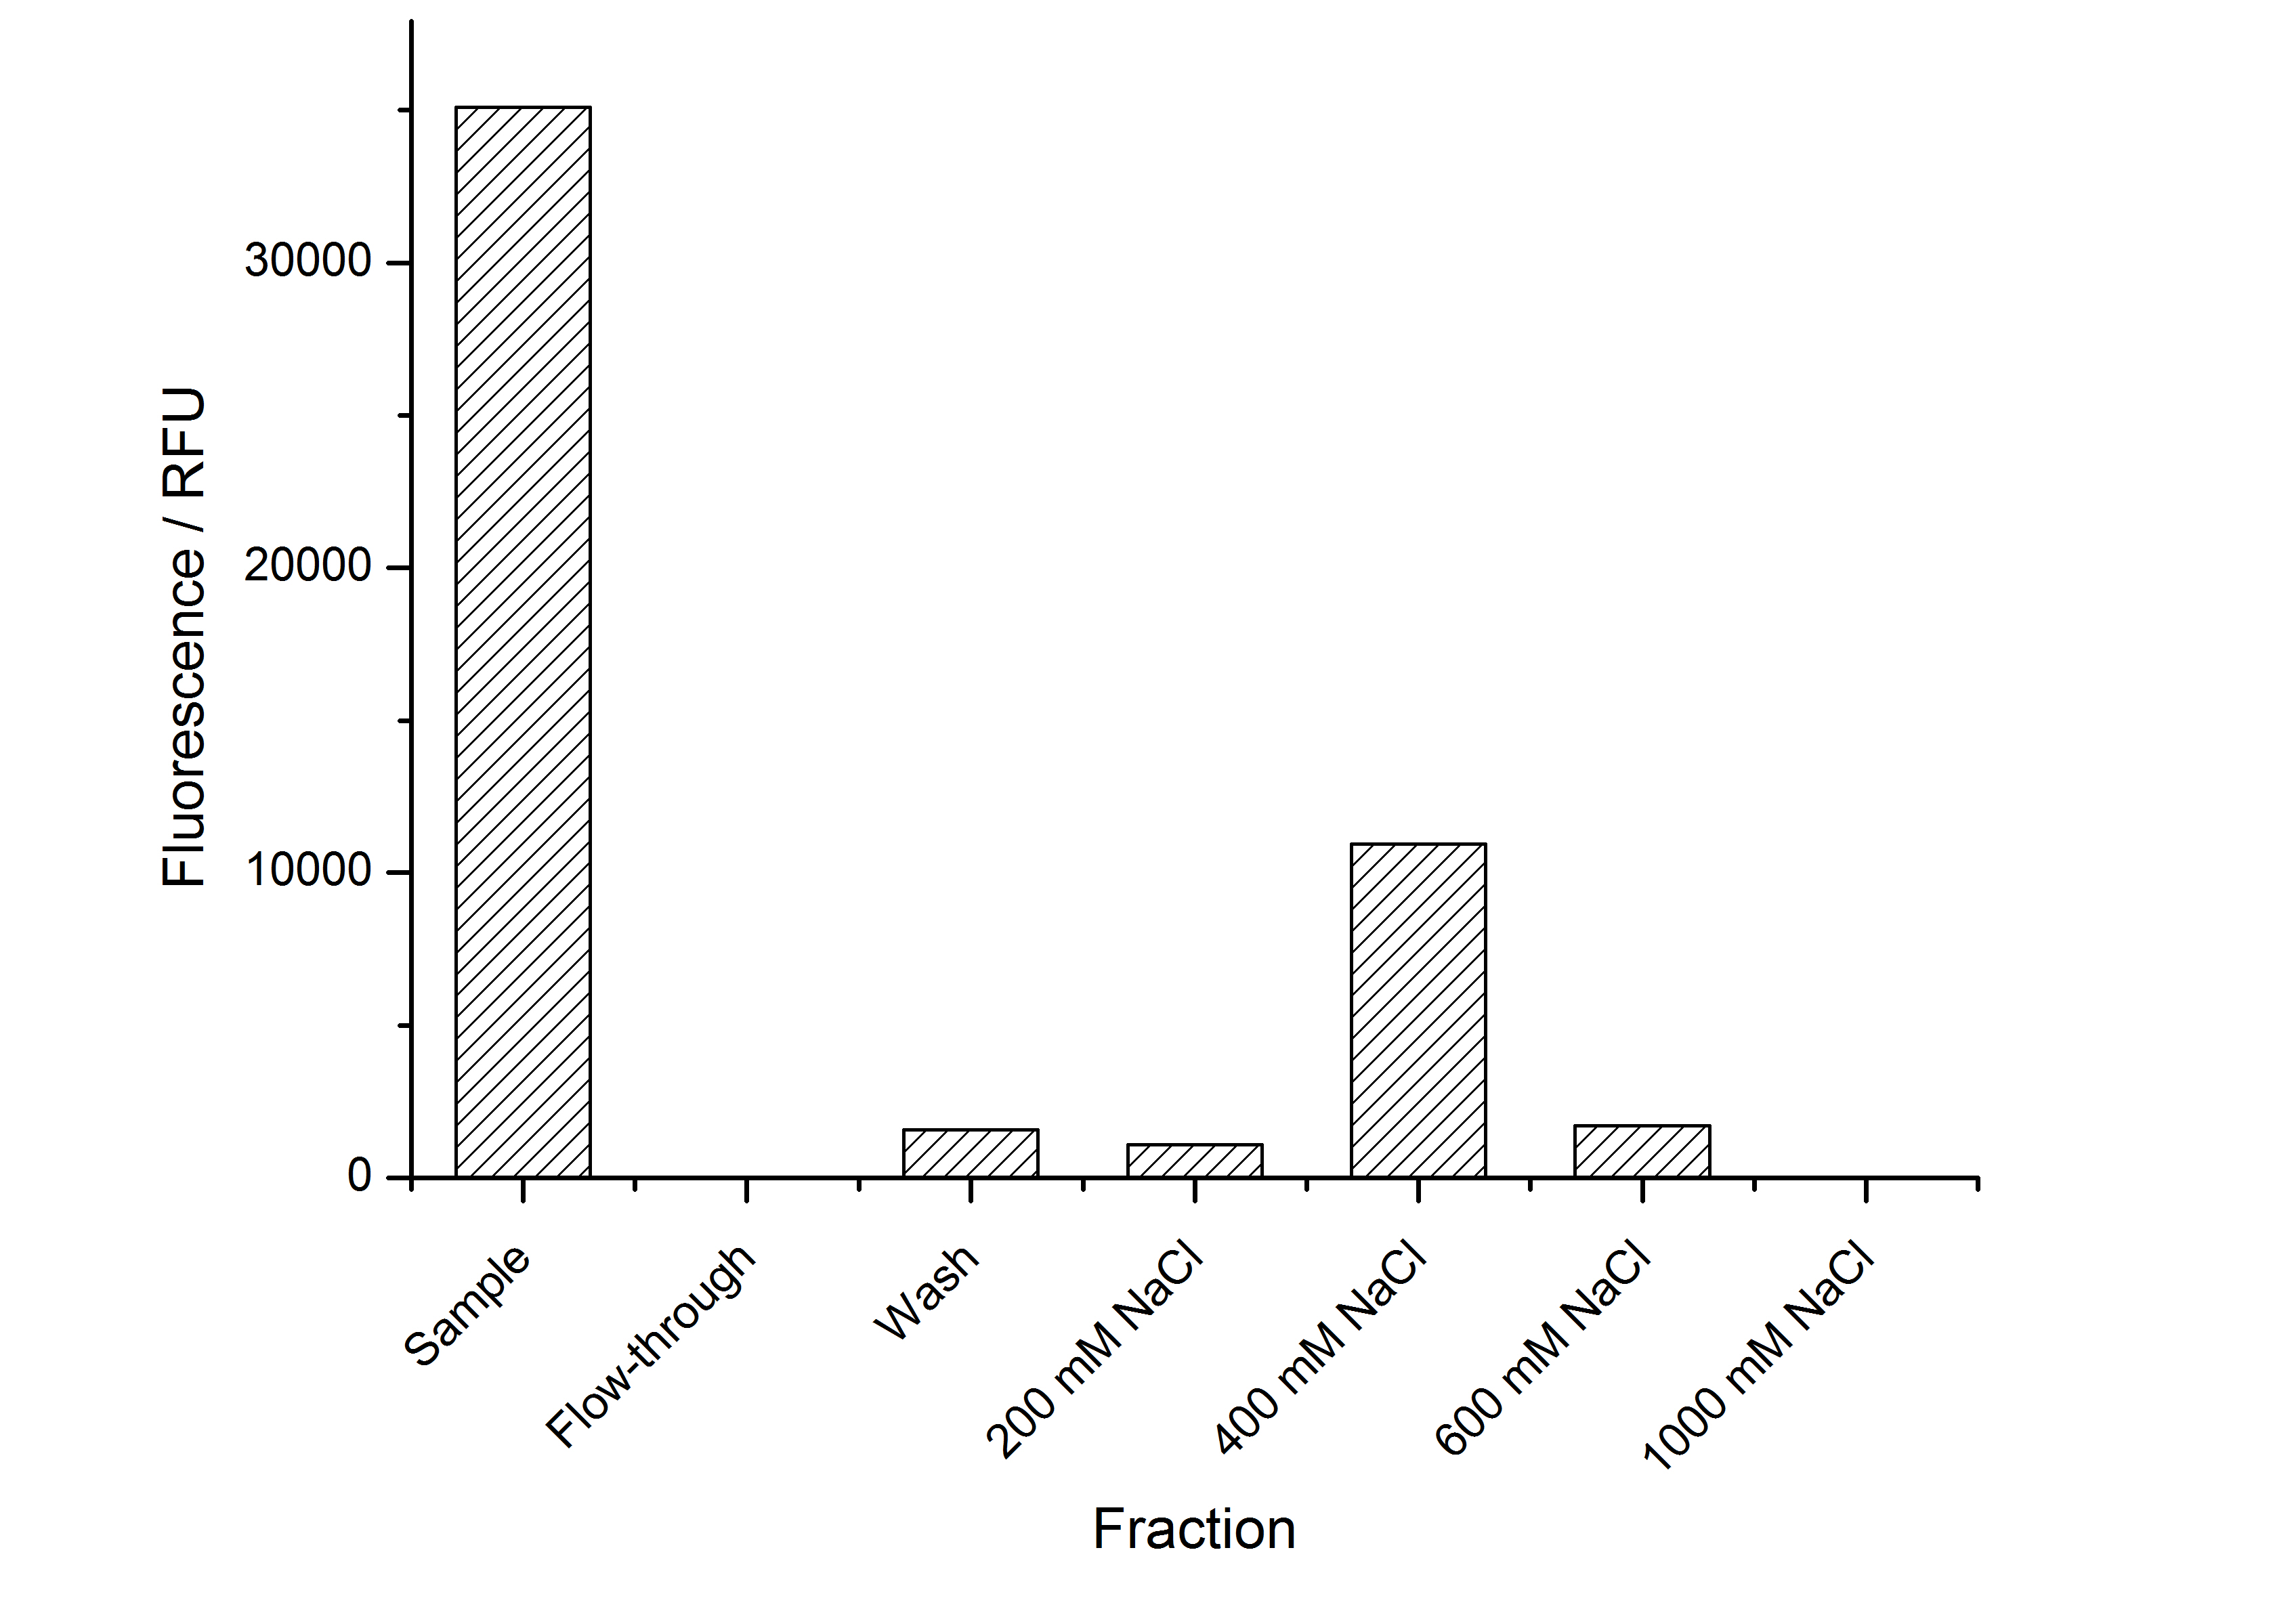
The binding conditions are well chosen because nearly all of the protein binds to the column. The protein is eluted from the column with rising sodium chloride concentrations. The highest fluorescence is in the elution fraction with 400 mM sodium chloride. 600 mM sodium chloride elutes all of the S-layer fusion proteins.
//function/reporter/fluorescence
//proteindomain/internal
//rnap/bacteriophage/t7
| color | Red |

