Part:BBa_K2934000
Glucose Oxidase-Histag A. niger optimized for B. subtilis
Contribution by Team 2023 TSBC-SZ
Group: TSBC-SZ iGEM 2023
Summary
Gox1 gene codes for the glucose oxidase enzyme to digest glucose. In this project, we used this protein for proceeding with TNBC ferroptosis. We used the synthetic Gox1 (BBa_K2934000) gene fragment to connect to the pET28a vector to construct a recombinant plasmid pET28a-Gox1 (BBa_K4841018). For this new composite part, we have tested the glucose oxidase activity, GSH activity, and TNBC inhibition activity of the Gox1 protein.
Documentation
a. Usage and Biology
Glucose oxidase is an enzyme that has widespread applications in industry and biotechnology. Due to this, a deep understanding of its structure and function are warranted. Glucose degradation is the most universal metabolic process. In addition to its breakdown in glycolysis, glucose can also be directly oxidized to glucono-δ-lactone by a number of enzymes.[1] GOx is a member of the glucose-methanol-choline oxidoreductase (GMC oxidoreductase) superfamily. The members of this family are all FAD-dependent oxidoreductases that share a common fold [2,3]. They consist of two functional domains, an N-terminal FAD-binding domain, which contains a strictly conserved βαβ mononucleotide-binding motif and a more variable substrate binding-domain. As the name suggests, the members of this family oxidize a variety of substrates containing hydroxyl functional groups, including mono and di-saccharides, alcohols, cholesterol, and choline.[1]

Characterization/Measurement
We amplified Gox1 and pET28a through PCR and then plasmid pET28a-Gox1 was constructed by T4 ligation. The sequencing result validates correct construction (Figure 1).

From Figures 2A and 2B, as the protein concentration increases, the glucose oxidase activity also increases. We can be seen that the higher the glucose oxidase activity, the easier it is to promote iron death. Fig 2C and D are both results of CCK-8, and the part which color is pink is the part where the cells are better suppressed. We can be seen that the higher the glucose oxidase activity, the easier it is to promote iron death.

Fig. 3A and Fig. 3B are a linear function with different concentrations of GSH for reference. And Fig. 3C is the result of CCK8, and transparent parts indicate low GSH activity. Fig. 3C is able to visualize the difference in color, Fig. 3D shows that 64 μg/mL of Gox1 protein and RSL (1 μM) can achieve about the same level of cancer inhibition. Fig. 4D shows that RSL (1 μM) and 64 μg/mL of Gox1 protein inhibit GSH activity relatively well and could promote iron death.
References
- Bauer JA, Zámocká M, Majtán J, Bauerová-Hlinková V. Glucose Oxidase, an Enzyme "Ferrari": Its Structure, Function, Production and Properties in the Light of Various Industrial and Biotechnological Applications. Biomolecules. 2022 Mar 19;12(3):472.
- Cavener D.R. GMC oxidoreductases: A newly defined family of homologous proteins with diverse catalytic activities. J. Mol. Biol. 1992;223:811–814.
- Sützl L., Foley G., Gillam E.M.J., Bodén M., Haltrich D. The GMC superfamily of oxidoreductases revisited: Analysis and evolution of fungal GMC oxidoreductases. Biotechnol. Biofuels. 2019;12:118.
This part is coding for the glucose oxidase (GOx) enzyme, which catalyzes the oxidation of glucose to D-glucono-lacton and releases hydrogen peroxide. The sequence includes His-tag (6xHis), connected with seven amino acids linker protein at the N-terminus of the protein. The enzyme derived from A. niger and is codon-optimized for B. subtilis.
Usage and Biology
Glucose oxidase (GOx) catalyzes the oxidation of glucose by using molecular oxygen to create hydrogen peroxide and D-glucono lactone. GOx requires the cofactor flavin adenine dinucleotide (FAD) that acts as an electron acceptor in a redox reaction. During the reaction, FAD is reduced to FADH2, followed by oxidation using molecular oxygen, which is then reduced to hydrogen peroxide [1].
Sequence and Features
- 10COMPATIBLE WITH RFC[10]
- 12COMPATIBLE WITH RFC[12]
- 21COMPATIBLE WITH RFC[21]
- 23COMPATIBLE WITH RFC[23]
- 25COMPATIBLE WITH RFC[25]
- 1000INCOMPATIBLE WITH RFC[1000]Illegal BsaI site found at 30
Illegal BsaI site found at 361
Illegal BsaI.rc site found at 307
Illegal BsaI.rc site found at 1132
Glucose Oxidase Activity Assay
Glucose Oxidase (GOx) catalyzes the oxidation of glucose to D-gluconic-lactone and hydrogen peroxide. Therefore, a precise method to determine the amount of hydrogen peroxide found in the solution could indicate the activity of the glucose oxidase. In this experiment, we used the assistance of another commercial enzyme- horseradish peroxidase (HRP) and 2,2'-azino-bis(3-ethylbenzothiazoline-6-sulphonic acid) (ABTS). Using hydrogen peroxide, the HRP catalyzes the oxidation of reduced ABTS, which is colorless, to oxidized ABTS, which is turquoise. While using excess ABTS and HRP, the absorbance of 416 nm light could indicate to us the amount of hydrogen peroxide created by the glucose oxidase, and therefore - the glucose oxidase activity.
β-D-Glucose + O2 + H2O → D-Glucono-1,5–Lactone + H2O2 (GOx)
H2O2 + 2ABTS (reduced) → 2ABTS(oxidized)+ 1⁄2O2 + H2 (HRP)
To verify that the absorbance-activity relation remains linear under the experiment's conditions, we performed the experiment using commercial GOx with increasing activity, measured the 416 nm light absorbance and plotted a graph to demonstrate that relation. Fortunately, we have proved the absorbance-activity relation linearity under the experiment's conditions (Figure 2).
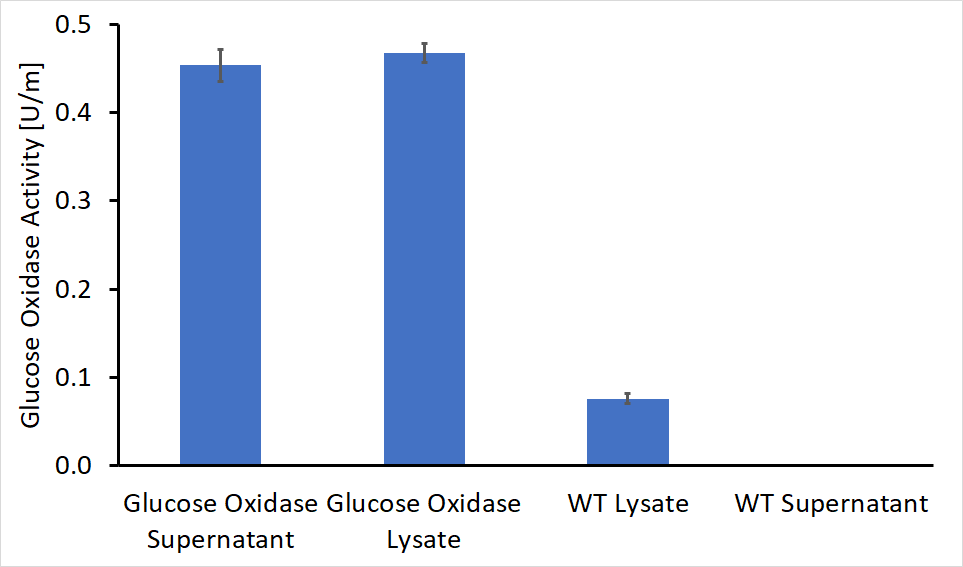
After the cloning process had been completed, we performed the activity test on both the supernatant and the lysate of genetically engineered bacteria as well as WT bacteria as control. The first colony tested contained a gene for glucose oxidase and the AmyE signal peptide (BBa_K2273023). The absorbance detected in the recombinant bacteria was significantly higher, in both supernatant and lysate (Figure 3). The evaluated activity of glucose oxidase is 0.46U/ml in the bacterial supernatant and 0.45U/ml in the lysate solution.
Secretion Assay By SDS-PAGE
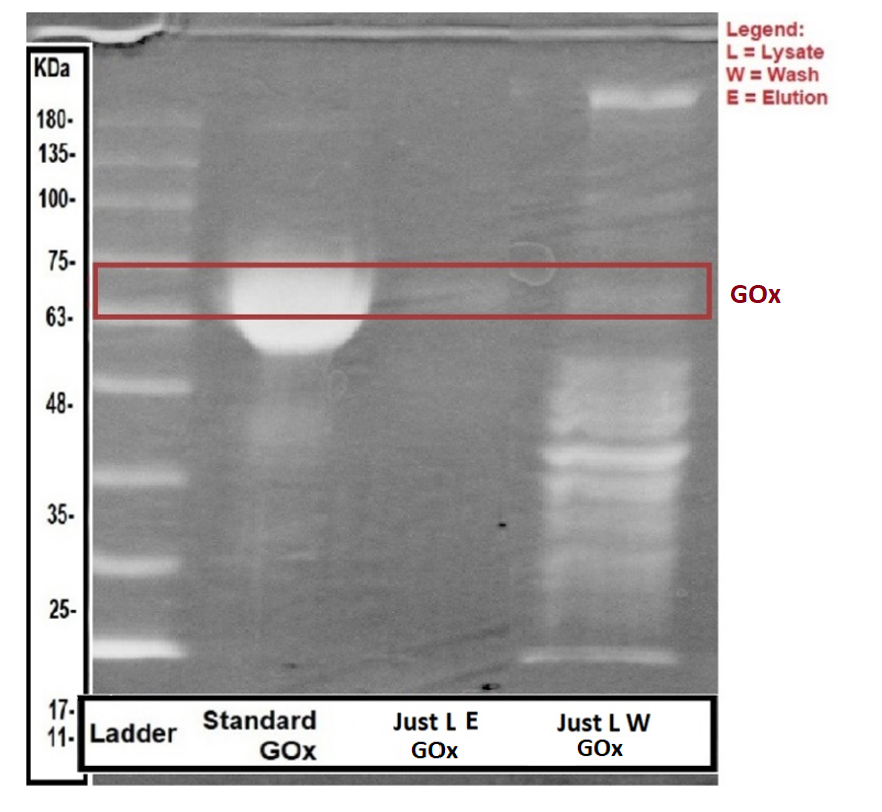
To ensure enzyme expression and secretion from our engineered bacteria, we performed SDS-PAGE. To determine whether the enzyme was secreted or expressed within the bacteria, we compared both lysate and supernatant samples of the engineered bacteria, as well as wild type bacteria samples. Methods are listed at the bottom of the page. The experiment results are shown in the following figures:
As seen in figures 4,5 above, there is a faint band in the area of the standard GOx, but we couldn’t get any concrete conclusion since we had a problem with our WT sample preventing us from running them in the gel. In addition, there is a strong band in the range of 40-48 kDa in the sample containing the AmyE signal peptide (Fig. 4).
To conclude, the SDS-PAGE gave us a vague picture about the success of the protein expression and secretion since we couldn’t compare them to our WT samples.
Methods
This vector was constructed by Gibson assembly, with the pBE-S commercial plasmid (Takara) that served as a backbone, and eventually transformed into Bacillus subtilis (RIK1285).
The bacteria were cultured over-night at 37°C in a shaking incubator (250 rpm), followed by 1:100 dilution. The diluted culture was incubated for another few hours while monitoring the culture turbidity by measuring the O.D600.
When the culture has reached the logarithmic growth phase, the bacterial extracellular and intracellular proteins were separated, after collecting the supernatant and the pellet (followed by lysis, using sonicator).
For further reading of our full protocols (cloning, enzymatic assays and enzymatic assay under different pH levels) look at our wiki protocols page.
References
[1] Frederick KR, Tung J, Richard S. Emerick F, Chamberlain SH, Vasavada A, Steven R, Chakraborty S, Schopter LM, Schopter LM, Massey V. 1990. Glucose Oxidase from Aspergillus niger. J Biol Chem 265:3793–3802.
| None |


